| Param | Original file | Final file |
|---|---|---|
| Filename | modeM0/AS1G08_034T02_9000002136_14483cztM0_level2.evt | modeM0/AS1G08_034T02_9000002136_14483cztM0_level2_quad_clean.evt |
| Size (bytes) | 460,451,520 | 68,304,960 |
| Size | 439.1 MB | 65.1 MB |
| Events in quadrant A | 3,203,242 | 412,406 |
| Events in quadrant B | 3,554,263 | 404,249 |
| Events in quadrant C | 3,395,237 | 397,354 |
| Events in quadrant D | 3,345,908 | 395,954 |
| Mode M0 | |||
|---|---|---|---|
| Quadrant | BADHDUFLAG | Total packets | Discarded packets |
| A | 0 | 13643 | 2 |
| B | 0 | 14728 | 1 |
| C | 0 | 14363 | 1 |
| D | 0 | 14317 | 1 |
| Mode SS | |||
|---|---|---|---|
| Quadrant | BADHDUFLAG | Total packets | Discarded packets |
| A | 0 | 134 | 0 |
| B | 0 | 134 | 0 |
| C | 0 | 134 | 0 |
| D | 0 | 134 | 0 |
| Mode M9 | |||
|---|---|---|---|
| Quadrant | BADHDUFLAG | Total packets | Discarded packets |
| A | 0 | 8 | 0 |
| B | 0 | 8 | 0 |
| C | 0 | 8 | 0 |
| D | 0 | 8 | 0 |
| Quadrant | Total seconds | Saturated seconds | Saturation percentage |
|---|---|---|---|
| A | 6567 | 62 | 0.944115% |
| B | 6567 | 90 | 1.370489% |
| C | 6567 | 59 | 0.898432% |
| D | 6567 | 84 | 1.279123% |
Noise dominated data is calculated using 1-second bins in cleaned event files. If a bin has >2000 counts, and if more than 50% of those come from <1% of pixels, then it is considered to be noise-dominated and hence unusable.
| Quadrant | # 1 sec bins | Bins with >0 counts | Bins with >2000 counts | High rate bins dominated by noise | Noise dominated (total time) | Noise dominated (detector-on time) | Marked lightcurve |
|---|---|---|---|---|---|---|---|
| A | 7448 | 6569 | 4 | 4 | 0.05% | 0.06% | 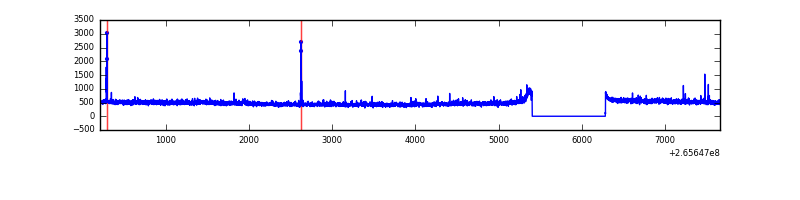 |
| B | 7448 | 6569 | 22 | 22 | 0.30% | 0.33% | 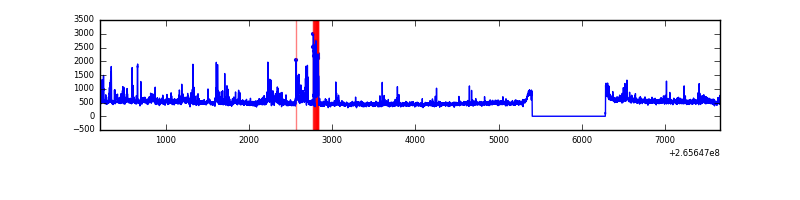 |
| C | 7448 | 6569 | 1 | 1 | 0.01% | 0.02% | 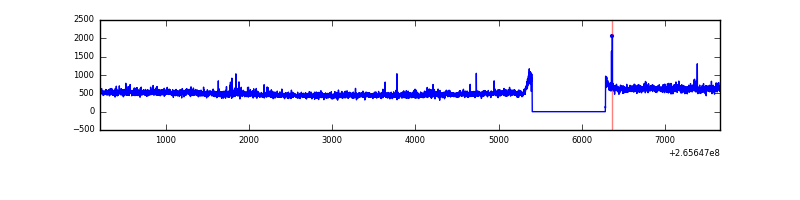 |
| D | 7448 | 6569 | 32 | 32 | 0.43% | 0.49% | 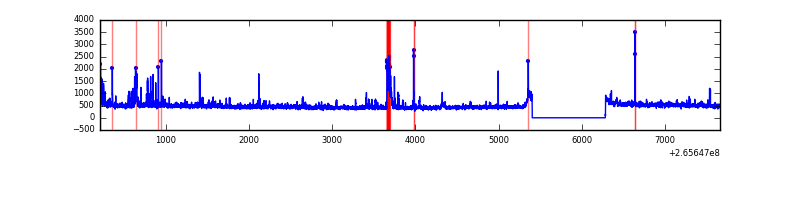 |
Top three noisy pixels from each quadrant. If the there are fewer than three noisy pixels in the level2.evt file, extra rows are filled as -1
| Pixel properties | Quadrant properties | ||||||
|---|---|---|---|---|---|---|---|
| Quadrant | DetID | PixID | Counts | Sigma | Mean | Median | Sigma |
| A | 12 | 189 | 27821 | 166.3 | 806 | 789 | 162.6 |
| A | 4 | 2 | 22955 | 136.36 | 806 | 789 | 162.6 |
| A | 8 | 15 | 17665 | 103.82 | 806 | 789 | 162.6 |
| B | 0 | 182 | 129641 | 832.25 | 801 | 781 | 154.8 |
| B | 0 | 189 | 115595 | 741.53 | 801 | 781 | 154.8 |
| B | 3 | 209 | 86836 | 555.79 | 801 | 781 | 154.8 |
| C | 3 | 233 | 313398 | 1728.74 | 777 | 780 | 180.8 |
| C | 0 | 207 | 48746 | 265.25 | 777 | 780 | 180.8 |
| C | 13 | 61 | 5477 | 25.97 | 777 | 780 | 180.8 |
| D | 2 | 120 | 112953 | 590.76 | 780 | 759 | 189.9 |
| D | 10 | 199 | 102249 | 534.39 | 780 | 759 | 189.9 |
| D | 10 | 70 | 58966 | 306.49 | 780 | 759 | 189.9 |
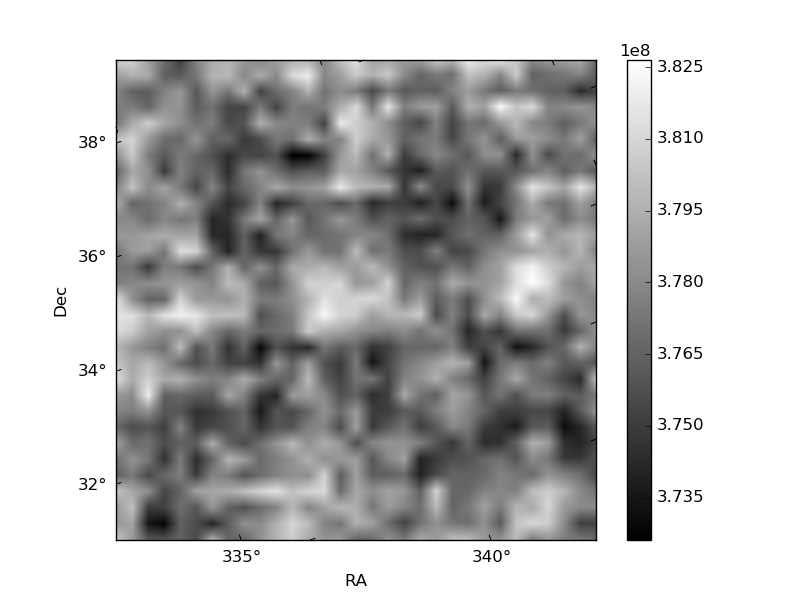
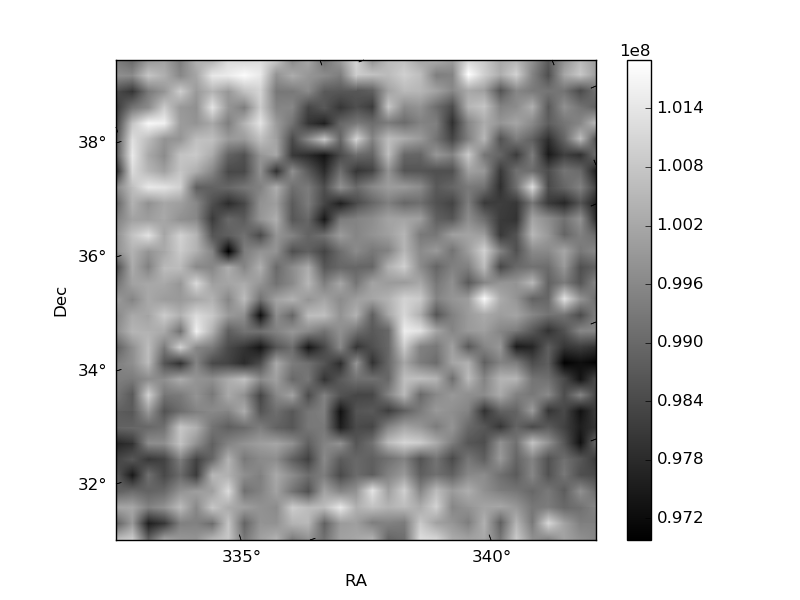
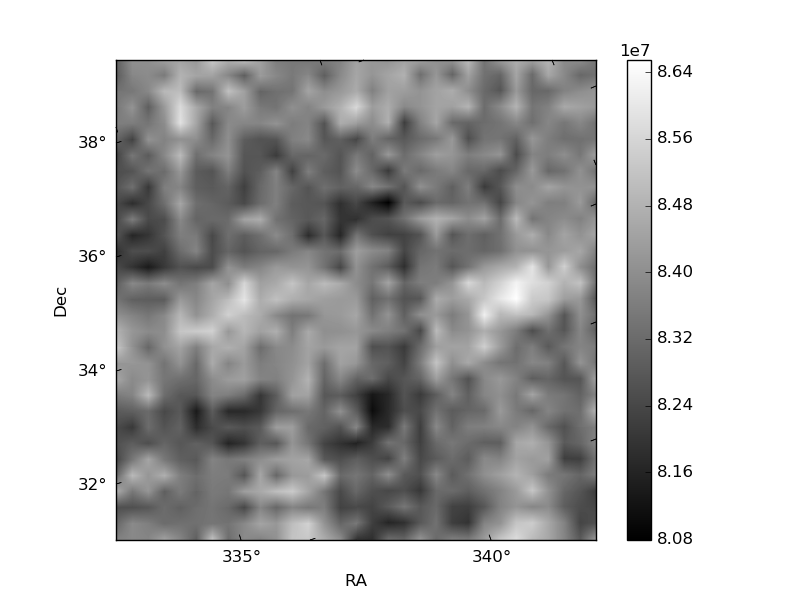
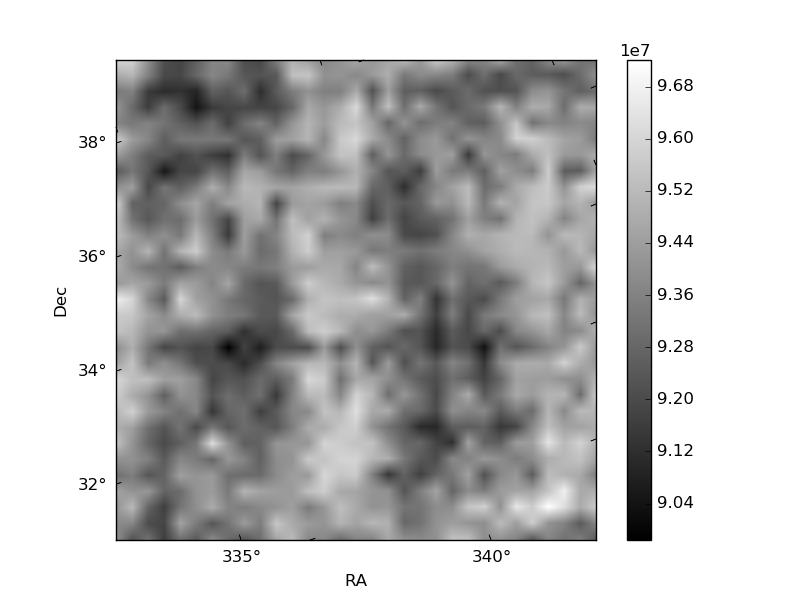
Histogram calculated using DETX and DETY for each event in the final _common_clean file
| Quadrant A | 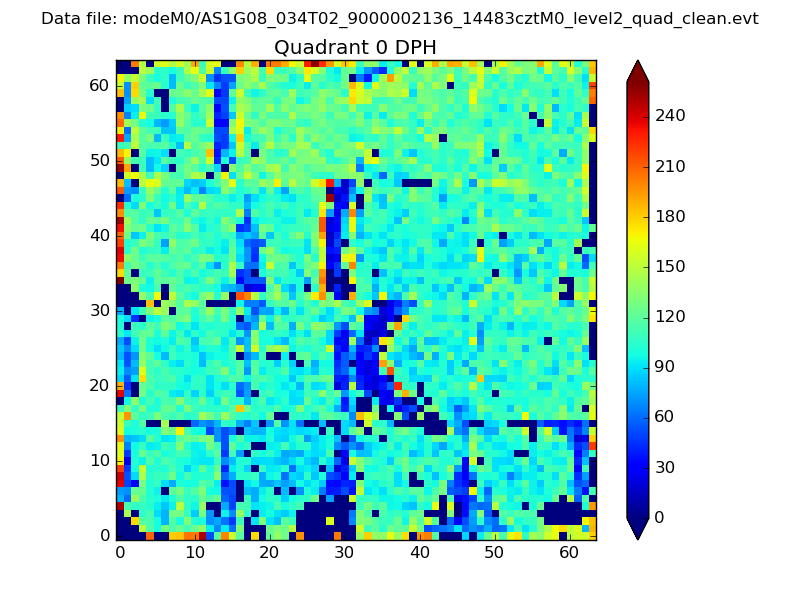 |
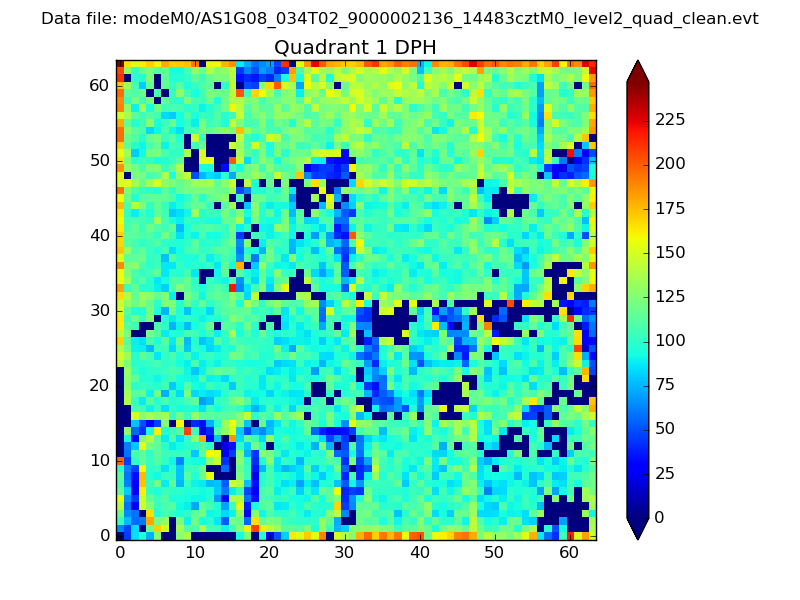 |
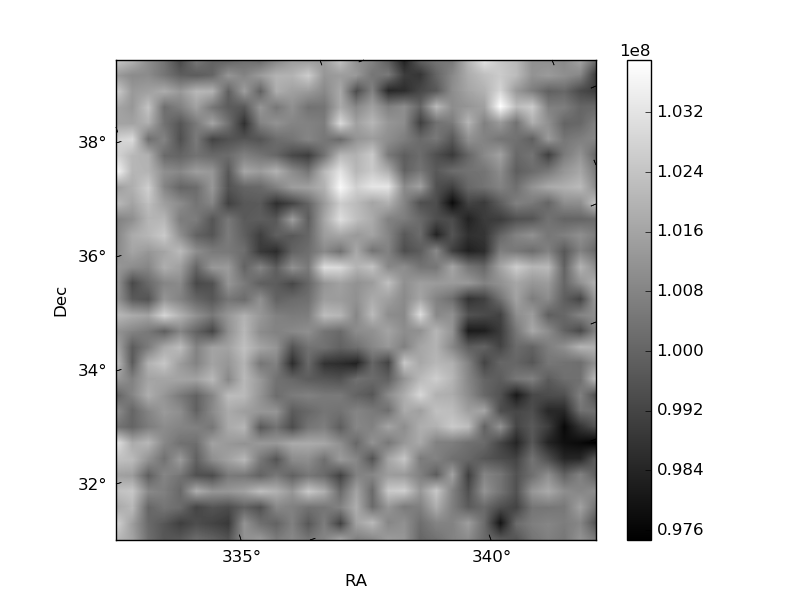
Quadrant B |
|---|---|---|---|
| Quadrant D | 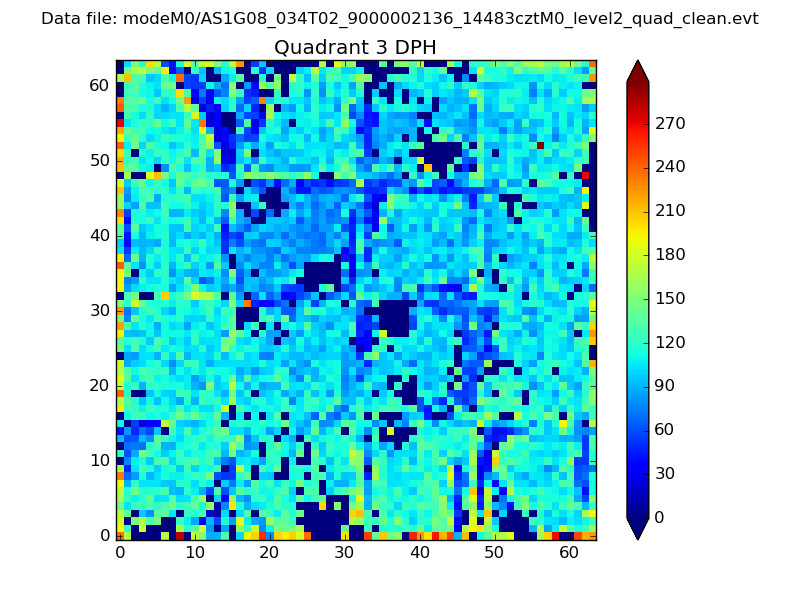 |
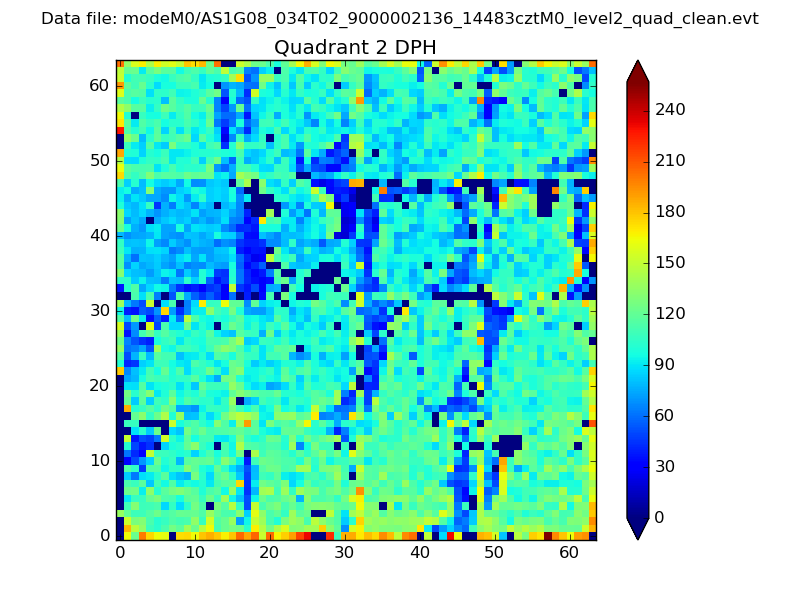 |
Quadrant C |
| Plot type | Count rate plots | Images |
|---|---|---|
| Comparison with Poisson distribution Blue bars denote a histogram of data divided into 1 sec bins. Red curve is a Poisson curve with rate = median count rate of data. |
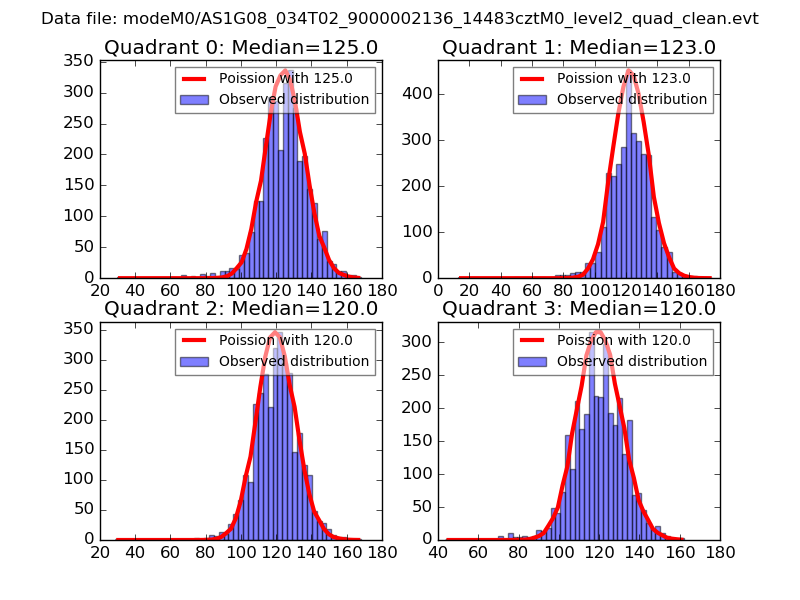 |
 |
| Quadrant-wise count rates Data is divided into 100 sec bins |
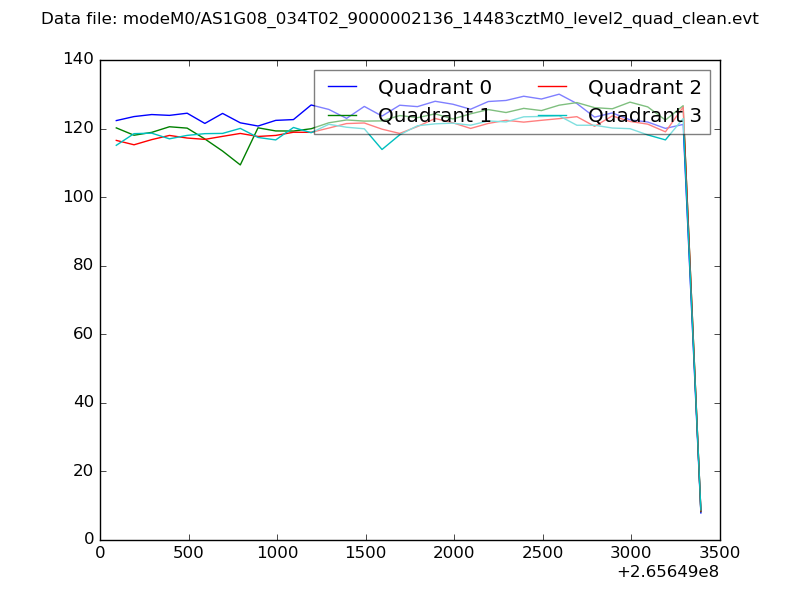 |
|
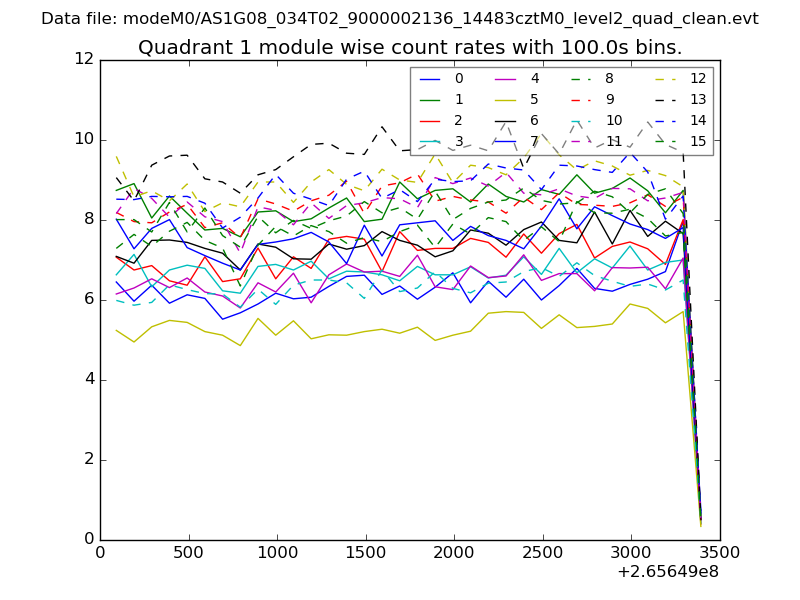
| Module-wise count rates for Quadrant A Data is divided into 100 sec bins |
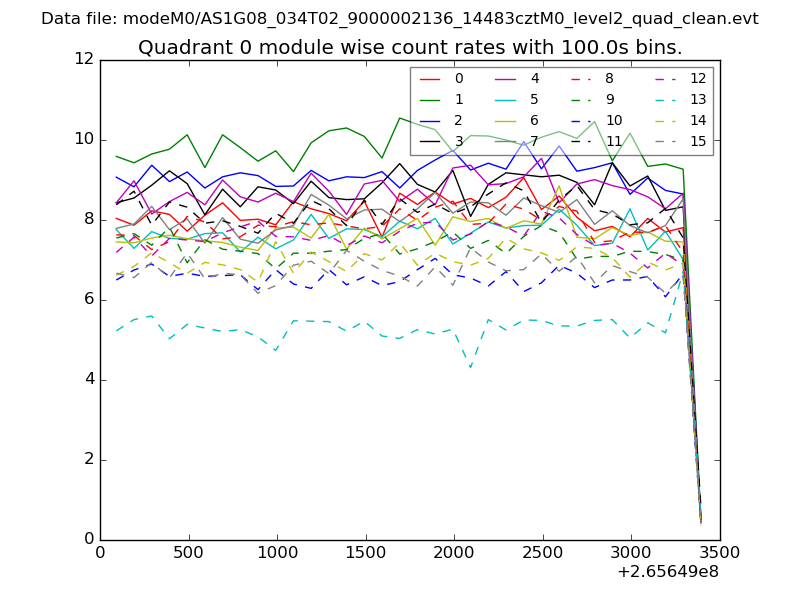 |
 |
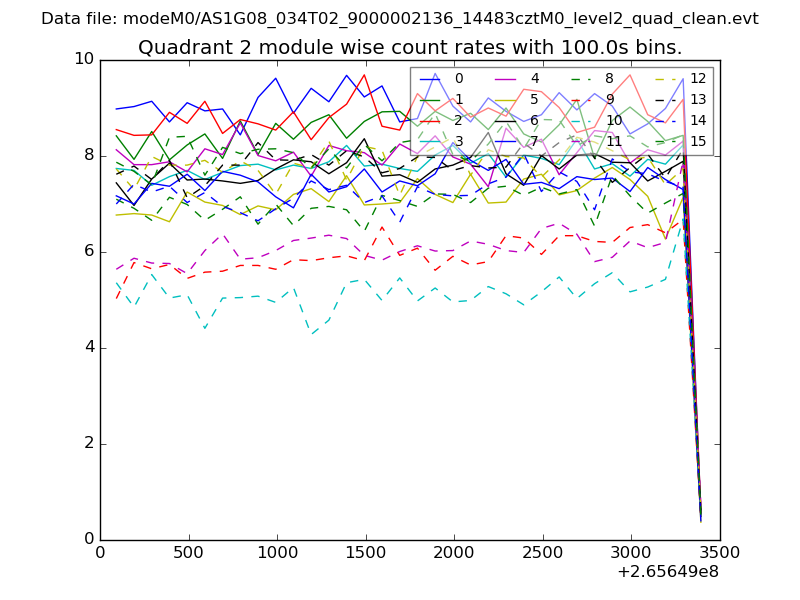
| Module-wise count rates for Quadrant B Data is divided into 100 sec bins |
 |
 |
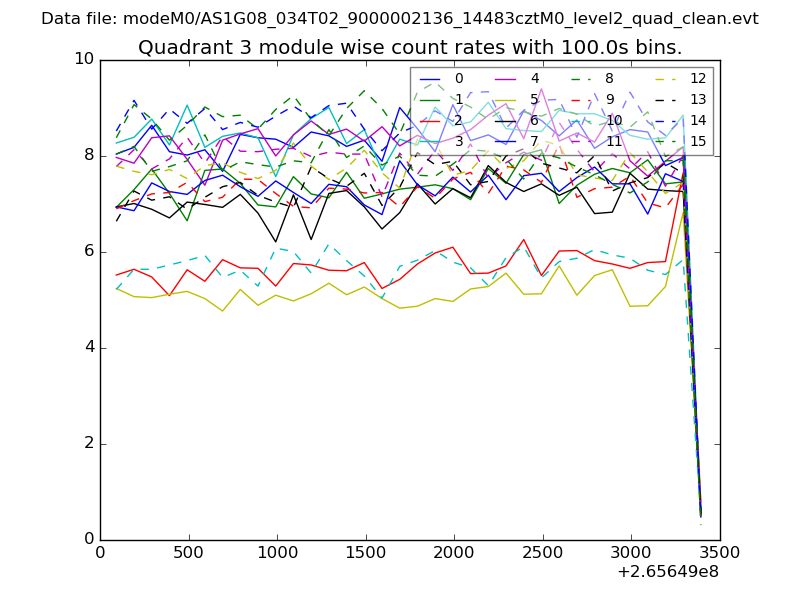
| Module-wise count rates for Quadrant C Data is divided into 100 sec bins |
 |
 |
| Module-wise count rates for Quadrant D Data is divided into 100 sec bins |
 |
 |
| Parameter | Plot |
|---|---|
| CZT HV Monitor | 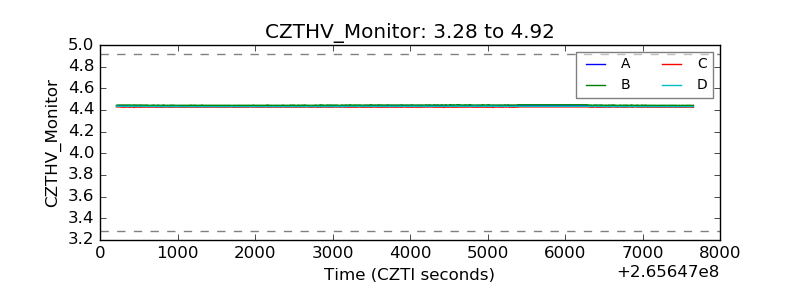 |
| D_VDD | 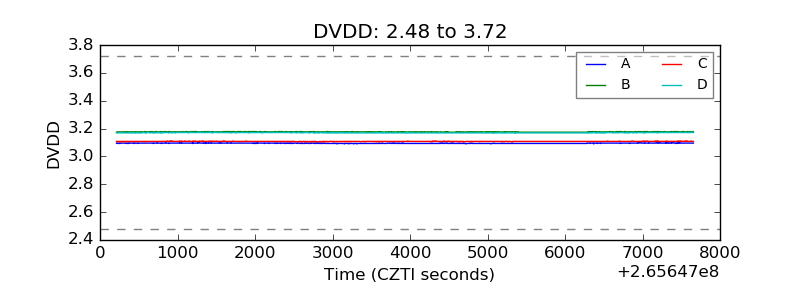 |
| Temperature 1 | 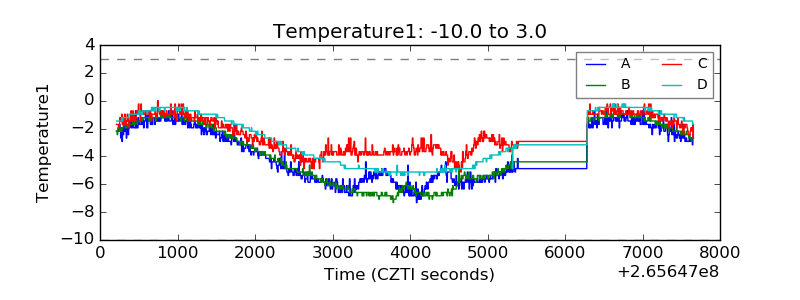 |
| Veto HV Monitor | 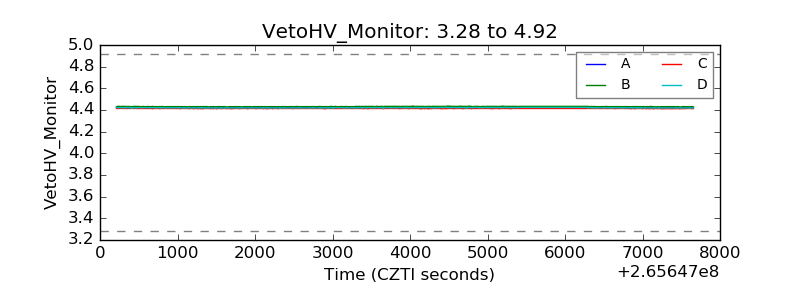 |
| Veto LLD | 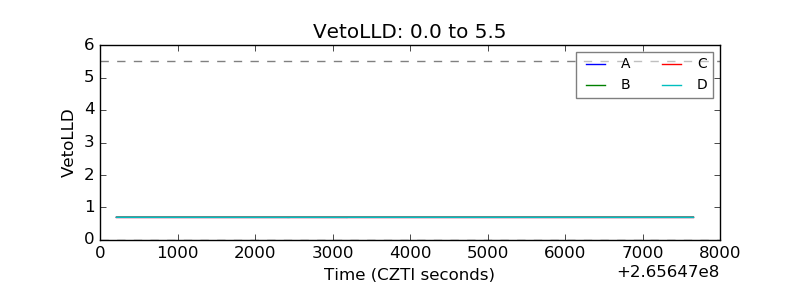 |
| Alpha Counter | 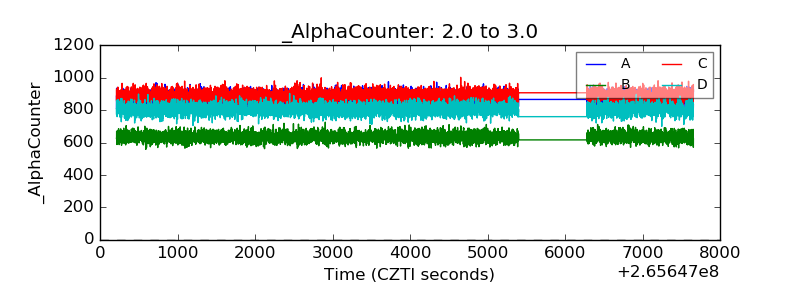 |
| _CPM_Rate | 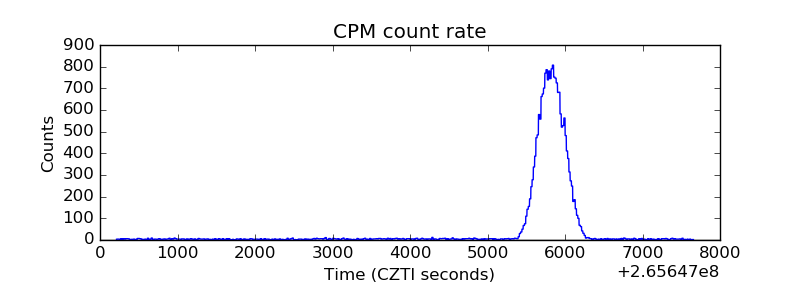 |
| CZT Counter | 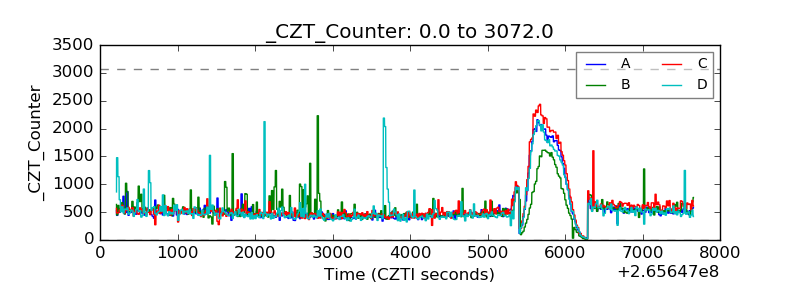 |
| +2.5 Volts monitor |  |
| +5 Volts monitor |  |
| _ROLL_ROT | 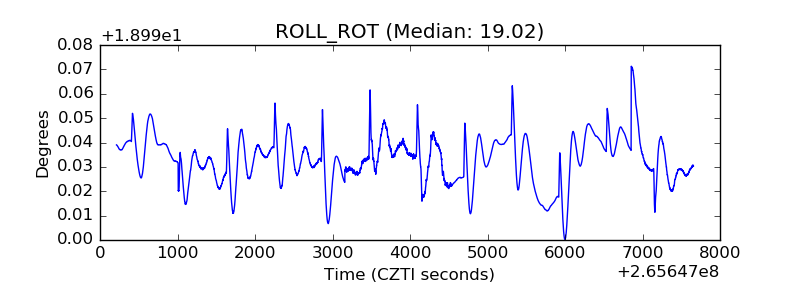 |
| _Roll_DEC | 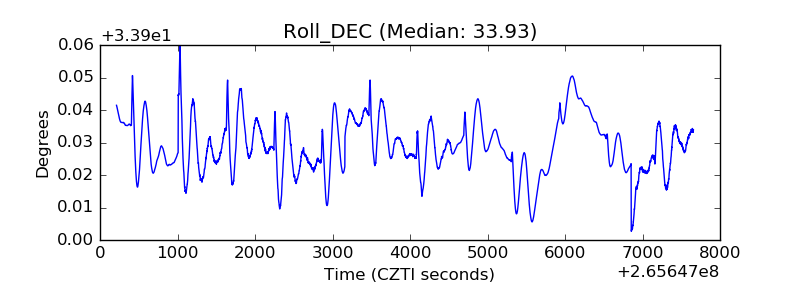 |
| _Roll_RA | 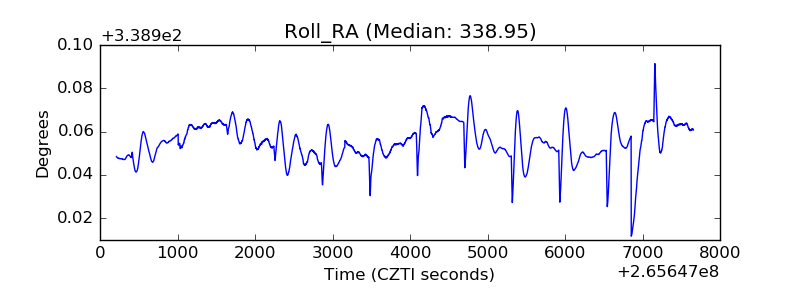 |
| Veto Counter | 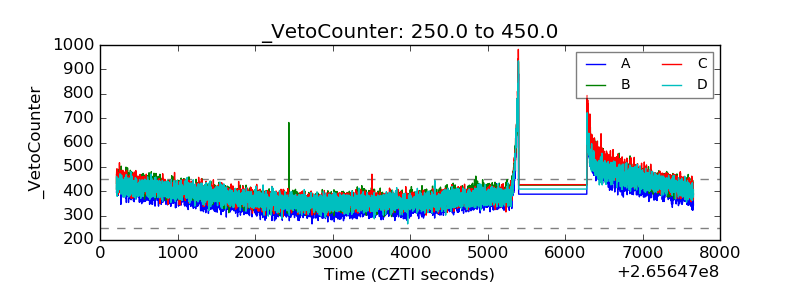 |