| Param | Original file | Final file |
|---|---|---|
| Filename | modeM0/AS1G08_034T02_9000002136_14484cztM0_level2.evt | modeM0/AS1G08_034T02_9000002136_14484cztM0_level2_quad_clean.evt |
| Size (bytes) | 469,376,640 | 73,759,680 |
| Size | 447.6 MB | 70.3 MB |
| Events in quadrant A | 3,267,782 | 454,502 |
| Events in quadrant B | 3,540,226 | 448,225 |
| Events in quadrant C | 3,567,838 | 441,538 |
| Events in quadrant D | 3,398,564 | 436,503 |
| Mode M0 | |||
|---|---|---|---|
| Quadrant | BADHDUFLAG | Total packets | Discarded packets |
| A | 0 | 14032 | 3 |
| B | 0 | 14769 | 2 |
| C | 0 | 15128 | 2 |
| D | 0 | 14498 | 2 |
| Mode SS | |||
|---|---|---|---|
| Quadrant | BADHDUFLAG | Total packets | Discarded packets |
| A | 0 | 134 | 0 |
| B | 0 | 134 | 0 |
| C | 0 | 134 | 0 |
| D | 0 | 134 | 0 |
| Mode M9 | |||
|---|---|---|---|
| Quadrant | BADHDUFLAG | Total packets | Discarded packets |
| A | 0 | 10 | 0 |
| B | 0 | 10 | 0 |
| C | 0 | 10 | 0 |
| D | 0 | 10 | 0 |
| Quadrant | Total seconds | Saturated seconds | Saturation percentage |
|---|---|---|---|
| A | 6482 | 68 | 1.049059% |
| B | 6482 | 77 | 1.187905% |
| C | 6482 | 58 | 0.894786% |
| D | 6483 | 72 | 1.110597% |
Noise dominated data is calculated using 1-second bins in cleaned event files. If a bin has >2000 counts, and if more than 50% of those come from <1% of pixels, then it is considered to be noise-dominated and hence unusable.
| Quadrant | # 1 sec bins | Bins with >0 counts | Bins with >2000 counts | High rate bins dominated by noise | Noise dominated (total time) | Noise dominated (detector-on time) | Marked lightcurve |
|---|---|---|---|---|---|---|---|
| A | 7518 | 6484 | 0 | 0 | 0.00% | 0.00% | 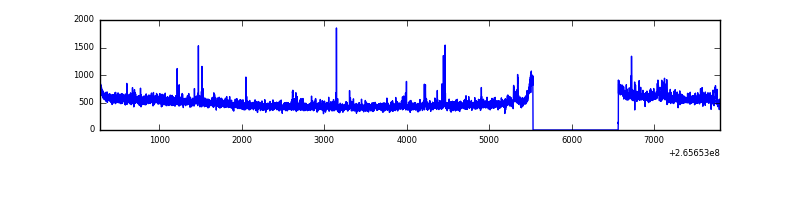 |
| B | 7518 | 6484 | 5 | 5 | 0.07% | 0.08% | 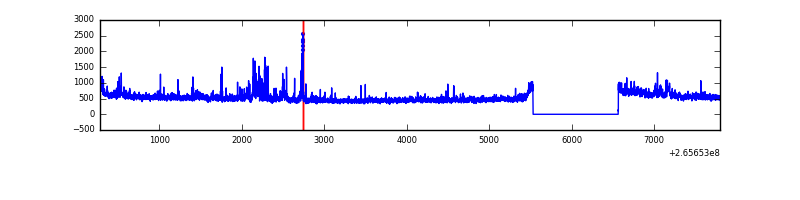 |
| C | 7518 | 6484 | 1 | 1 | 0.01% | 0.02% | 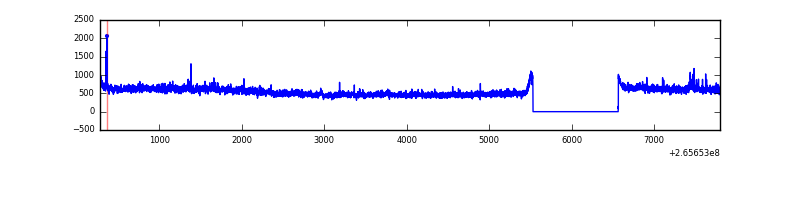 |
| D | 7519 | 6485 | 18 | 18 | 0.24% | 0.28% | 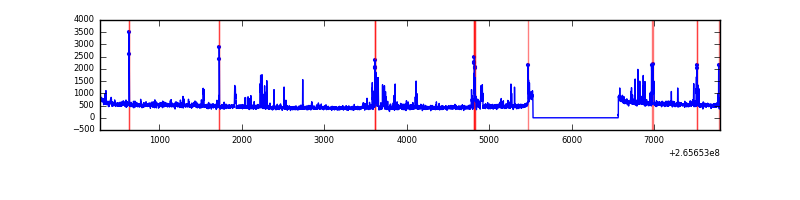 |
Top three noisy pixels from each quadrant. If the there are fewer than three noisy pixels in the level2.evt file, extra rows are filled as -1
| Pixel properties | Quadrant properties | ||||||
|---|---|---|---|---|---|---|---|
| Quadrant | DetID | PixID | Counts | Sigma | Mean | Median | Sigma |
| A | 12 | 189 | 66371 | 392.78 | 820 | 803 | 166.9 |
| A | 11 | 29 | 11463 | 63.86 | 820 | 803 | 166.9 |
| A | 4 | 2 | 11162 | 62.05 | 820 | 803 | 166.9 |
| B | 0 | 189 | 121946 | 787.9 | 814 | 797 | 153.8 |
| B | 3 | 209 | 61001 | 391.54 | 814 | 797 | 153.8 |
| B | 0 | 219 | 49989 | 319.92 | 814 | 797 | 153.8 |
| C | 3 | 233 | 410888 | 2238.87 | 792 | 796 | 183.2 |
| C | 0 | 207 | 62538 | 337.07 | 792 | 796 | 183.2 |
| C | 14 | 234 | 6984 | 33.78 | 792 | 796 | 183.2 |
| D | 12 | 110 | 148814 | 754.2 | 795 | 773 | 196.3 |
| D | 2 | 120 | 77988 | 393.37 | 795 | 773 | 196.3 |
| D | 10 | 199 | 77751 | 392.17 | 795 | 773 | 196.3 |
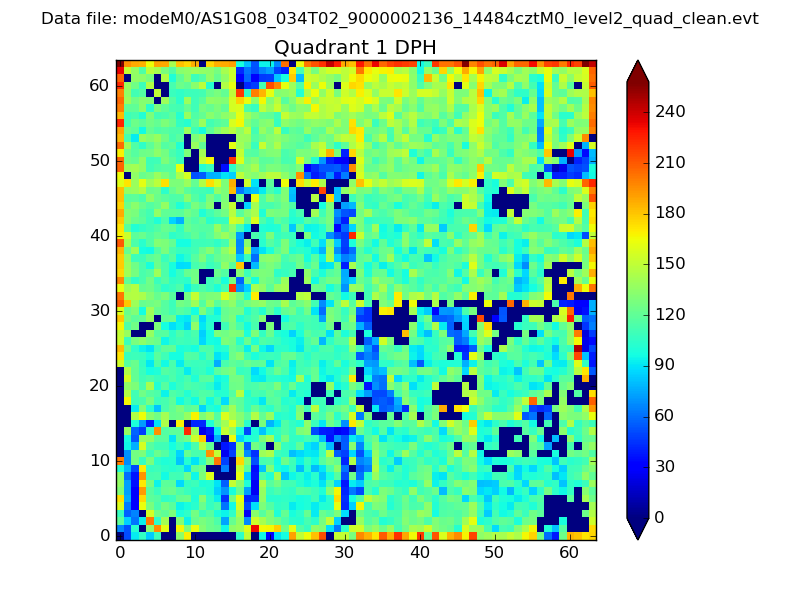
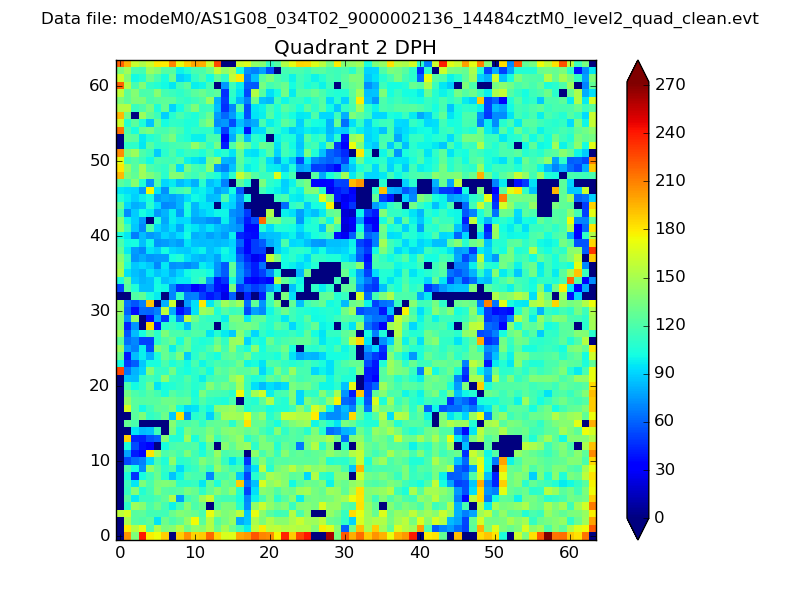
Histogram calculated using DETX and DETY for each event in the final _common_clean file
| Quadrant A |  |
 |
Quadrant B |
|---|---|---|---|
| Quadrant D |  |
 |
Quadrant C |
| Plot type | Count rate plots | Images |
|---|---|---|
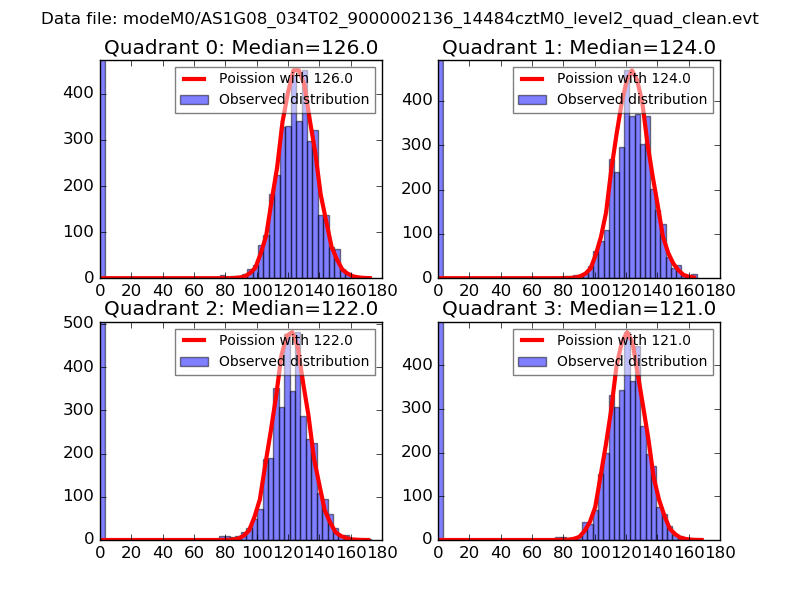
| Comparison with Poisson distribution Blue bars denote a histogram of data divided into 1 sec bins. Red curve is a Poisson curve with rate = median count rate of data. |
 |
 |
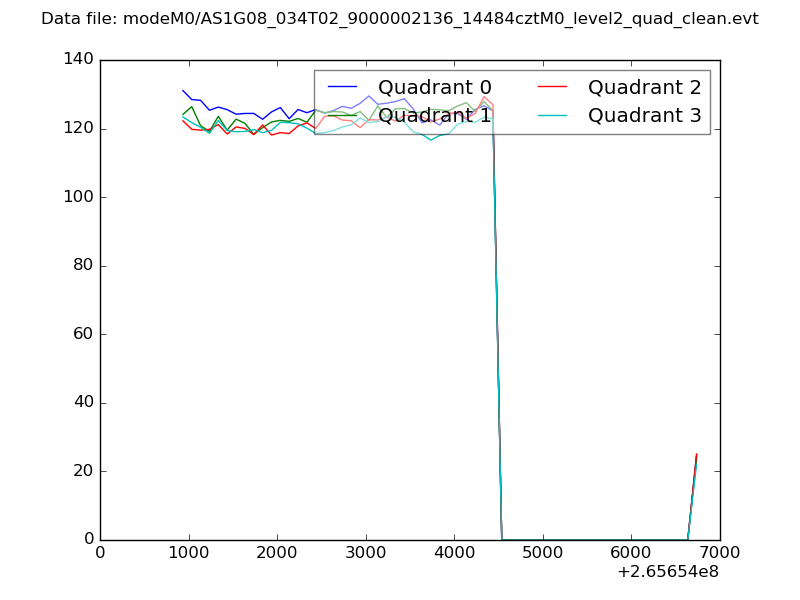
| Quadrant-wise count rates Data is divided into 100 sec bins |
 |
|
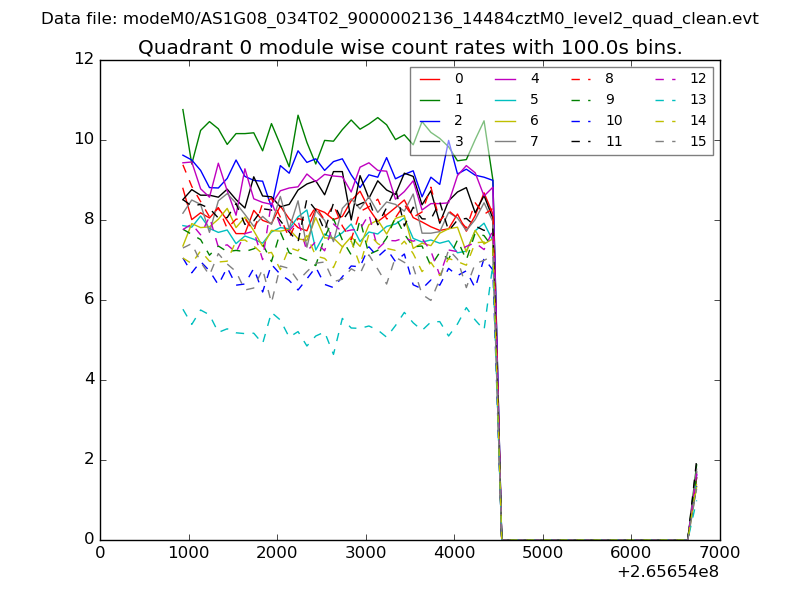
| Module-wise count rates for Quadrant A Data is divided into 100 sec bins |
 |
 |
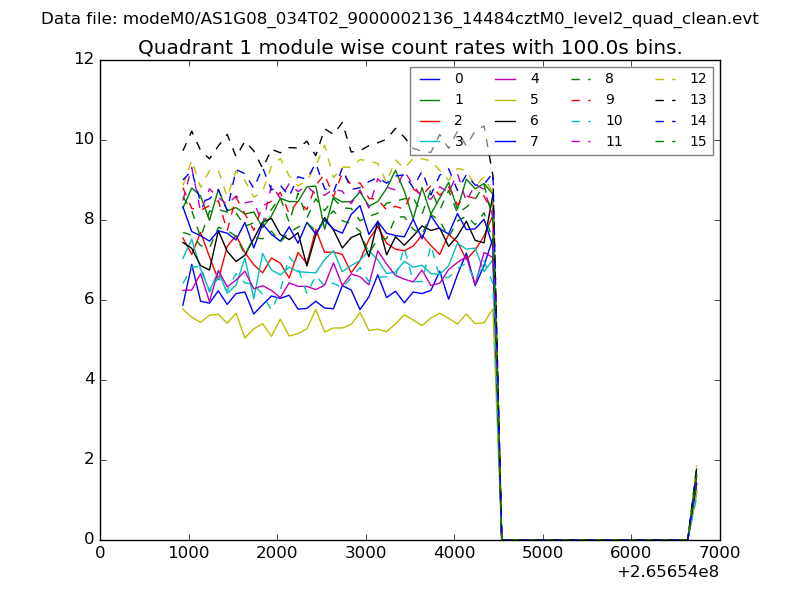
| Module-wise count rates for Quadrant B Data is divided into 100 sec bins |
 |
 |
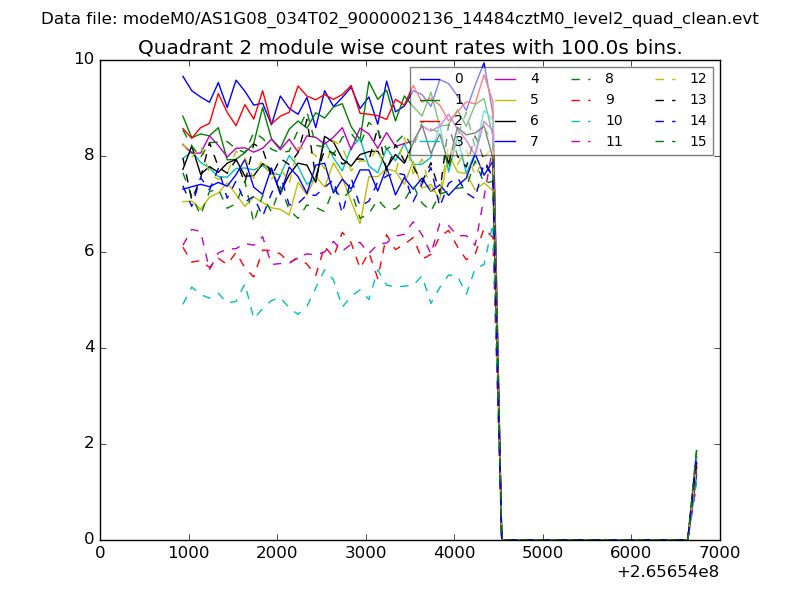
| Module-wise count rates for Quadrant C Data is divided into 100 sec bins |
 |
 |
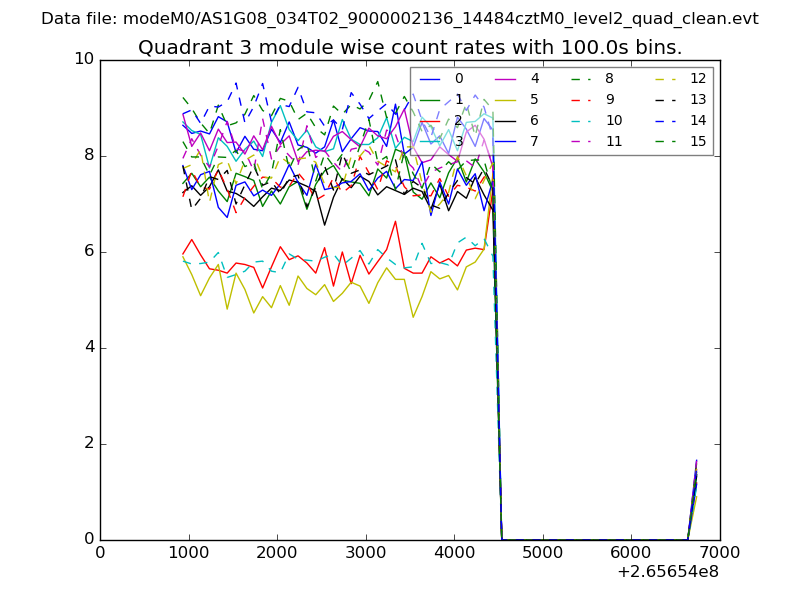
| Module-wise count rates for Quadrant D Data is divided into 100 sec bins |
 |
 |
| Parameter | Plot |
|---|---|
| CZT HV Monitor | 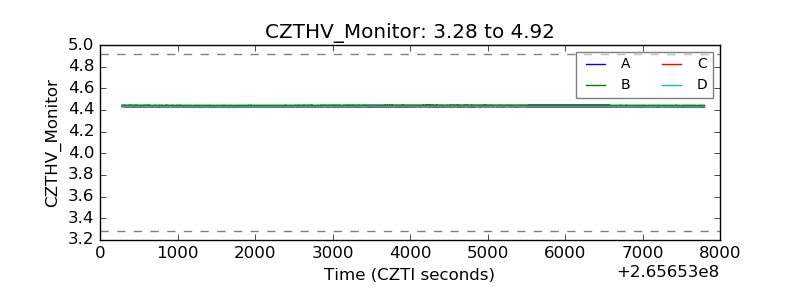 |
| D_VDD | 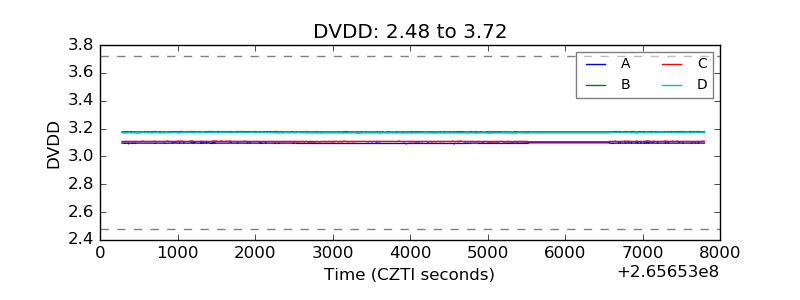 |
| Temperature 1 |  |
| Veto HV Monitor | 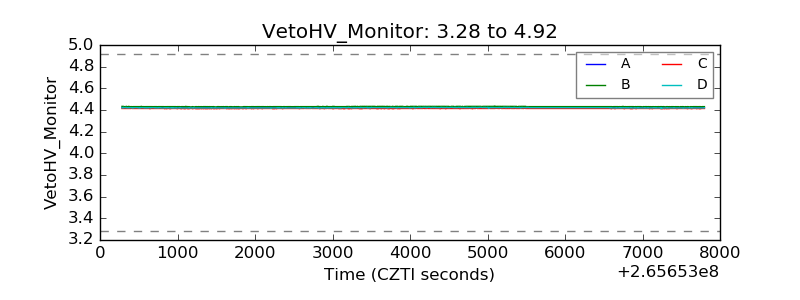 |
| Veto LLD |  |
| Alpha Counter | 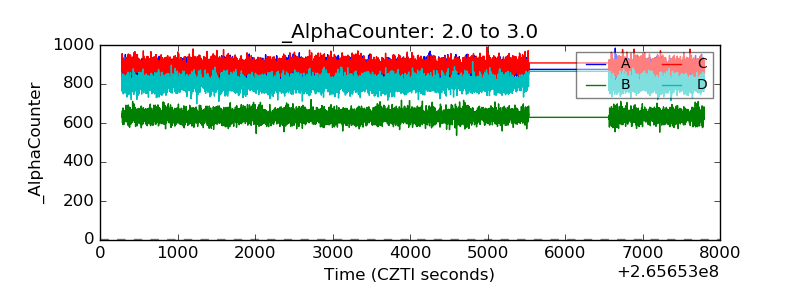 |
| _CPM_Rate | 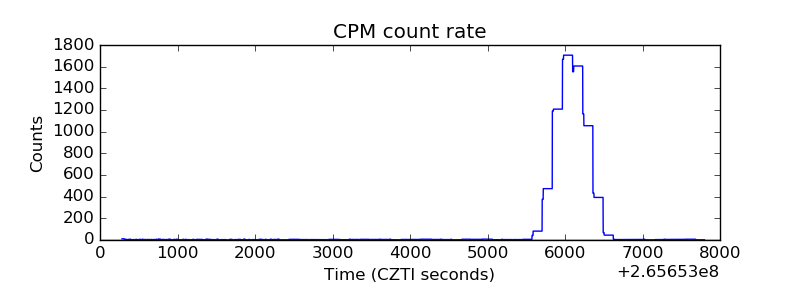 |
| CZT Counter | 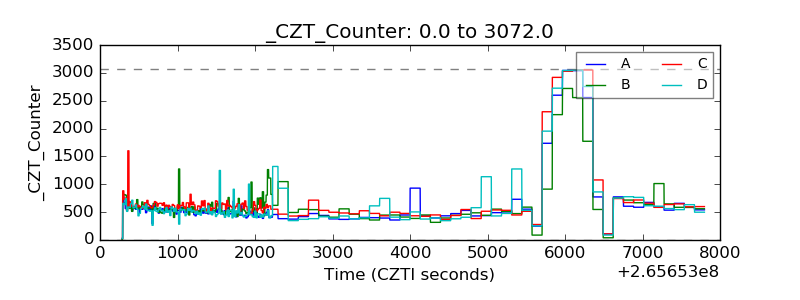 |
| +2.5 Volts monitor |  |
| +5 Volts monitor |  |
| _ROLL_ROT | 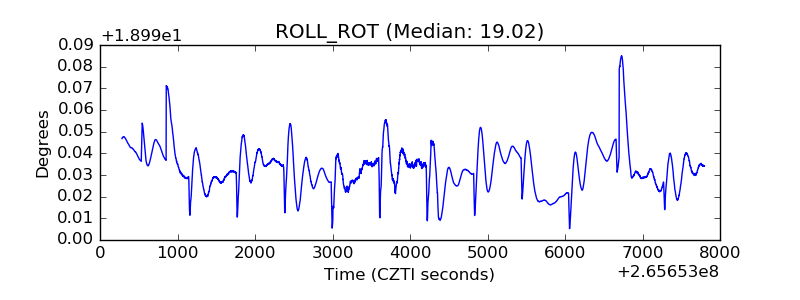 |
| _Roll_DEC | 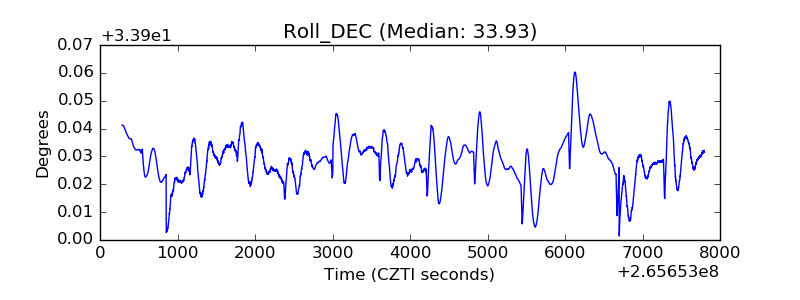 |
| _Roll_RA | 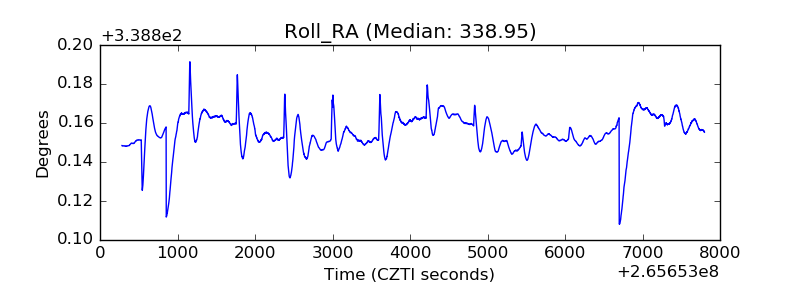 |
| Veto Counter | 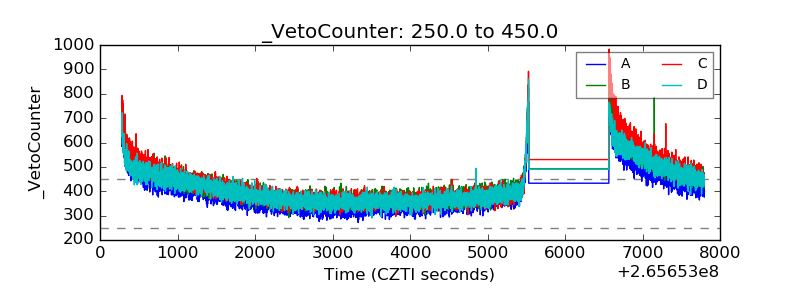 |