| Param | Original file | Final file |
|---|---|---|
| Filename | modeM0/AS1G08_034T02_9000002136_14485cztM0_level2.evt | modeM0/AS1G08_034T02_9000002136_14485cztM0_level2_quad_clean.evt |
| Size (bytes) | 476,562,240 | 85,020,480 |
| Size | 454.5 MB | 81.1 MB |
| Events in quadrant A | 3,307,894 | 539,748 |
| Events in quadrant B | 3,519,987 | 538,494 |
| Events in quadrant C | 3,594,062 | 530,686 |
| Events in quadrant D | 3,581,764 | 524,682 |
| Mode M0 | |||
|---|---|---|---|
| Quadrant | BADHDUFLAG | Total packets | Discarded packets |
| A | 0 | 14062 | 3 |
| B | 0 | 14822 | 2 |
| C | 0 | 14921 | 2 |
| D | 0 | 15041 | 2 |
| Mode SS | |||
|---|---|---|---|
| Quadrant | BADHDUFLAG | Total packets | Discarded packets |
| A | 0 | 128 | 0 |
| B | 0 | 128 | 0 |
| C | 0 | 128 | 0 |
| D | 0 | 128 | 0 |
| Mode M9 | |||
|---|---|---|---|
| Quadrant | BADHDUFLAG | Total packets | Discarded packets |
| A | 0 | 13 | 0 |
| B | 0 | 13 | 0 |
| C | 0 | 13 | 0 |
| D | 0 | 14 | 0 |
| Quadrant | Total seconds | Saturated seconds | Saturation percentage |
|---|---|---|---|
| A | 6322 | 68 | 1.075609% |
| B | 6322 | 94 | 1.486871% |
| C | 6322 | 49 | 0.775071% |
| D | 6322 | 117 | 1.850680% |
Noise dominated data is calculated using 1-second bins in cleaned event files. If a bin has >2000 counts, and if more than 50% of those come from <1% of pixels, then it is considered to be noise-dominated and hence unusable.
| Quadrant | # 1 sec bins | Bins with >0 counts | Bins with >2000 counts | High rate bins dominated by noise | Noise dominated (total time) | Noise dominated (detector-on time) | Marked lightcurve |
|---|---|---|---|---|---|---|---|
| A | 7508 | 6324 | 7 | 7 | 0.09% | 0.11% | 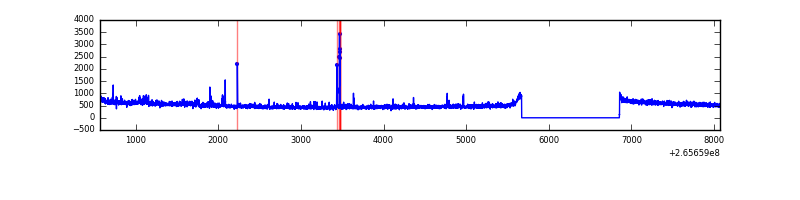 |
| B | 7508 | 6324 | 24 | 24 | 0.32% | 0.38% | 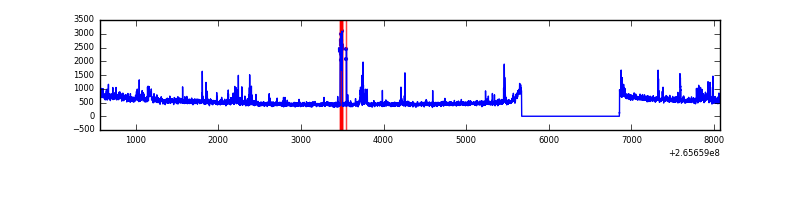 |
| C | 7508 | 6324 | 4 | 4 | 0.05% | 0.06% | 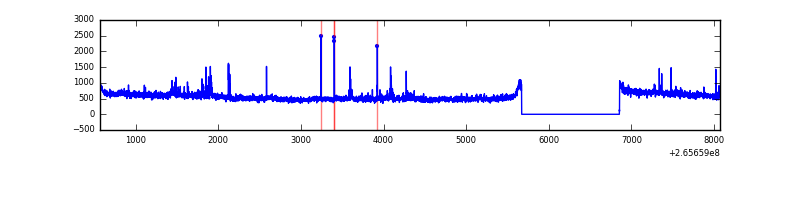 |
| D | 7508 | 6324 | 43 | 43 | 0.57% | 0.68% | 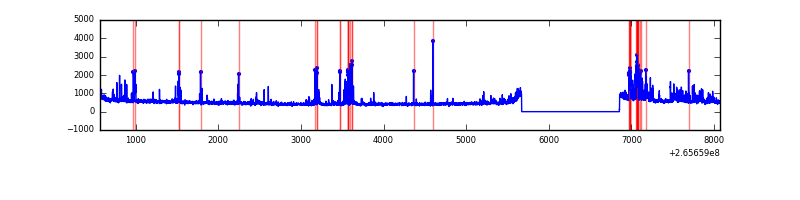 |
Top three noisy pixels from each quadrant. If the there are fewer than three noisy pixels in the level2.evt file, extra rows are filled as -1
| Pixel properties | Quadrant properties | ||||||
|---|---|---|---|---|---|---|---|
| Quadrant | DetID | PixID | Counts | Sigma | Mean | Median | Sigma |
| A | 12 | 189 | 72676 | 434.05 | 818 | 802 | 165.6 |
| A | 15 | 69 | 40007 | 236.76 | 818 | 802 | 165.6 |
| A | 8 | 15 | 25595 | 149.72 | 818 | 802 | 165.6 |
| B | 15 | 222 | 88719 | 575.51 | 815 | 796 | 152.8 |
| B | 3 | 209 | 66908 | 432.74 | 815 | 796 | 152.8 |
| B | 0 | 189 | 50032 | 322.28 | 815 | 796 | 152.8 |
| C | 3 | 233 | 309735 | 1687.44 | 799 | 807 | 183.1 |
| C | 0 | 207 | 163704 | 889.78 | 799 | 807 | 183.1 |
| C | 13 | 61 | 5720 | 26.84 | 799 | 807 | 183.1 |
| D | 2 | 120 | 379818 | 1865.22 | 797 | 778 | 203.2 |
| D | 10 | 199 | 66180 | 321.84 | 797 | 778 | 203.2 |
| D | 12 | 110 | 61151 | 297.09 | 797 | 778 | 203.2 |
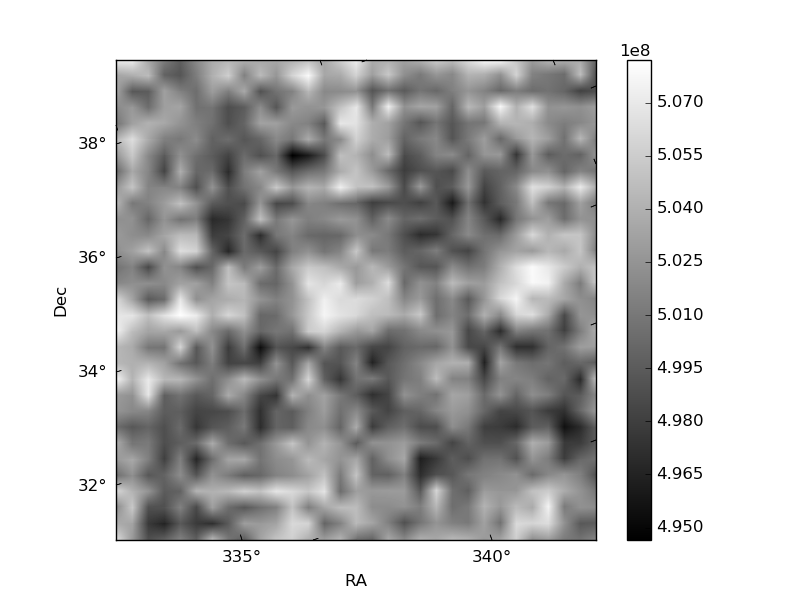
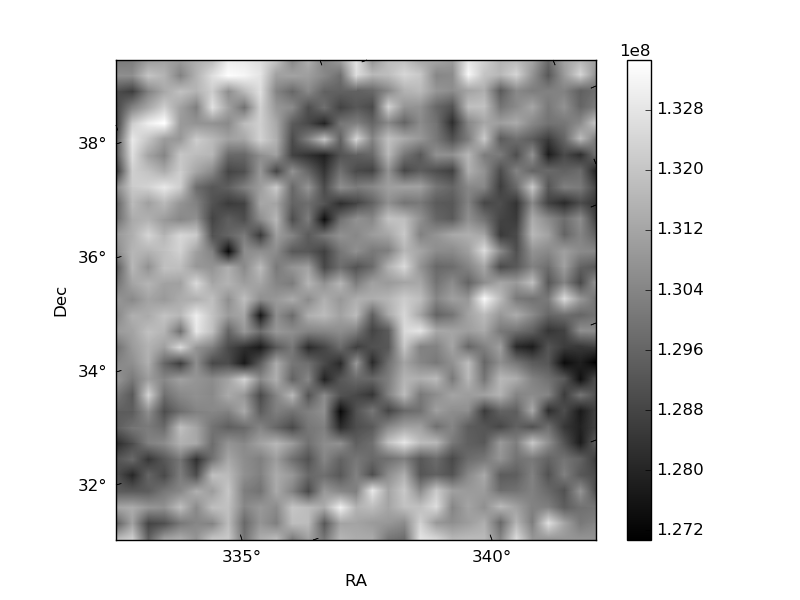
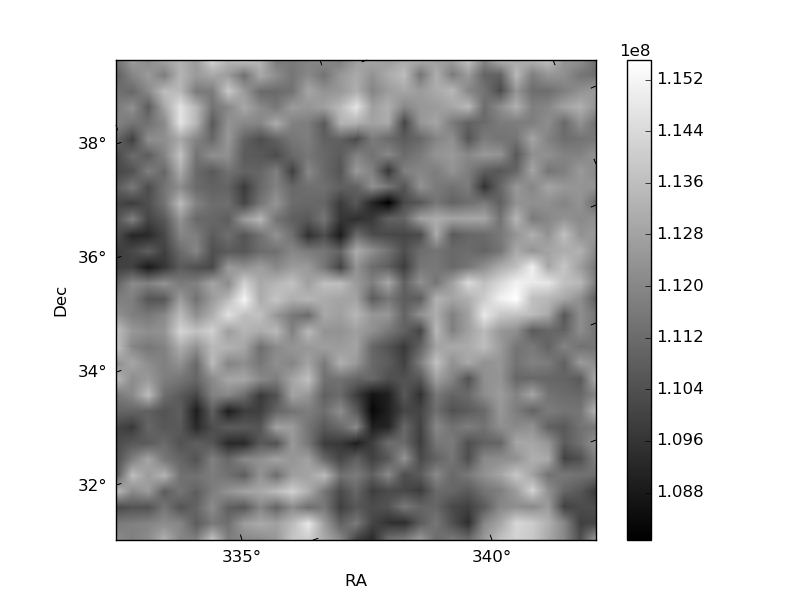
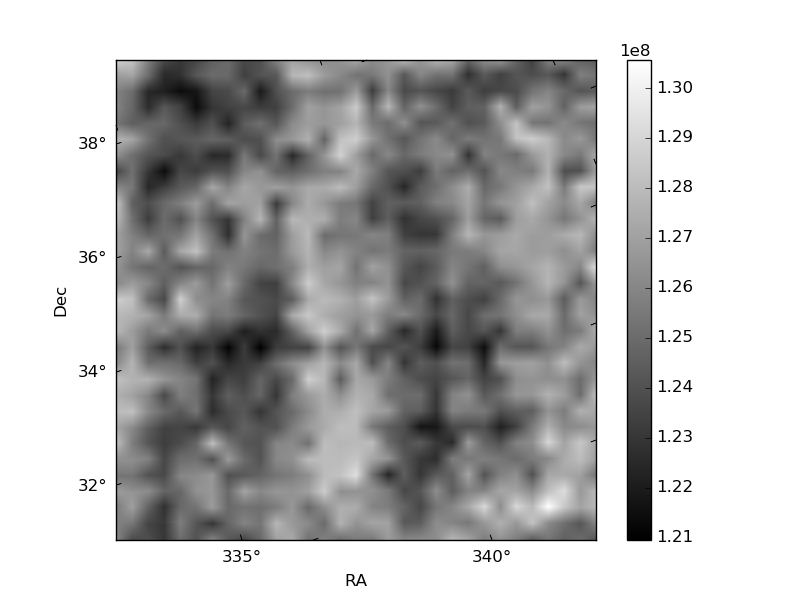
Histogram calculated using DETX and DETY for each event in the final _common_clean file
| Quadrant A | 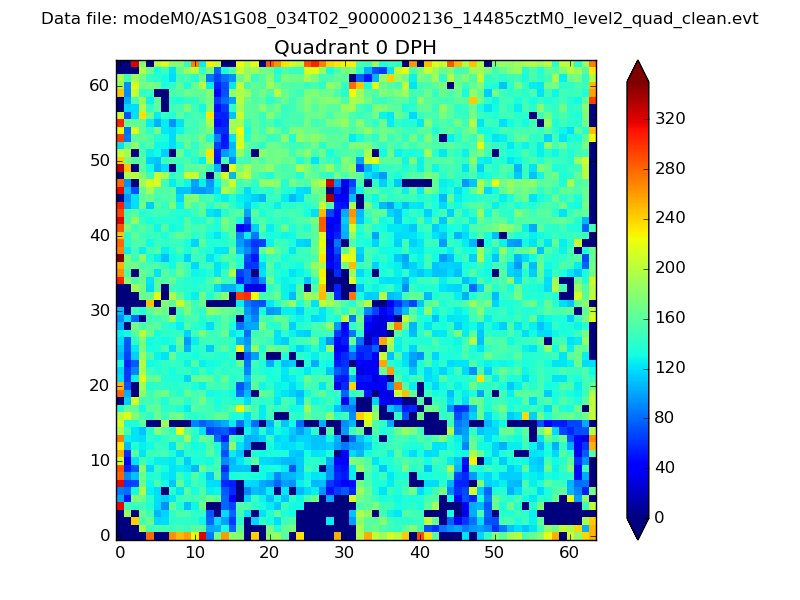 |
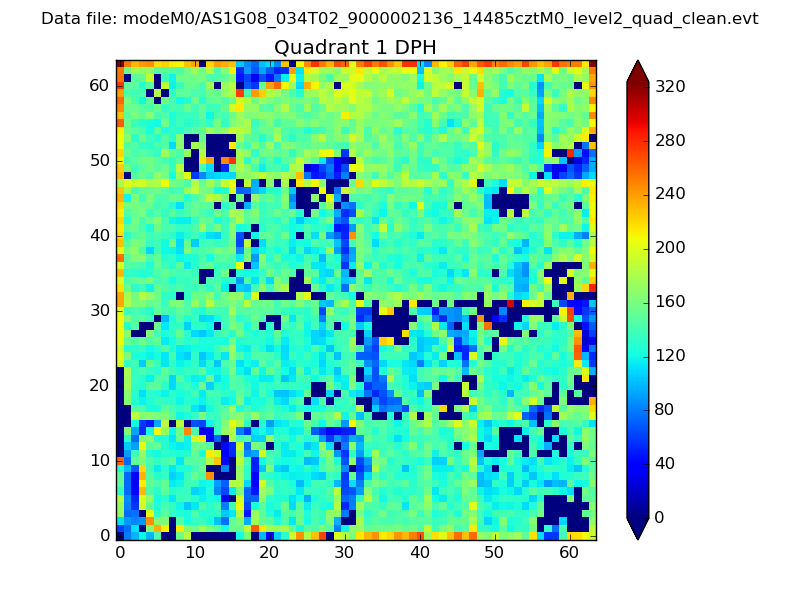 |
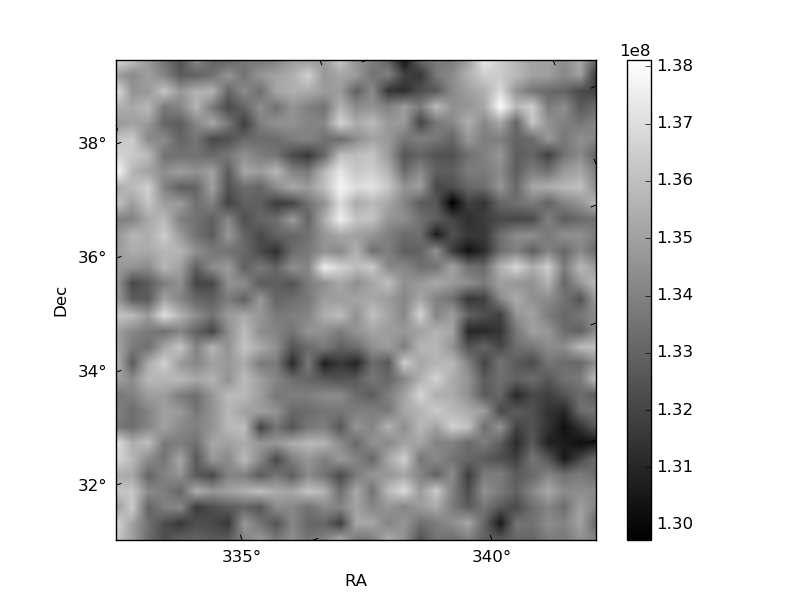
Quadrant B |
|---|---|---|---|
| Quadrant D | 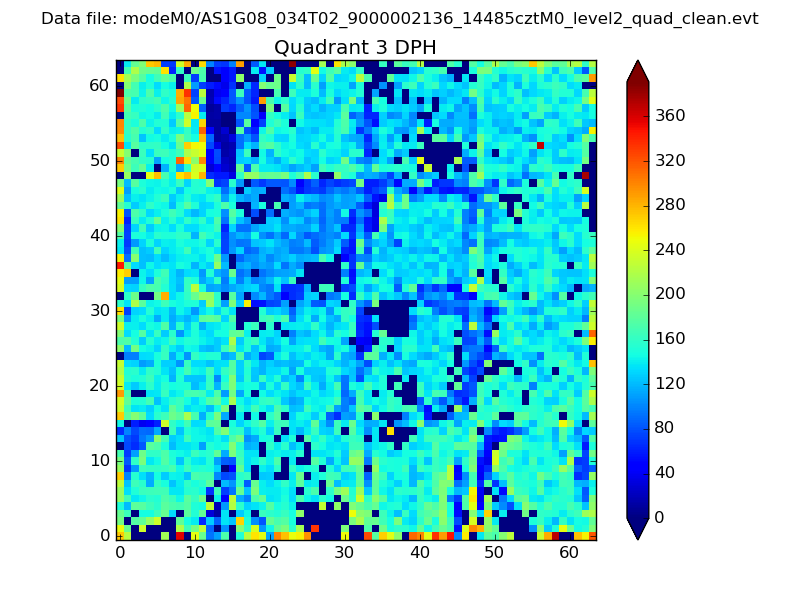 |
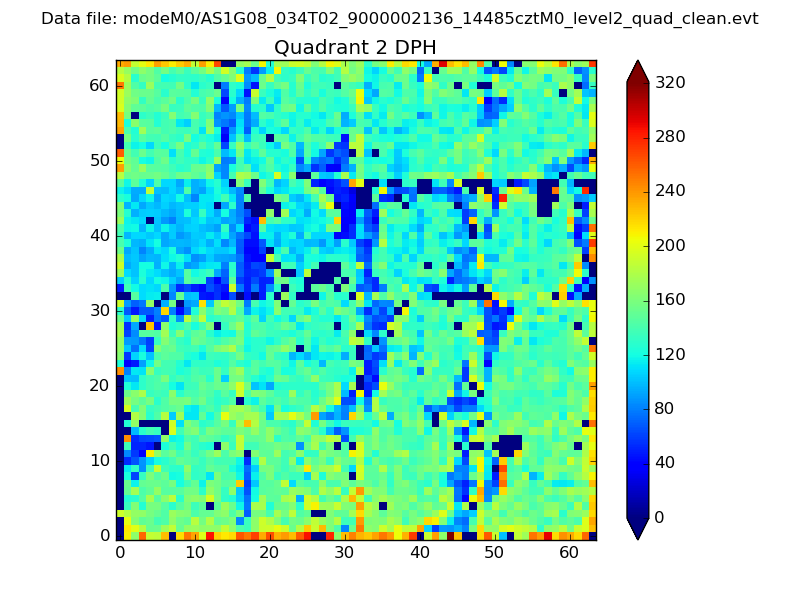 |
Quadrant C |
| Plot type | Count rate plots | Images |
|---|---|---|
| Comparison with Poisson distribution Blue bars denote a histogram of data divided into 1 sec bins. Red curve is a Poisson curve with rate = median count rate of data. |
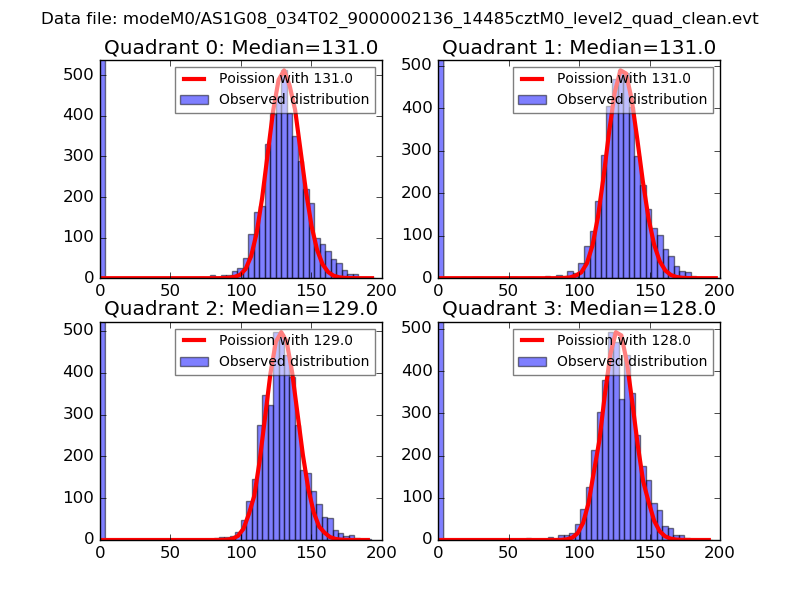 |
 |
| Quadrant-wise count rates Data is divided into 100 sec bins |
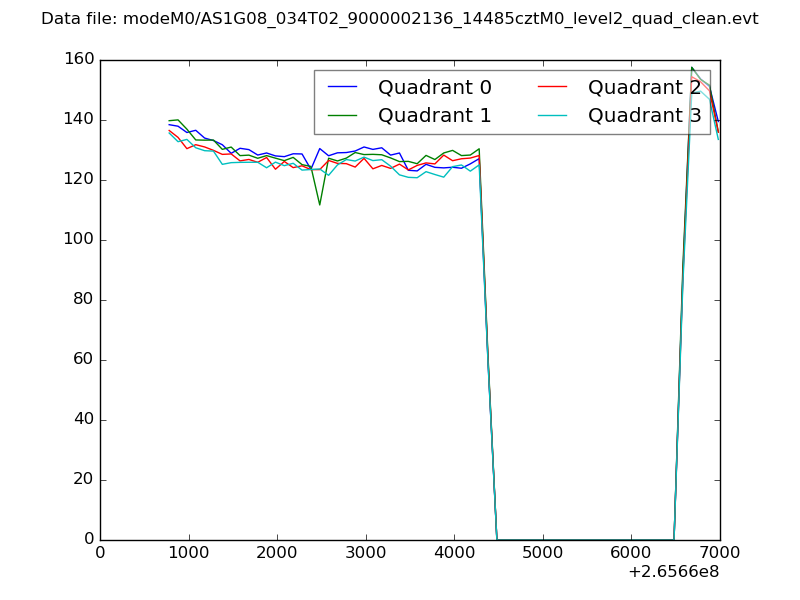 |
|
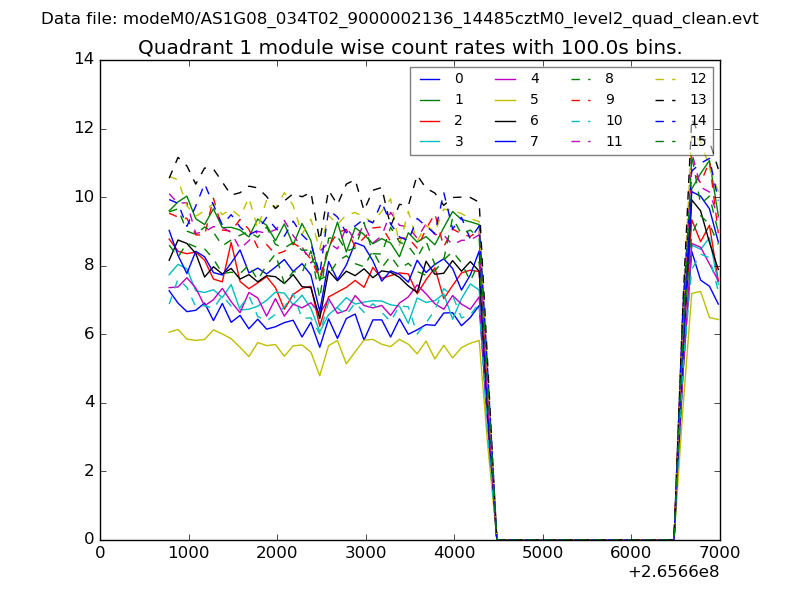
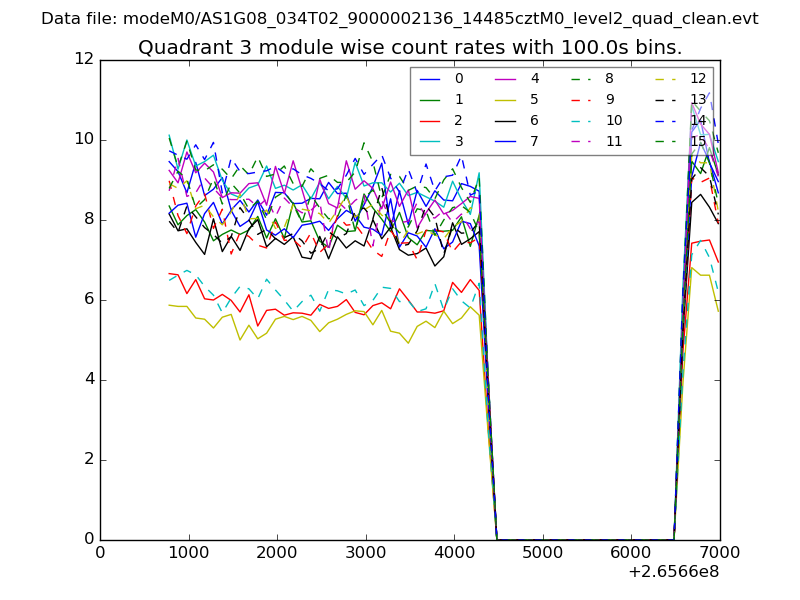
| Module-wise count rates for Quadrant A Data is divided into 100 sec bins |
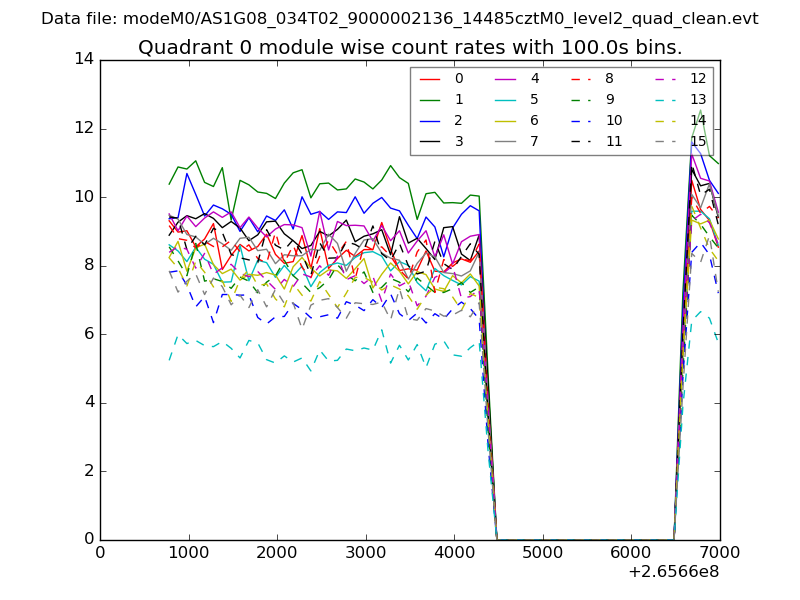 |
 |
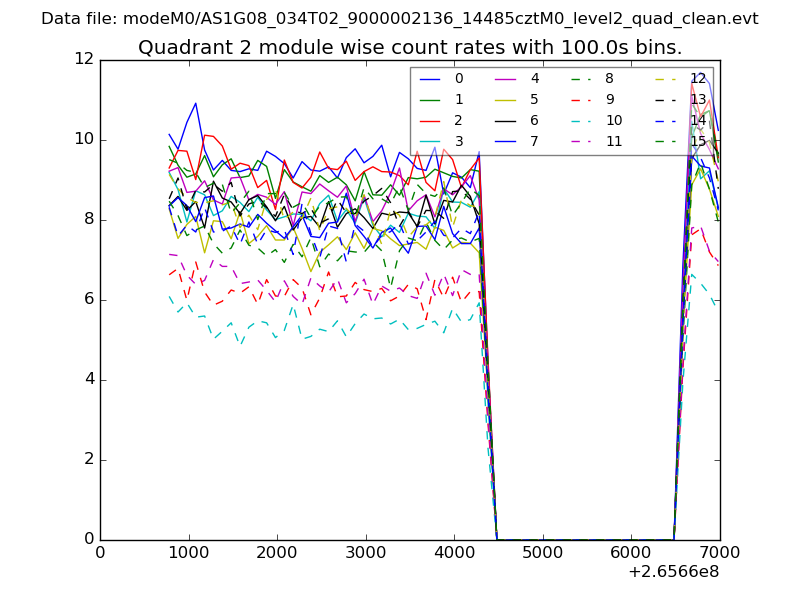
| Module-wise count rates for Quadrant B Data is divided into 100 sec bins |
 |
 |
| Module-wise count rates for Quadrant C Data is divided into 100 sec bins |
 |
 |
| Module-wise count rates for Quadrant D Data is divided into 100 sec bins |
 |
 |
| Parameter | Plot |
|---|---|
| CZT HV Monitor | 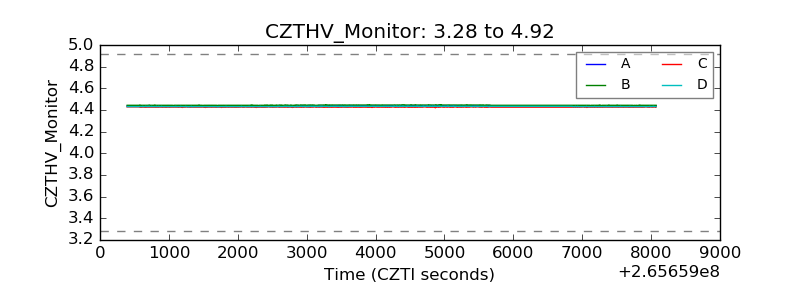 |
| D_VDD | 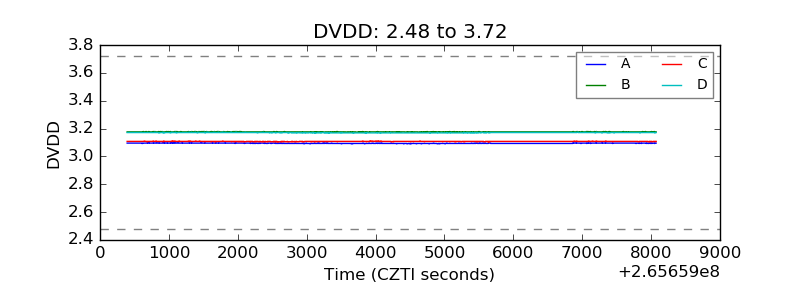 |
| Temperature 1 | 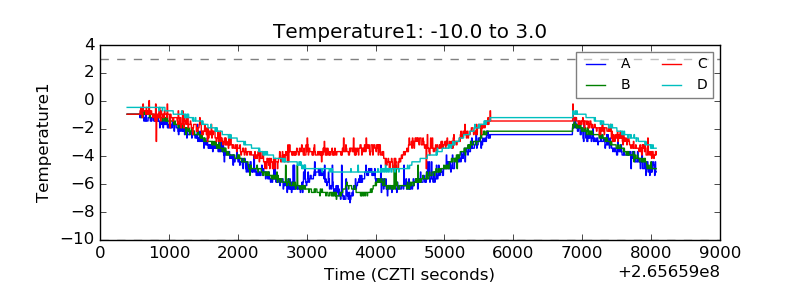 |
| Veto HV Monitor | 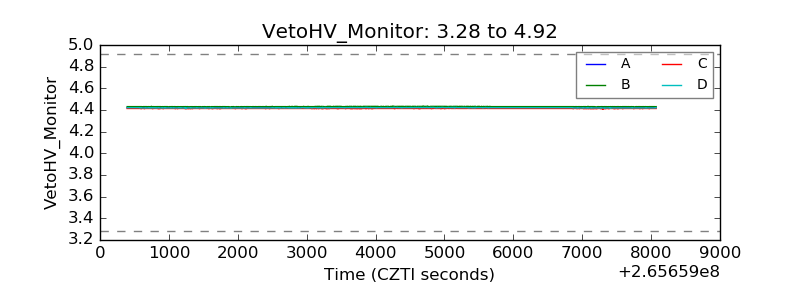 |
| Veto LLD | 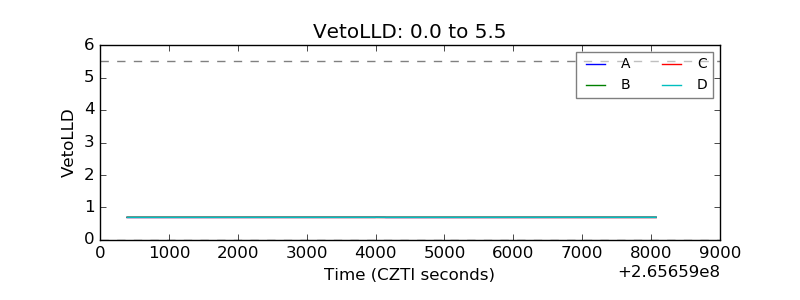 |
| Alpha Counter | 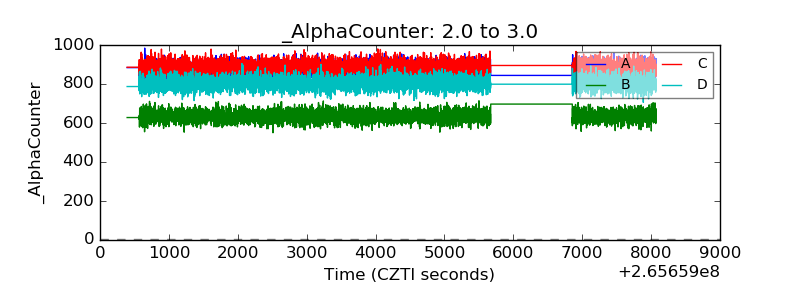 |
| _CPM_Rate | 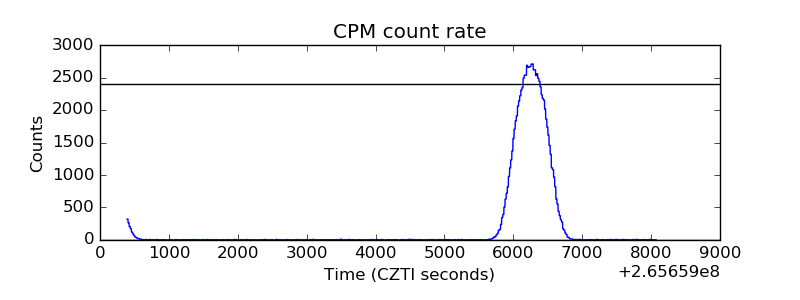 |
| CZT Counter |  |
| +2.5 Volts monitor | 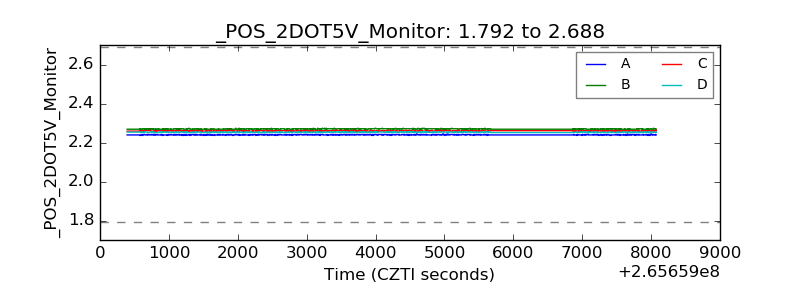 |
| +5 Volts monitor |  |
| _ROLL_ROT | 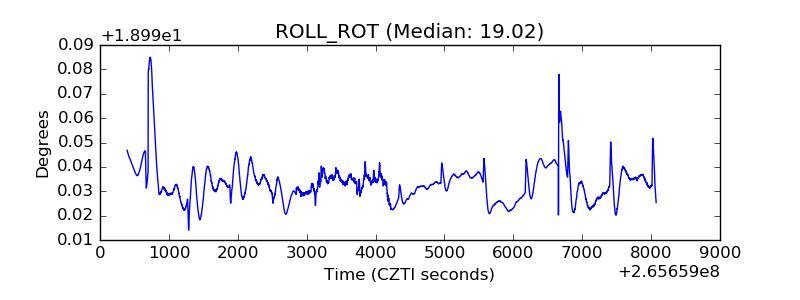 |
| _Roll_DEC | 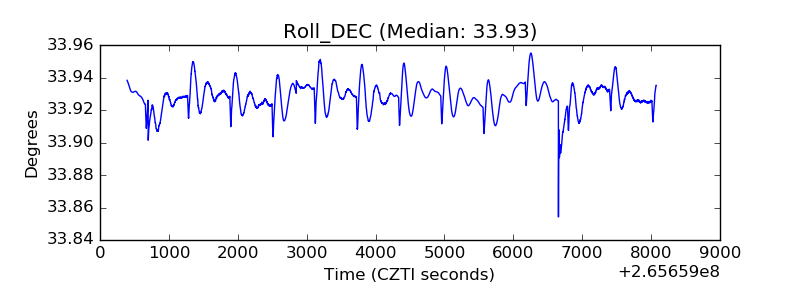 |
| _Roll_RA |  |
| Veto Counter | 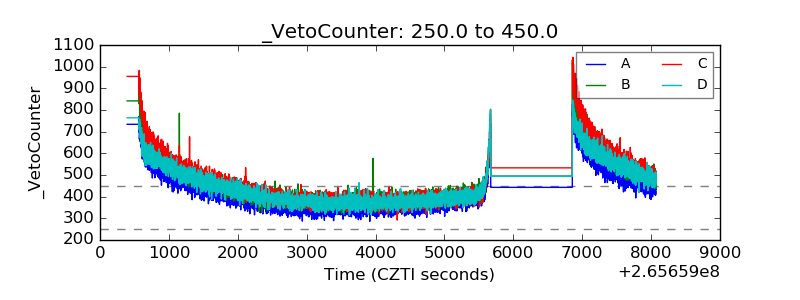 |