| Param | Original file | Final file |
|---|---|---|
| Filename | modeM0/AS1G08_034T02_9000002136_14487cztM0_level2.evt | modeM0/AS1G08_034T02_9000002136_14487cztM0_level2_quad_clean.evt |
| Size (bytes) | 461,571,840 | 96,937,920 |
| Size | 440.2 MB | 92.4 MB |
| Events in quadrant A | 3,217,484 | 628,737 |
| Events in quadrant B | 3,429,633 | 634,309 |
| Events in quadrant C | 3,429,022 | 628,951 |
| Events in quadrant D | 3,484,754 | 613,996 |
| Mode M0 | |||
|---|---|---|---|
| Quadrant | BADHDUFLAG | Total packets | Discarded packets |
| A | 0 | 13599 | 3 |
| B | 0 | 14453 | 2 |
| C | 0 | 14320 | 2 |
| D | 0 | 14605 | 2 |
| Mode SS | |||
|---|---|---|---|
| Quadrant | BADHDUFLAG | Total packets | Discarded packets |
| A | 0 | 126 | 0 |
| B | 0 | 126 | 0 |
| C | 0 | 126 | 0 |
| D | 0 | 126 | 0 |
| Mode M9 | |||
|---|---|---|---|
| Quadrant | BADHDUFLAG | Total packets | Discarded packets |
| A | 0 | 20 | 0 |
| B | 0 | 20 | 0 |
| C | 0 | 20 | 0 |
| D | 0 | 21 | 0 |
| Quadrant | Total seconds | Saturated seconds | Saturation percentage |
|---|---|---|---|
| A | 6153 | 48 | 0.780107% |
| B | 6153 | 64 | 1.040143% |
| C | 6153 | 39 | 0.633837% |
| D | 6153 | 102 | 1.657728% |
Noise dominated data is calculated using 1-second bins in cleaned event files. If a bin has >2000 counts, and if more than 50% of those come from <1% of pixels, then it is considered to be noise-dominated and hence unusable.
| Quadrant | # 1 sec bins | Bins with >0 counts | Bins with >2000 counts | High rate bins dominated by noise | Noise dominated (total time) | Noise dominated (detector-on time) | Marked lightcurve |
|---|---|---|---|---|---|---|---|
| A | 7449 | 6155 | 8 | 8 | 0.11% | 0.13% | 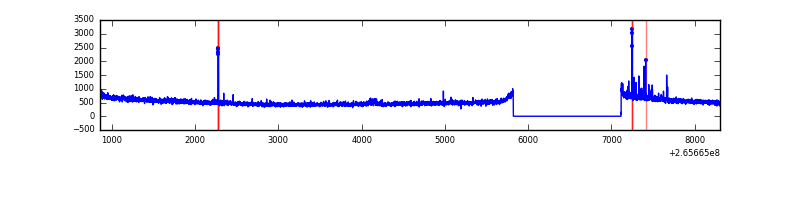 |
| B | 7449 | 6155 | 7 | 7 | 0.09% | 0.11% | 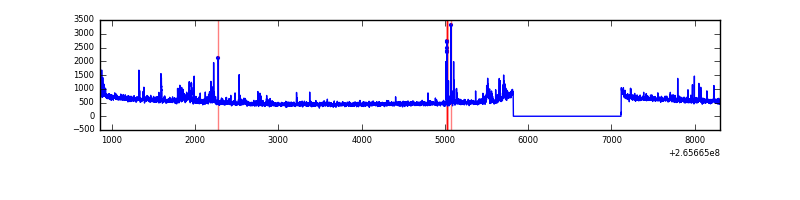 |
| C | 7449 | 6155 | 0 | 0 | 0.00% | 0.00% | 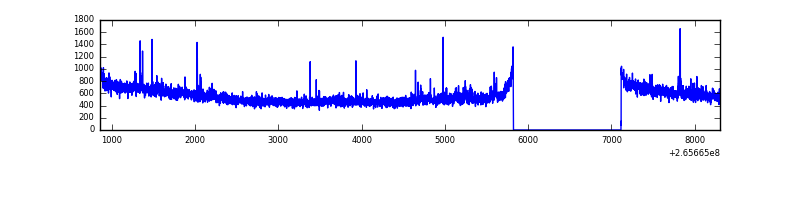 |
| D | 7449 | 6155 | 35 | 35 | 0.47% | 0.57% | 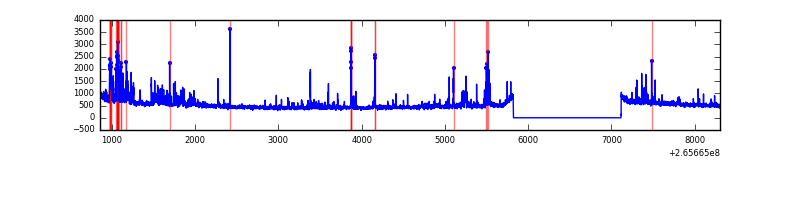 |
Top three noisy pixels from each quadrant. If the there are fewer than three noisy pixels in the level2.evt file, extra rows are filled as -1
| Pixel properties | Quadrant properties | ||||||
|---|---|---|---|---|---|---|---|
| Quadrant | DetID | PixID | Counts | Sigma | Mean | Median | Sigma |
| A | 4 | 2 | 48180 | 292.02 | 806 | 791 | 162.3 |
| A | 8 | 15 | 28266 | 169.31 | 806 | 791 | 162.3 |
| A | 12 | 189 | 15403 | 90.04 | 806 | 791 | 162.3 |
| B | 0 | 189 | 103890 | 678.92 | 811 | 794 | 151.9 |
| B | 0 | 229 | 44178 | 285.7 | 811 | 794 | 151.9 |
| B | 10 | 252 | 39415 | 254.33 | 811 | 794 | 151.9 |
| C | 3 | 233 | 216819 | 1176.88 | 798 | 806 | 183.5 |
| C | 0 | 207 | 98623 | 532.92 | 798 | 806 | 183.5 |
| C | 13 | 61 | 5680 | 26.55 | 798 | 806 | 183.5 |
| D | 2 | 120 | 389401 | 1978.55 | 789 | 770 | 196.4 |
| D | 10 | 199 | 41077 | 205.21 | 789 | 770 | 196.4 |
| D | 2 | 234 | 28163 | 139.46 | 789 | 770 | 196.4 |
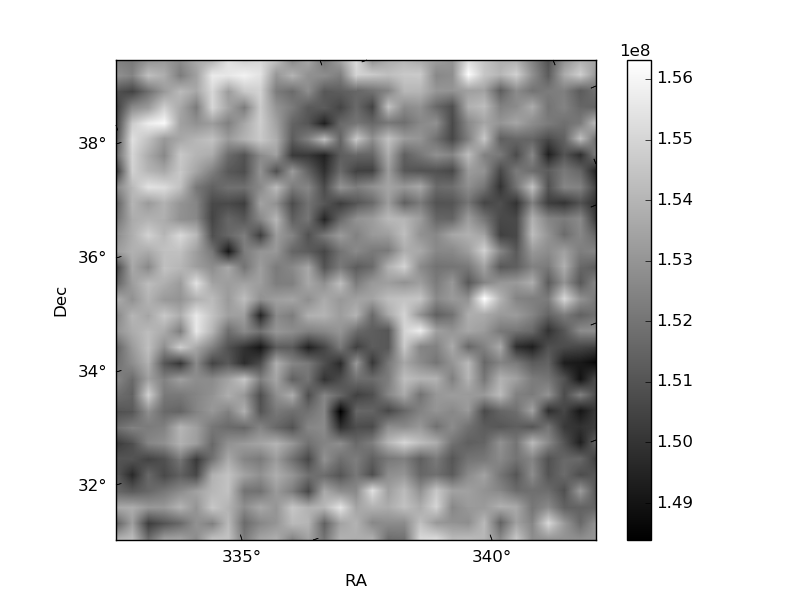
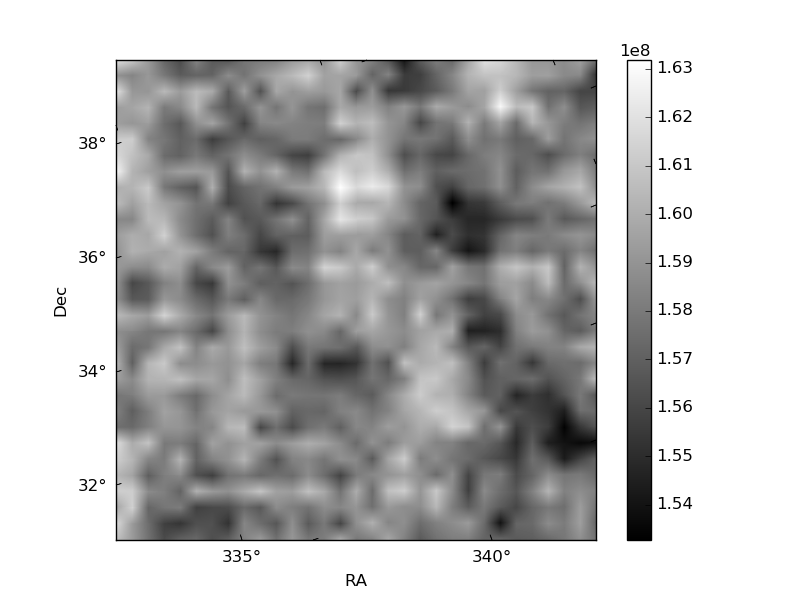
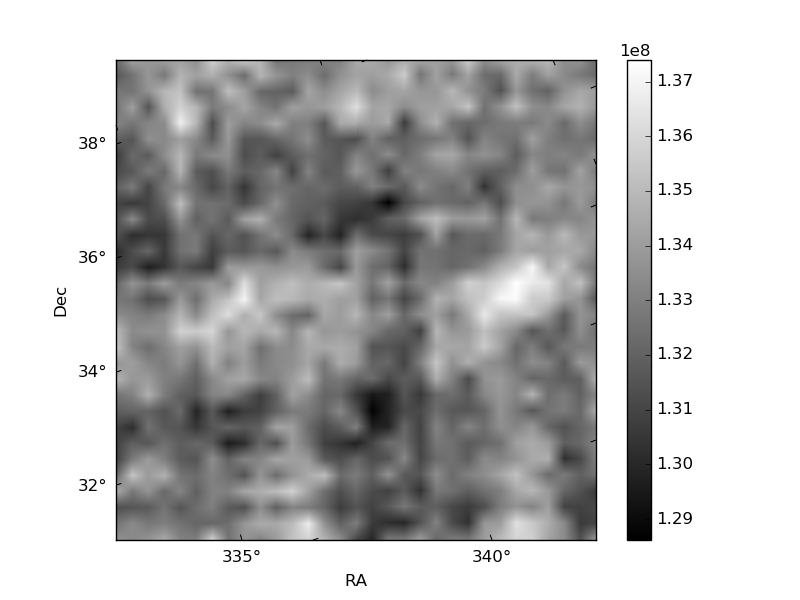
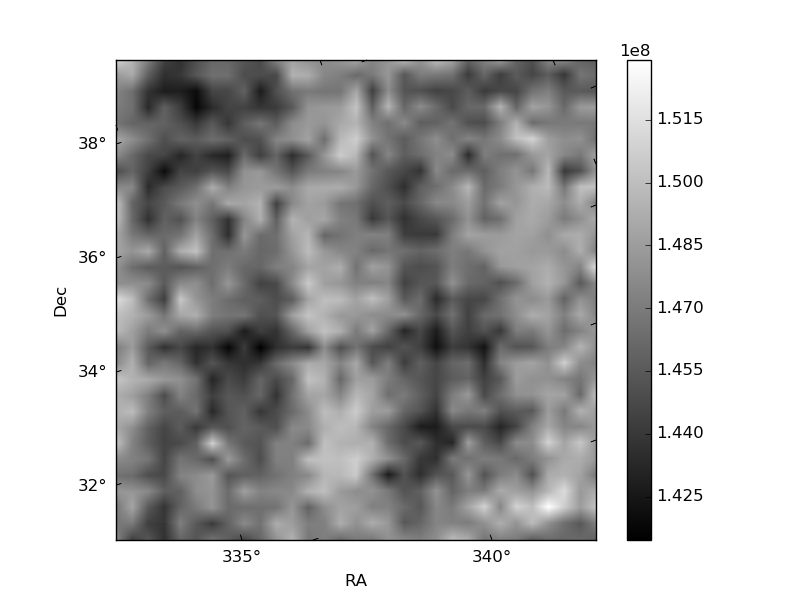
Histogram calculated using DETX and DETY for each event in the final _common_clean file
| Quadrant A | 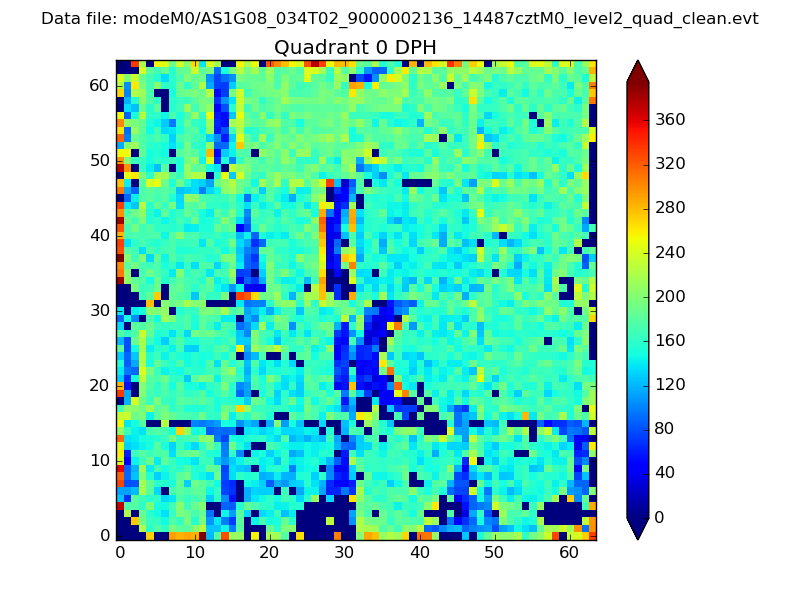 |
 |
Quadrant B |
|---|---|---|---|
| Quadrant D | 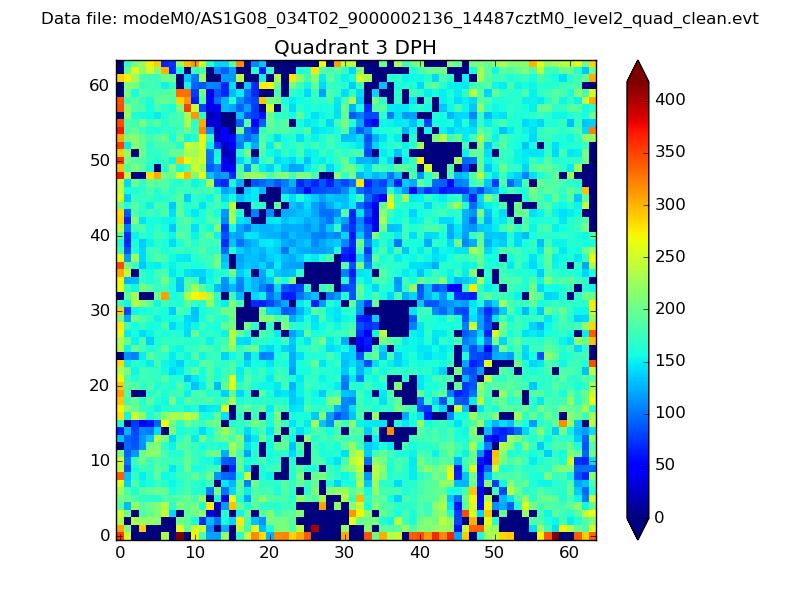 |
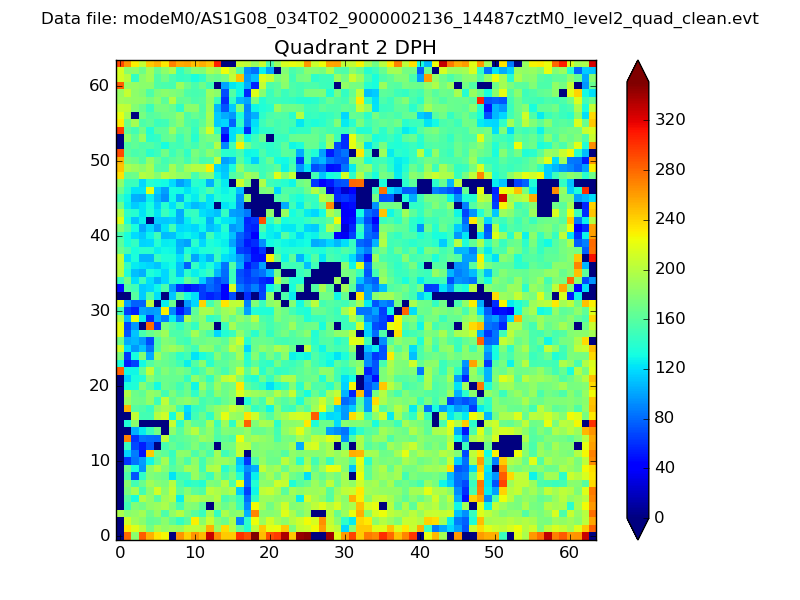 |
Quadrant C |
| Plot type | Count rate plots | Images |
|---|---|---|
| Comparison with Poisson distribution Blue bars denote a histogram of data divided into 1 sec bins. Red curve is a Poisson curve with rate = median count rate of data. |
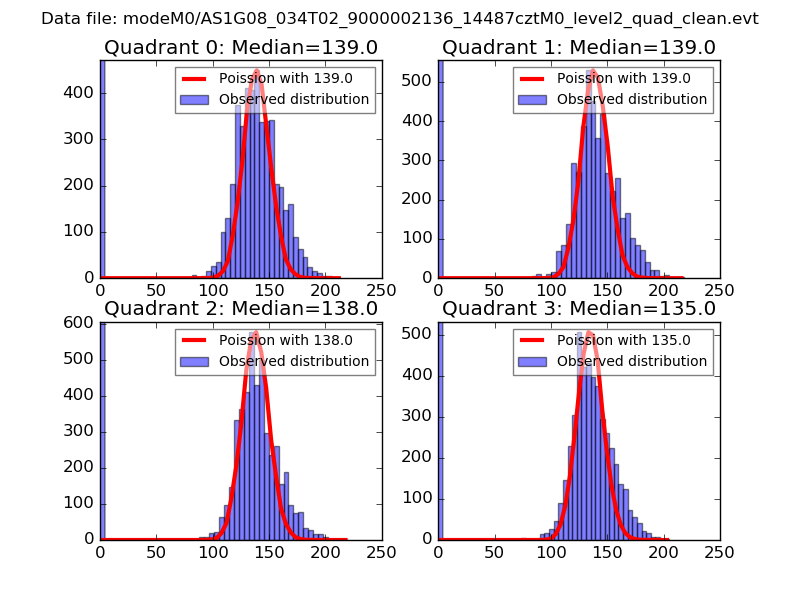 |
 |
| Quadrant-wise count rates Data is divided into 100 sec bins |
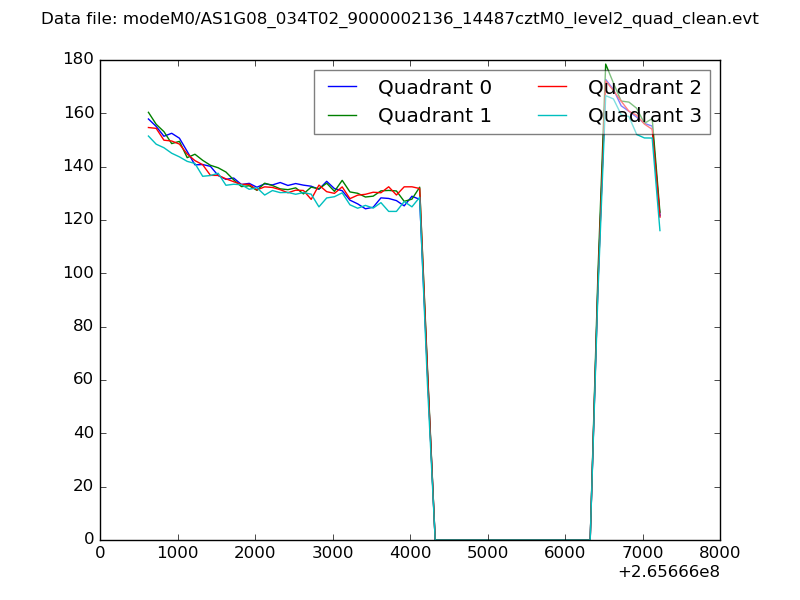 |
|
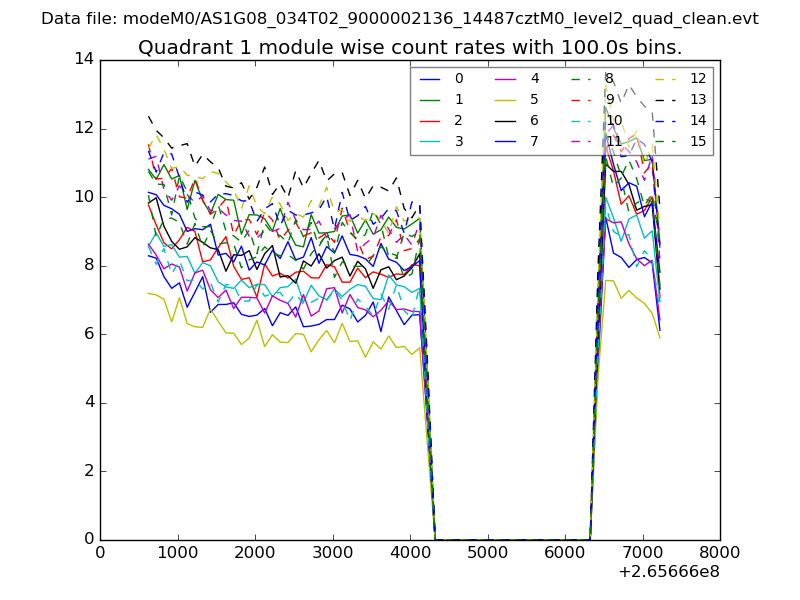
| Module-wise count rates for Quadrant A Data is divided into 100 sec bins |
 |
 |
| Module-wise count rates for Quadrant B Data is divided into 100 sec bins |
 |
 |
| Module-wise count rates for Quadrant C Data is divided into 100 sec bins |
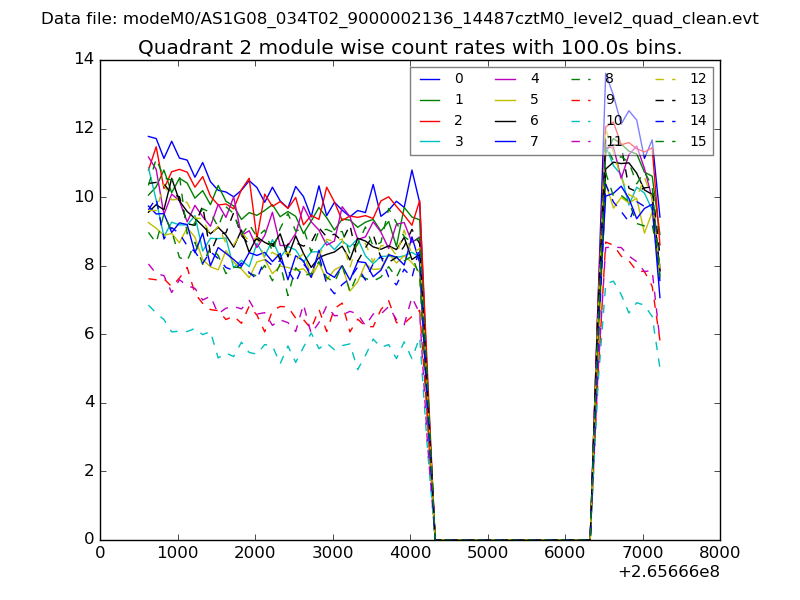 |
 |
| Module-wise count rates for Quadrant D Data is divided into 100 sec bins |
 |
 |
| Parameter | Plot |
|---|---|
| CZT HV Monitor |  |
| D_VDD | 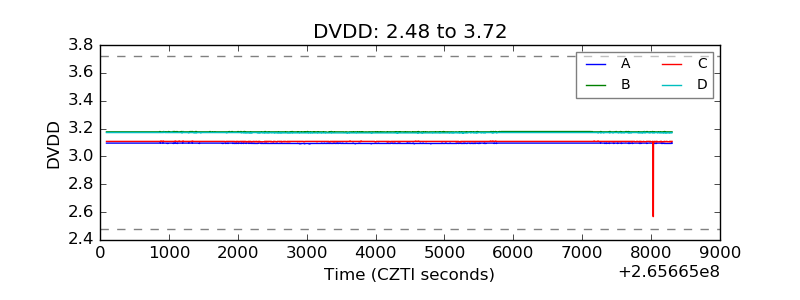 |
| Temperature 1 | 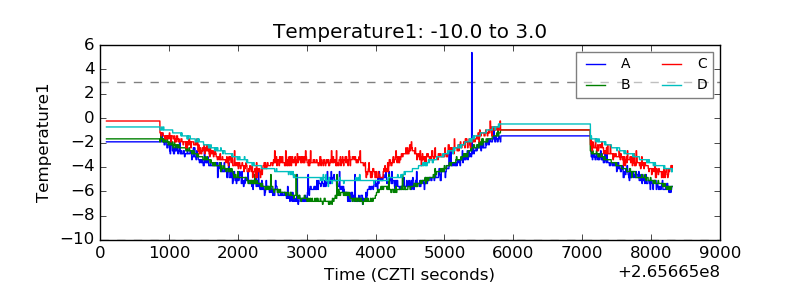 |
| Veto HV Monitor | 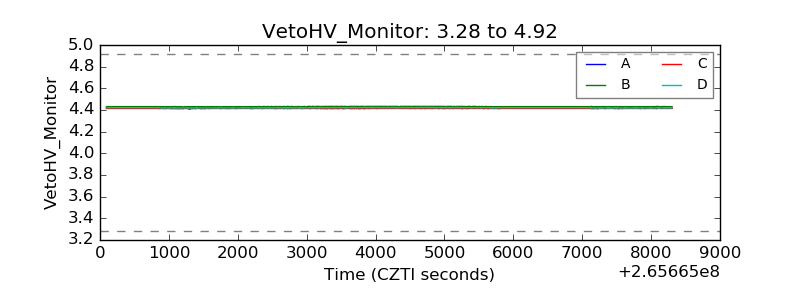 |
| Veto LLD | 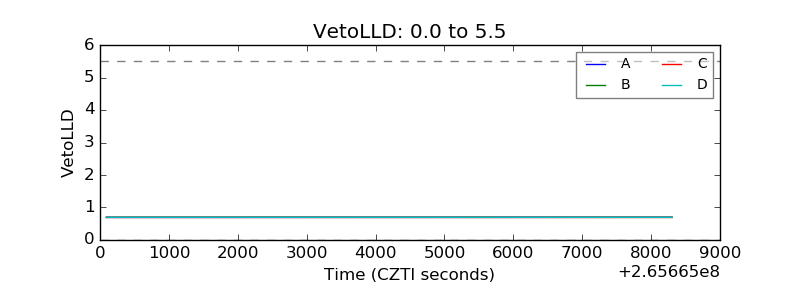 |
| Alpha Counter |  |
| _CPM_Rate | 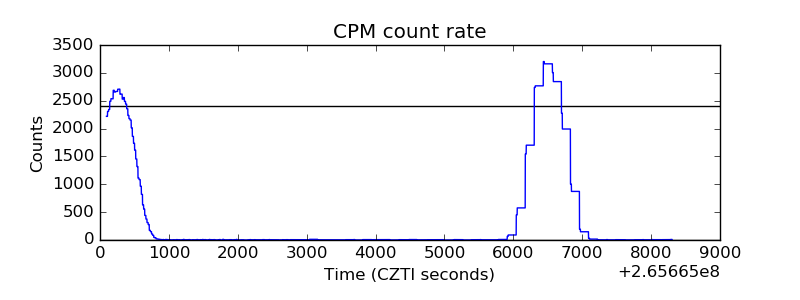 |
| CZT Counter | 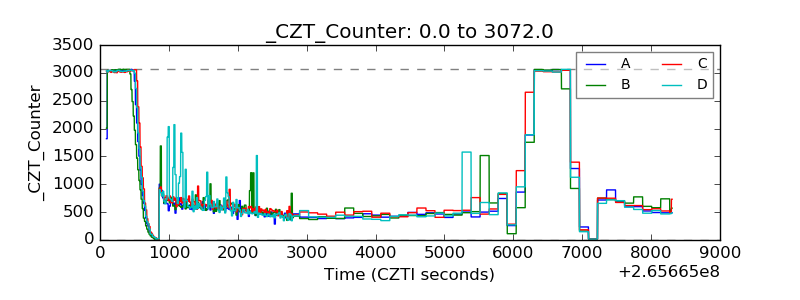 |
| +2.5 Volts monitor |  |
| +5 Volts monitor |  |
| _ROLL_ROT |  |
| _Roll_DEC | 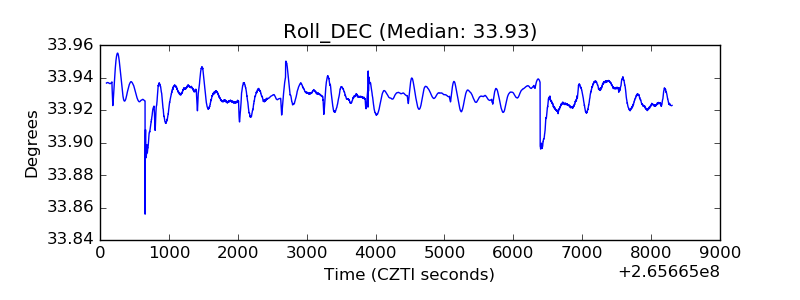 |
| _Roll_RA | 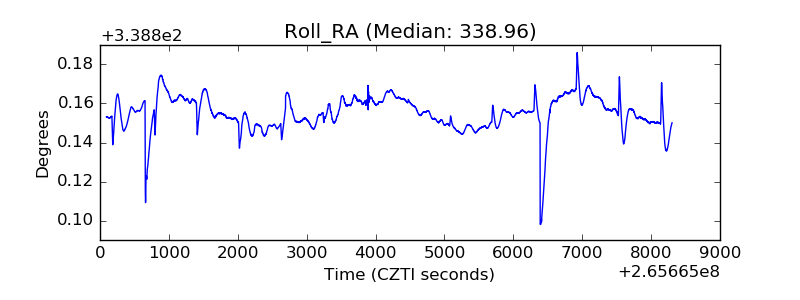 |
| Veto Counter | 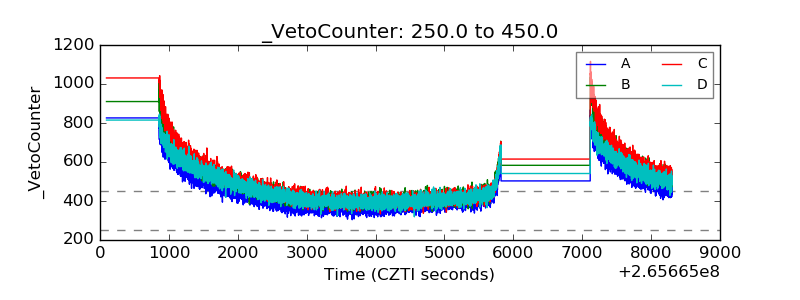 |