| Param | Original file | Final file |
|---|---|---|
| Filename | modeM0/AS1G08_034T02_9000002136_14488cztM0_level2.evt | modeM0/AS1G08_034T02_9000002136_14488cztM0_level2_quad_clean.evt |
| Size (bytes) | 458,153,280 | 110,502,720 |
| Size | 436.9 MB | 105.4 MB |
| Events in quadrant A | 3,292,642 | 728,737 |
| Events in quadrant B | 3,507,262 | 741,873 |
| Events in quadrant C | 3,317,521 | 734,018 |
| Events in quadrant D | 3,336,704 | 709,432 |
| Mode M0 | |||
|---|---|---|---|
| Quadrant | BADHDUFLAG | Total packets | Discarded packets |
| A | 0 | 13687 | 4 |
| B | 0 | 14584 | 3 |
| C | 0 | 13844 | 3 |
| D | 0 | 14057 | 3 |
| Mode SS | |||
|---|---|---|---|
| Quadrant | BADHDUFLAG | Total packets | Discarded packets |
| A | 0 | 126 | 0 |
| B | 0 | 126 | 0 |
| C | 0 | 126 | 0 |
| D | 0 | 126 | 0 |
| Mode M9 | |||
|---|---|---|---|
| Quadrant | BADHDUFLAG | Total packets | Discarded packets |
| A | 0 | 21 | 0 |
| B | 0 | 21 | 0 |
| C | 0 | 21 | 0 |
| D | 0 | 22 | 0 |
| Quadrant | Total seconds | Saturated seconds | Saturation percentage |
|---|---|---|---|
| A | 6200 | 50 | 0.806452% |
| B | 6200 | 80 | 1.290323% |
| C | 6200 | 45 | 0.725806% |
| D | 6200 | 56 | 0.903226% |
Noise dominated data is calculated using 1-second bins in cleaned event files. If a bin has >2000 counts, and if more than 50% of those come from <1% of pixels, then it is considered to be noise-dominated and hence unusable.
| Quadrant | # 1 sec bins | Bins with >0 counts | Bins with >2000 counts | High rate bins dominated by noise | Noise dominated (total time) | Noise dominated (detector-on time) | Marked lightcurve |
|---|---|---|---|---|---|---|---|
| A | 7556 | 6202 | 4 | 4 | 0.05% | 0.06% | 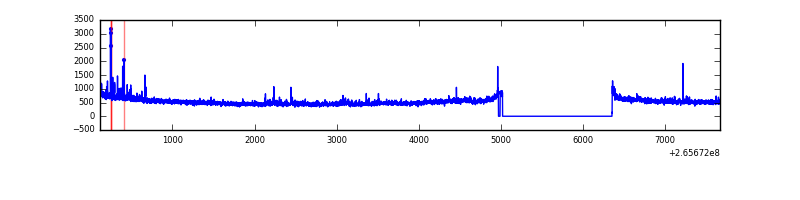 |
| B | 7556 | 6202 | 22 | 22 | 0.29% | 0.35% |  |
| C | 7556 | 6202 | 0 | 0 | 0.00% | 0.00% | 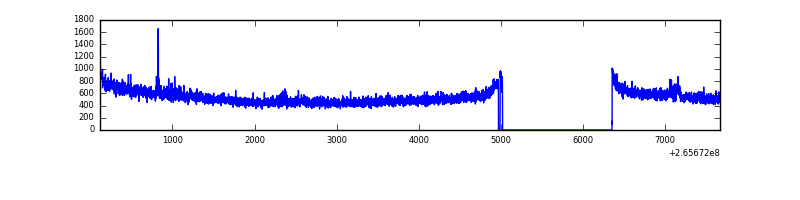 |
| D | 7556 | 6203 | 18 | 18 | 0.24% | 0.29% | 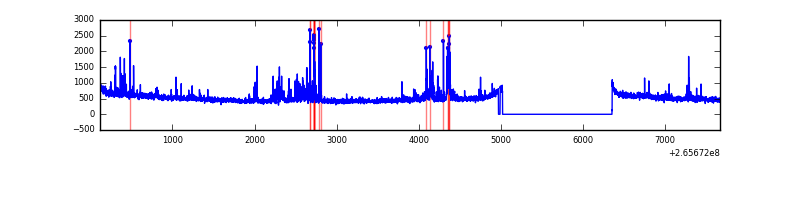 |
Top three noisy pixels from each quadrant. If the there are fewer than three noisy pixels in the level2.evt file, extra rows are filled as -1
| Pixel properties | Quadrant properties | ||||||
|---|---|---|---|---|---|---|---|
| Quadrant | DetID | PixID | Counts | Sigma | Mean | Median | Sigma |
| A | 12 | 189 | 65658 | 401.21 | 810 | 797 | 161.7 |
| A | 4 | 2 | 48233 | 293.43 | 810 | 797 | 161.7 |
| A | 11 | 29 | 37572 | 227.48 | 810 | 797 | 161.7 |
| B | 15 | 222 | 103016 | 675.94 | 817 | 798 | 151.2 |
| B | 0 | 189 | 71594 | 468.15 | 817 | 798 | 151.2 |
| B | 10 | 247 | 28310 | 181.93 | 817 | 798 | 151.2 |
| C | 3 | 233 | 131188 | 707.56 | 802 | 809 | 184.3 |
| C | 0 | 207 | 58538 | 313.29 | 802 | 809 | 184.3 |
| C | 13 | 61 | 5701 | 26.55 | 802 | 809 | 184.3 |
| D | 2 | 120 | 143975 | 718.97 | 792 | 774 | 199.2 |
| D | 10 | 199 | 108795 | 542.34 | 792 | 774 | 199.2 |
| D | 2 | 234 | 25613 | 124.71 | 792 | 774 | 199.2 |
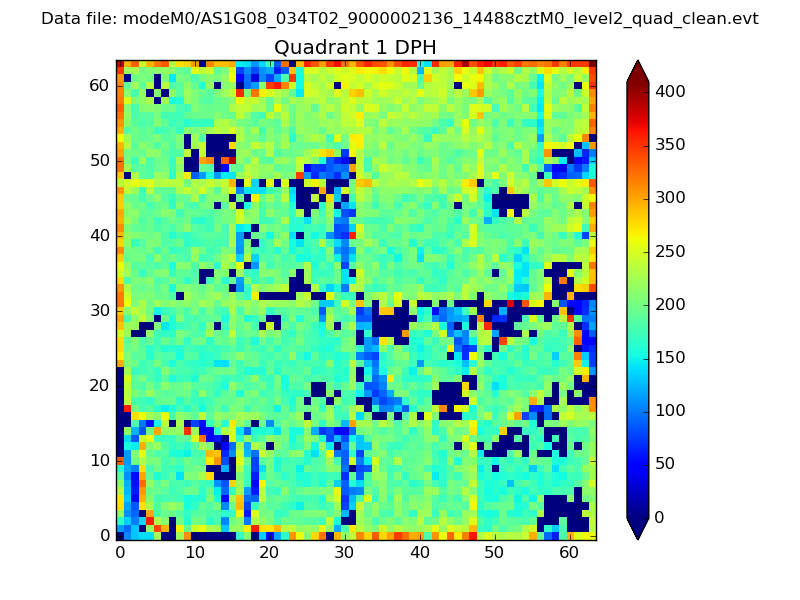
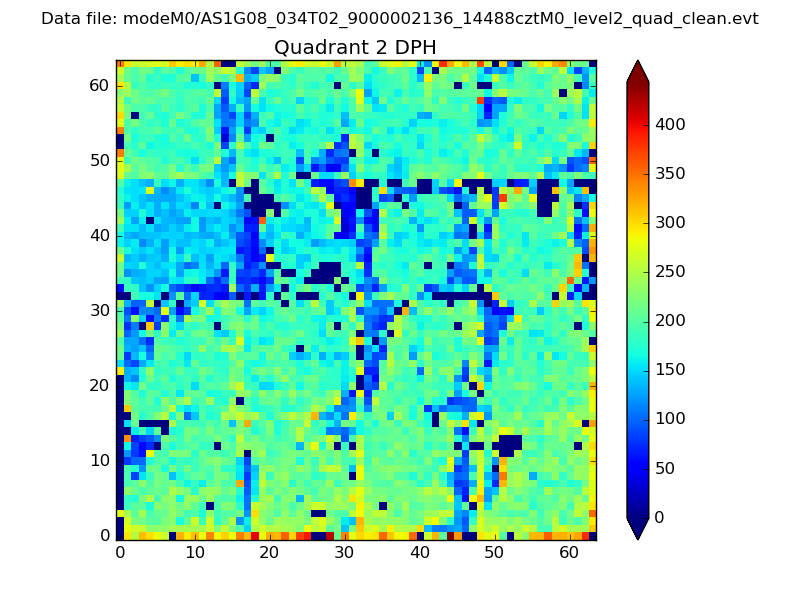
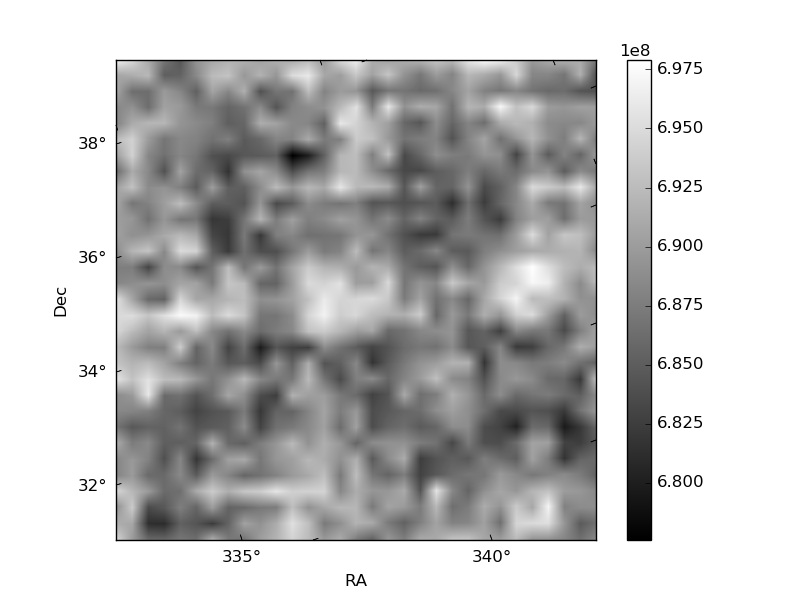
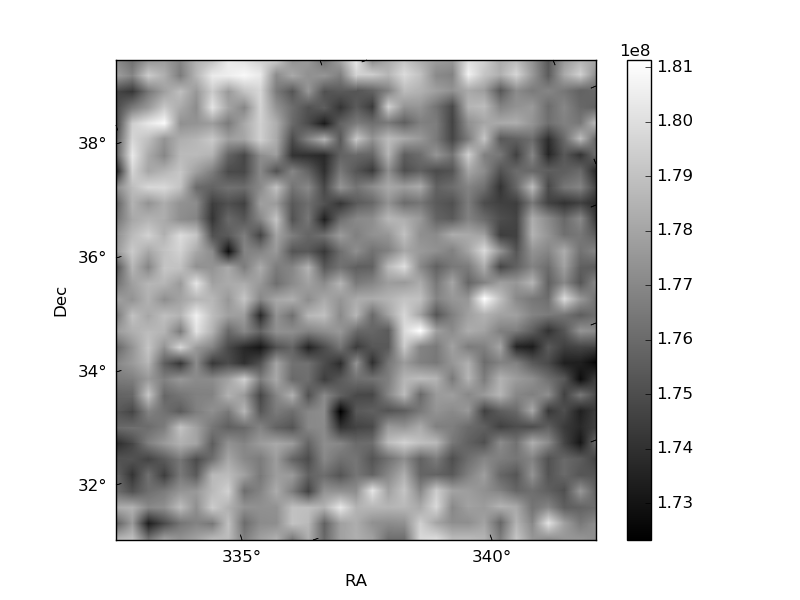
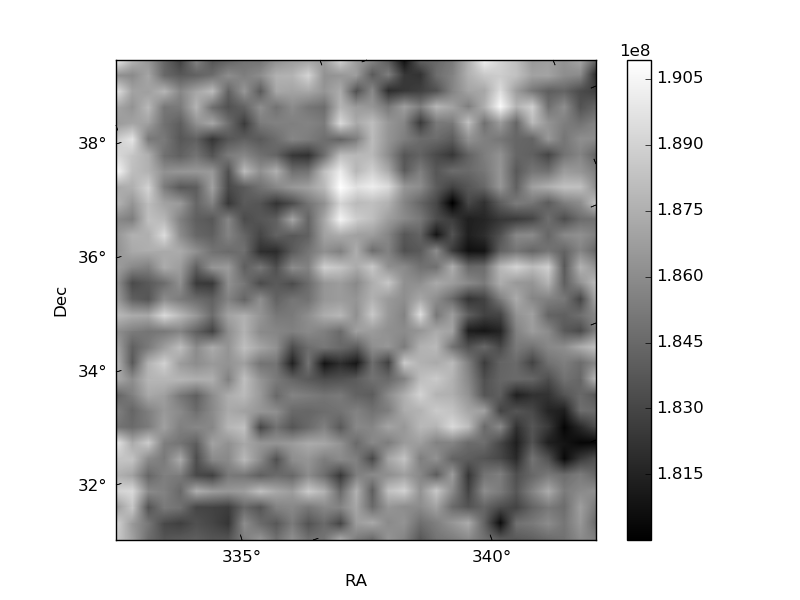
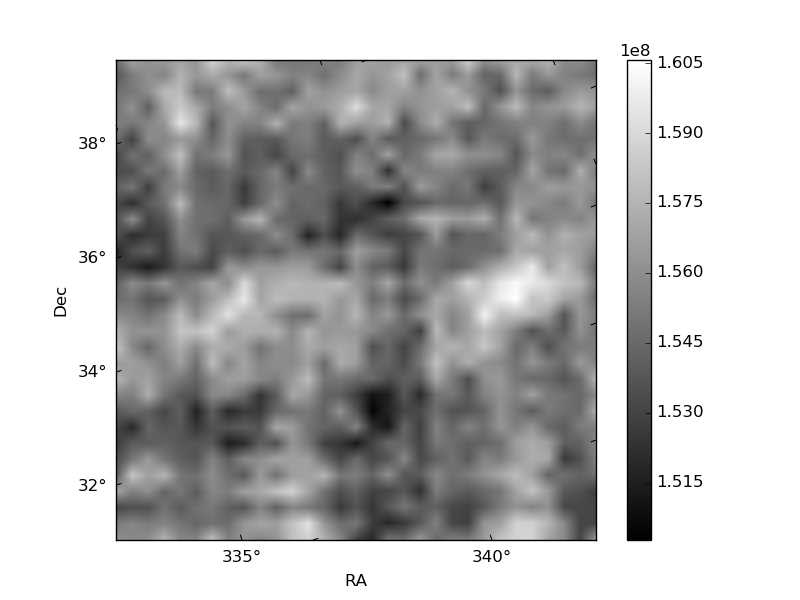
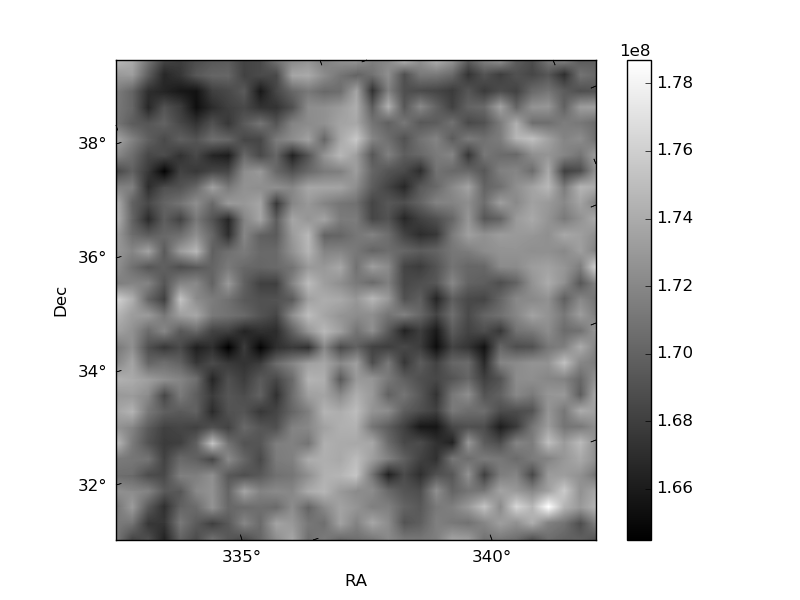
Histogram calculated using DETX and DETY for each event in the final _common_clean file
| Quadrant A | 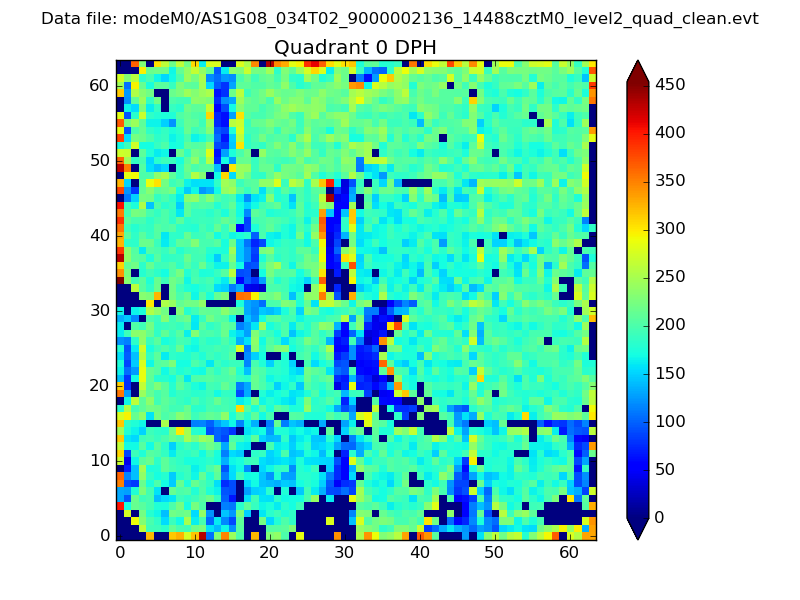 |
 |
Quadrant B |
|---|---|---|---|
| Quadrant D | 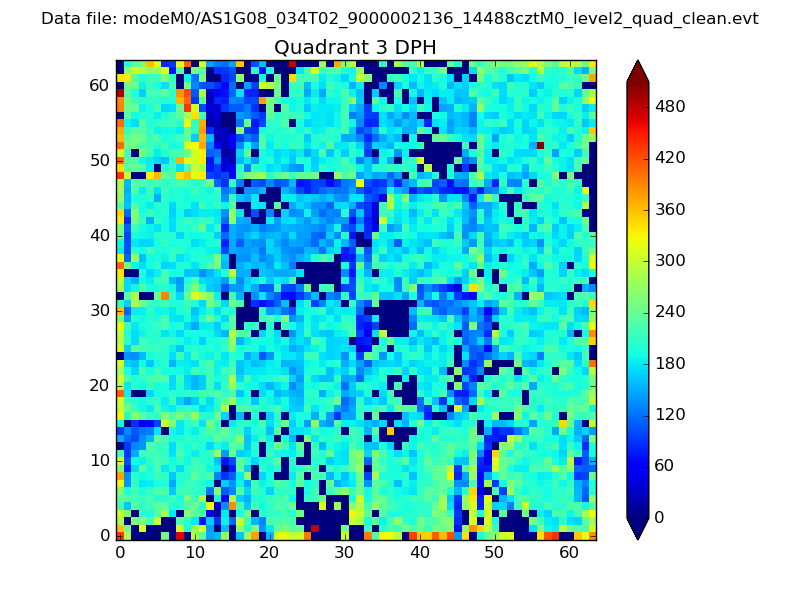 |
 |
Quadrant C |
| Plot type | Count rate plots | Images |
|---|---|---|
| Comparison with Poisson distribution Blue bars denote a histogram of data divided into 1 sec bins. Red curve is a Poisson curve with rate = median count rate of data. |
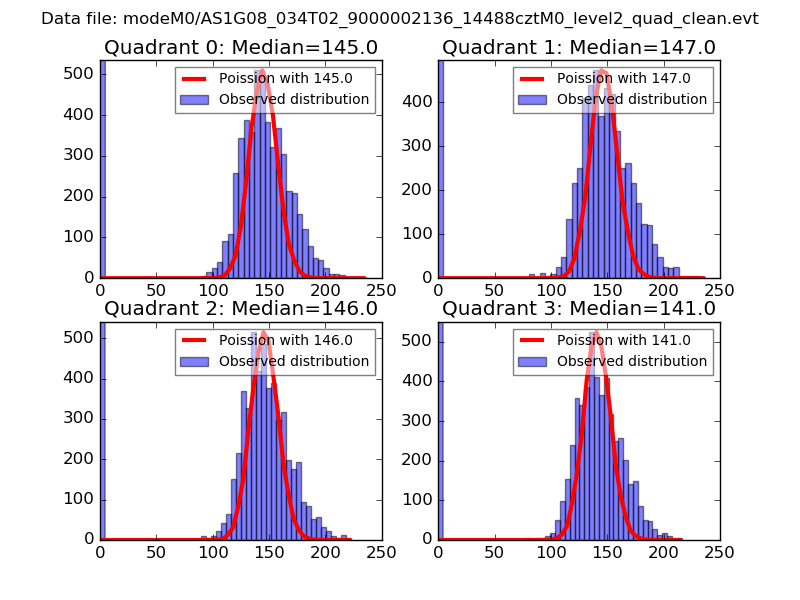 |
 |
| Quadrant-wise count rates Data is divided into 100 sec bins |
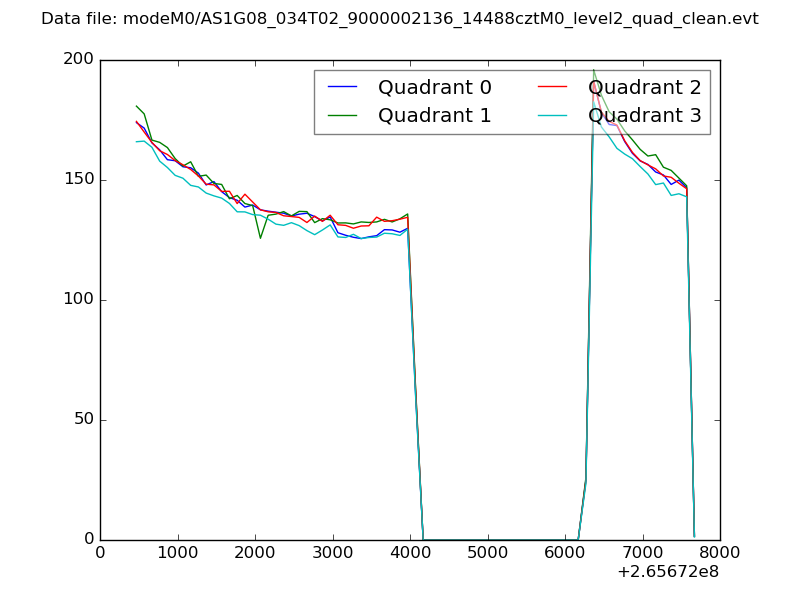 |
|
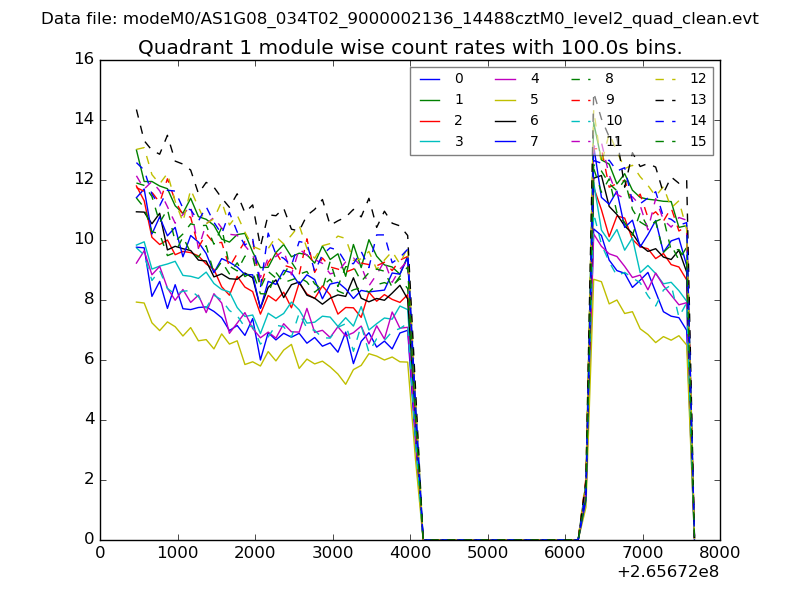
| Module-wise count rates for Quadrant A Data is divided into 100 sec bins |
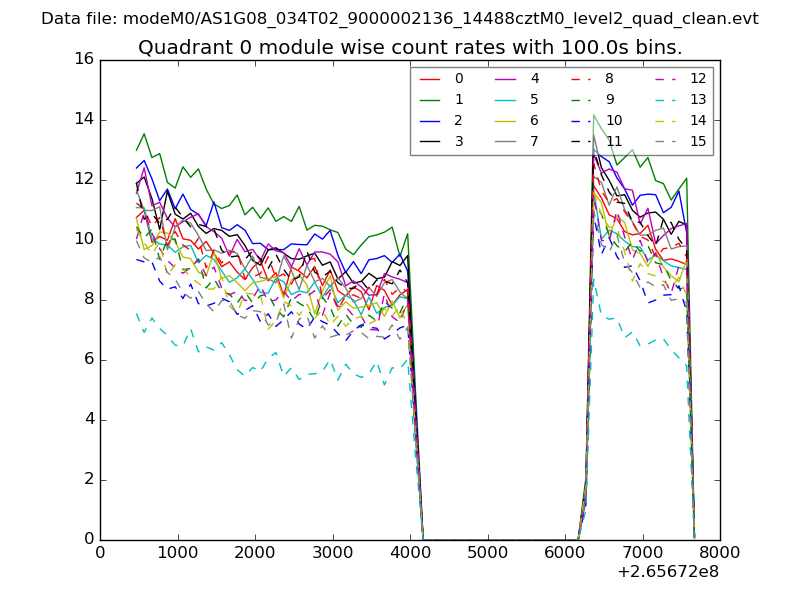 |
 |
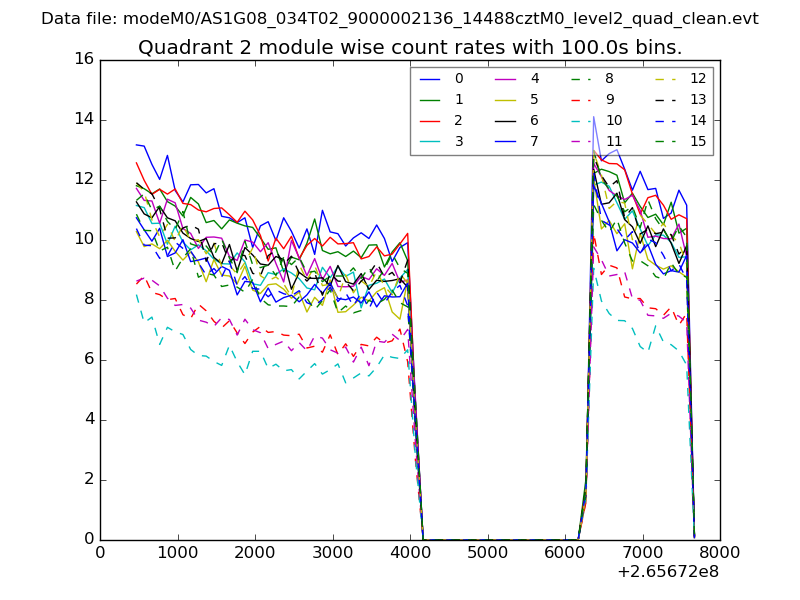
| Module-wise count rates for Quadrant B Data is divided into 100 sec bins |
 |
 |
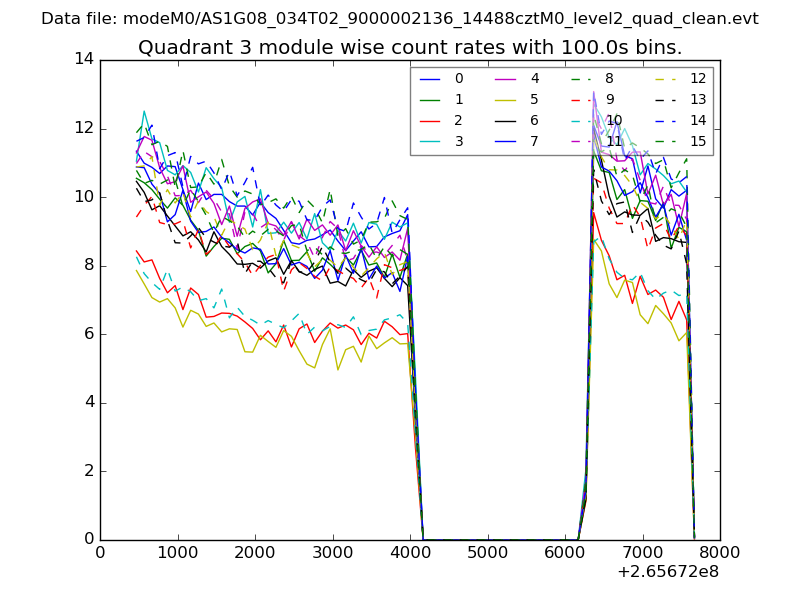
| Module-wise count rates for Quadrant C Data is divided into 100 sec bins |
 |
 |
| Module-wise count rates for Quadrant D Data is divided into 100 sec bins |
 |
 |
| Parameter | Plot |
|---|---|
| CZT HV Monitor |  |
| D_VDD | 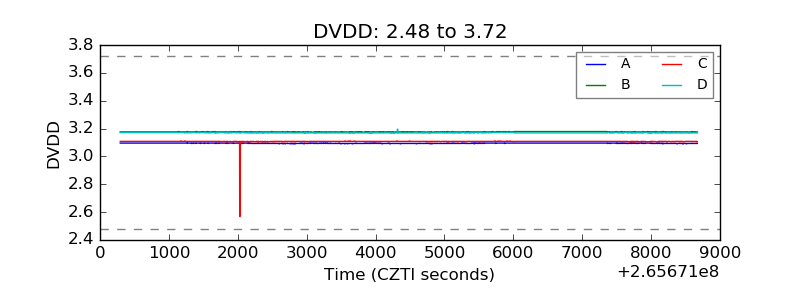 |
| Temperature 1 | 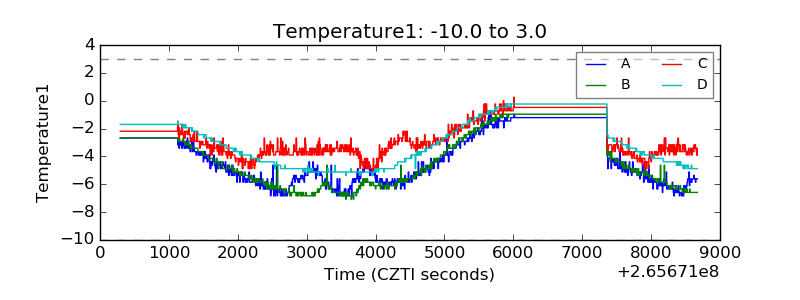 |
| Veto HV Monitor | 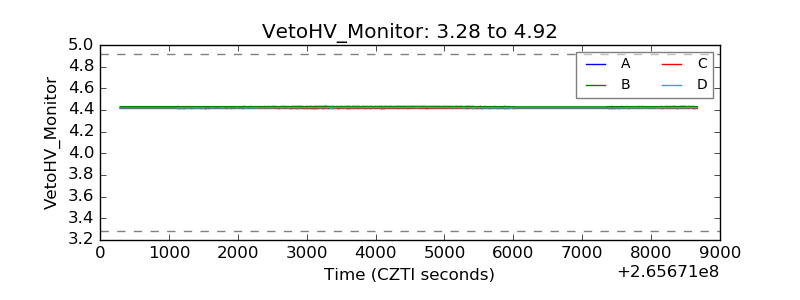 |
| Veto LLD | 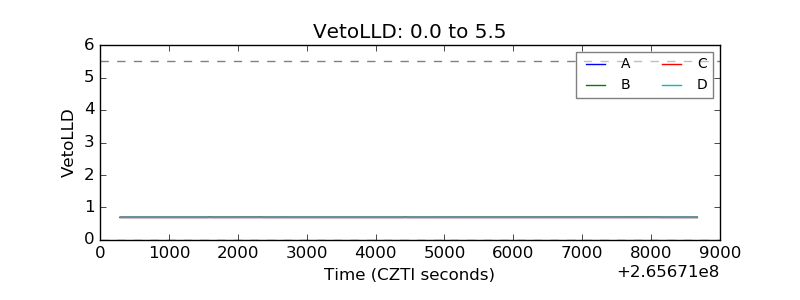 |
| Alpha Counter | 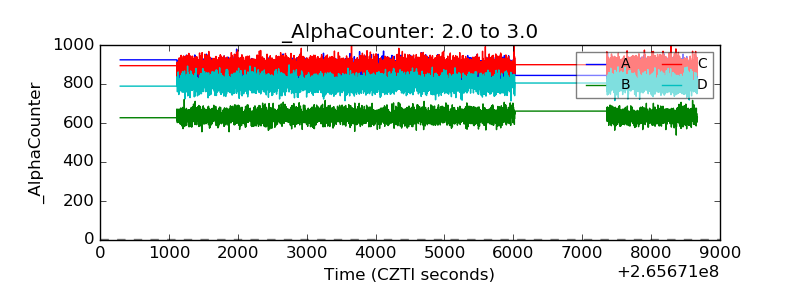 |
| _CPM_Rate | 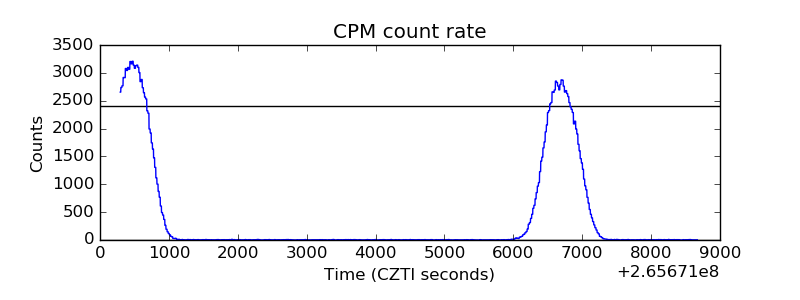 |
| CZT Counter | 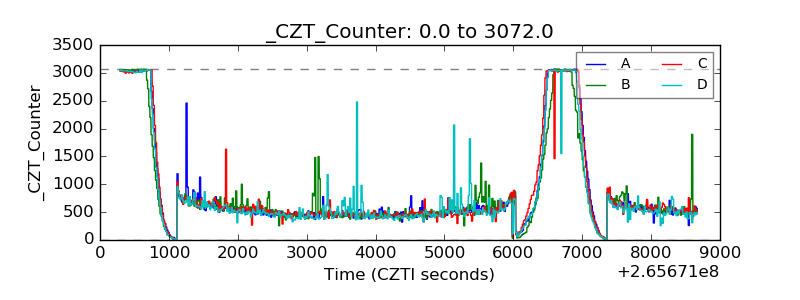 |
| +2.5 Volts monitor | 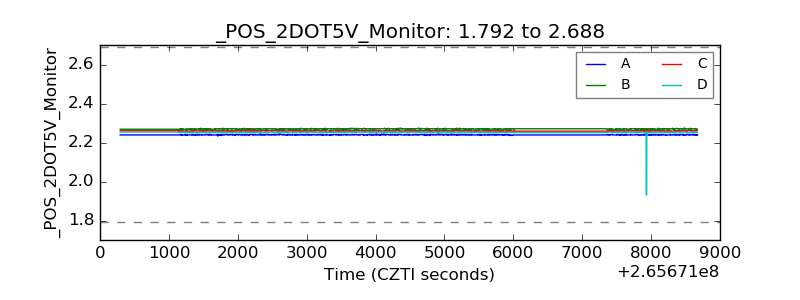 |
| +5 Volts monitor | 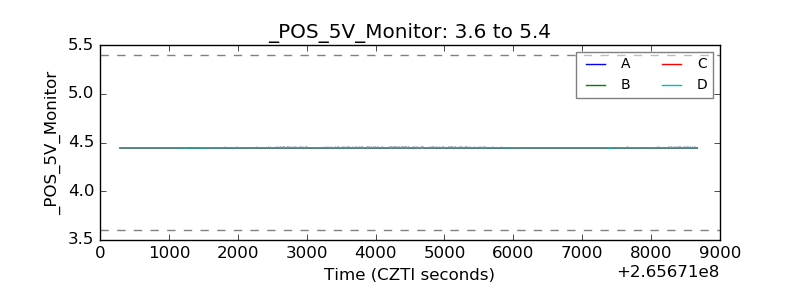 |
| _ROLL_ROT | 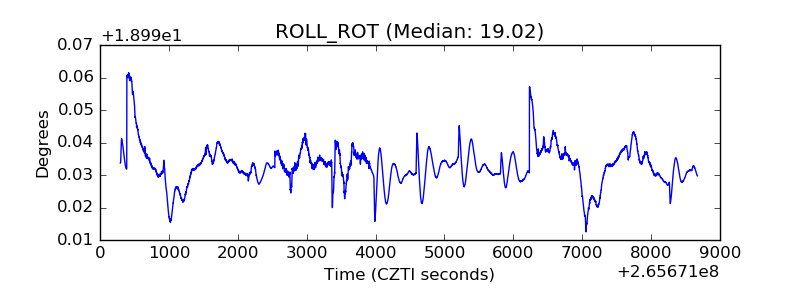 |
| _Roll_DEC | 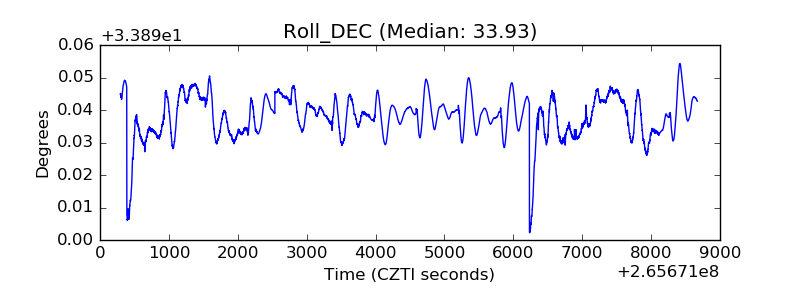 |
| _Roll_RA | 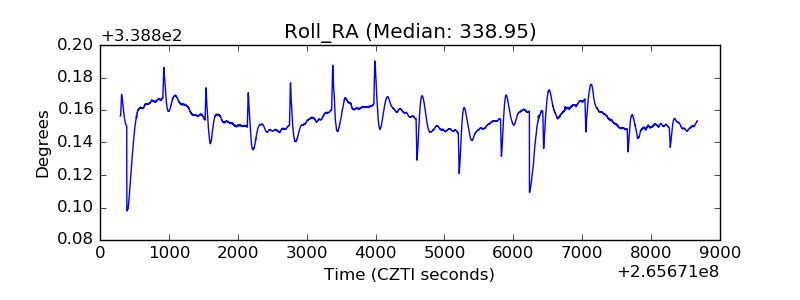 |
| Veto Counter | 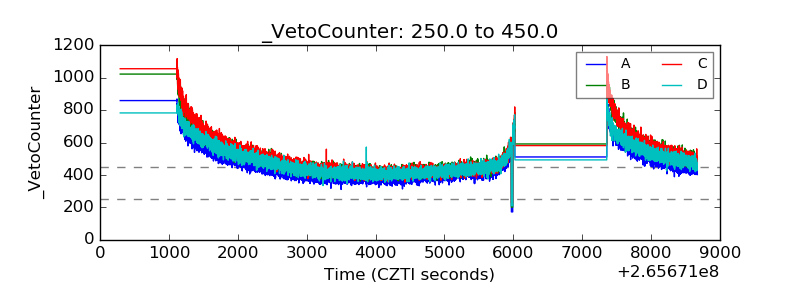 |