| Param | Original file | Final file |
|---|---|---|
| Filename | modeM0/AS1G08_034T02_9000002136_14489cztM0_level2.evt | modeM0/AS1G08_034T02_9000002136_14489cztM0_level2_quad_clean.evt |
| Size (bytes) | 443,989,440 | 106,873,920 |
| Size | 423.4 MB | 101.9 MB |
| Events in quadrant A | 3,145,275 | 705,898 |
| Events in quadrant B | 3,378,345 | 719,519 |
| Events in quadrant C | 3,122,196 | 706,015 |
| Events in quadrant D | 3,385,413 | 679,026 |
| Mode M0 | |||
|---|---|---|---|
| Quadrant | BADHDUFLAG | Total packets | Discarded packets |
| A | 0 | 13141 | 3 |
| B | 0 | 14040 | 2 |
| C | 0 | 13224 | 2 |
| D | 0 | 14105 | 2 |
| Mode SS | |||
|---|---|---|---|
| Quadrant | BADHDUFLAG | Total packets | Discarded packets |
| A | 0 | 124 | 0 |
| B | 0 | 124 | 0 |
| C | 0 | 124 | 0 |
| D | 0 | 124 | 0 |
| Mode M9 | |||
|---|---|---|---|
| Quadrant | BADHDUFLAG | Total packets | Discarded packets |
| A | 0 | 16 | 0 |
| B | 0 | 16 | 0 |
| C | 0 | 16 | 0 |
| D | 0 | 17 | 0 |
| Quadrant | Total seconds | Saturated seconds | Saturation percentage |
|---|---|---|---|
| A | 6108 | 34 | 0.556647% |
| B | 6108 | 65 | 1.064178% |
| C | 6108 | 22 | 0.360183% |
| D | 6108 | 132 | 2.161100% |
Noise dominated data is calculated using 1-second bins in cleaned event files. If a bin has >2000 counts, and if more than 50% of those come from <1% of pixels, then it is considered to be noise-dominated and hence unusable.
| Quadrant | # 1 sec bins | Bins with >0 counts | Bins with >2000 counts | High rate bins dominated by noise | Noise dominated (total time) | Noise dominated (detector-on time) | Marked lightcurve |
|---|---|---|---|---|---|---|---|
| A | 7474 | 6110 | 0 | 0 | 0.00% | 0.00% | 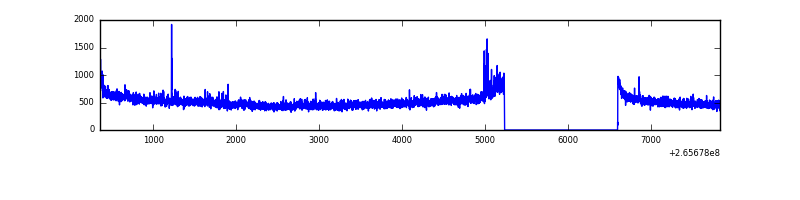 |
| B | 7474 | 6110 | 10 | 10 | 0.13% | 0.16% | 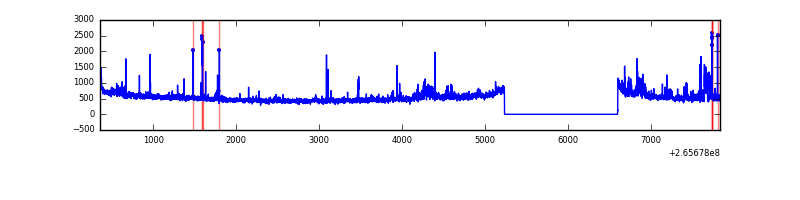 |
| C | 7474 | 6110 | 0 | 0 | 0.00% | 0.00% | 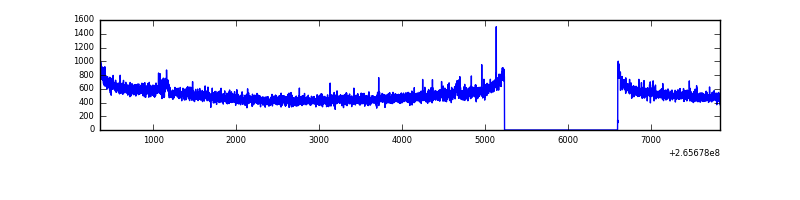 |
| D | 7474 | 6110 | 100 | 100 | 1.34% | 1.64% | 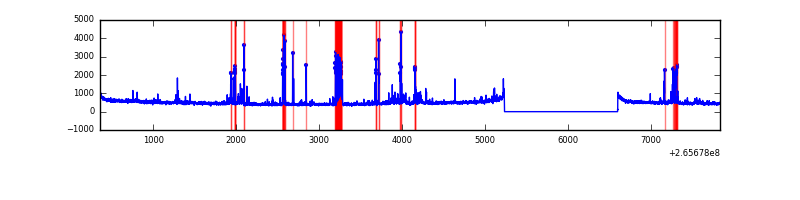 |
Top three noisy pixels from each quadrant. If the there are fewer than three noisy pixels in the level2.evt file, extra rows are filled as -1
| Pixel properties | Quadrant properties | ||||||
|---|---|---|---|---|---|---|---|
| Quadrant | DetID | PixID | Counts | Sigma | Mean | Median | Sigma |
| A | 12 | 189 | 57686 | 363.82 | 781 | 767 | 156.4 |
| A | 11 | 29 | 44350 | 278.57 | 781 | 767 | 156.4 |
| A | 4 | 2 | 22476 | 138.76 | 781 | 767 | 156.4 |
| B | 0 | 189 | 77883 | 521.42 | 789 | 771 | 147.9 |
| B | 10 | 245 | 69710 | 466.16 | 789 | 771 | 147.9 |
| B | 0 | 182 | 35386 | 234.06 | 789 | 771 | 147.9 |
| C | 3 | 233 | 83943 | 471.46 | 768 | 772 | 176.4 |
| C | 0 | 207 | 41851 | 232.86 | 768 | 772 | 176.4 |
| C | 13 | 61 | 5428 | 26.39 | 768 | 772 | 176.4 |
| D | 10 | 199 | 339656 | 1879.99 | 755 | 739 | 180.3 |
| D | 10 | 70 | 102324 | 563.5 | 755 | 739 | 180.3 |
| D | 2 | 120 | 32767 | 177.66 | 755 | 739 | 180.3 |
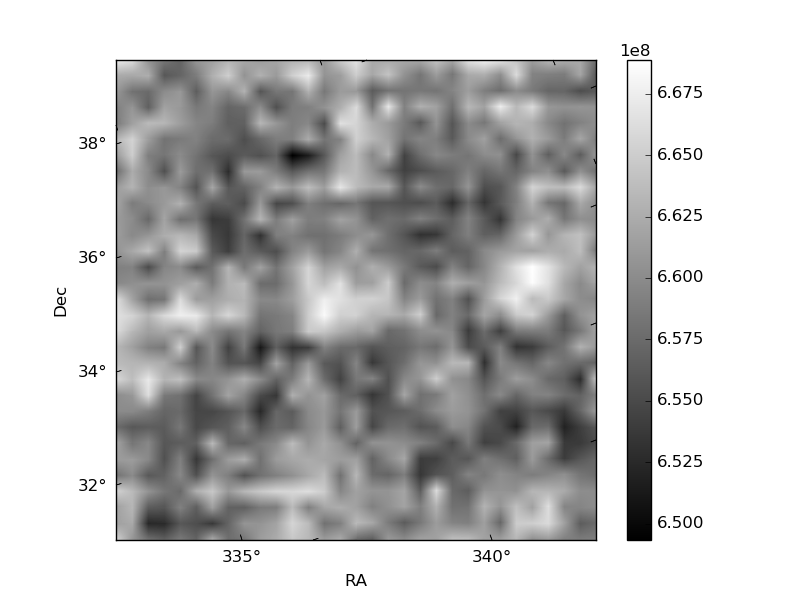
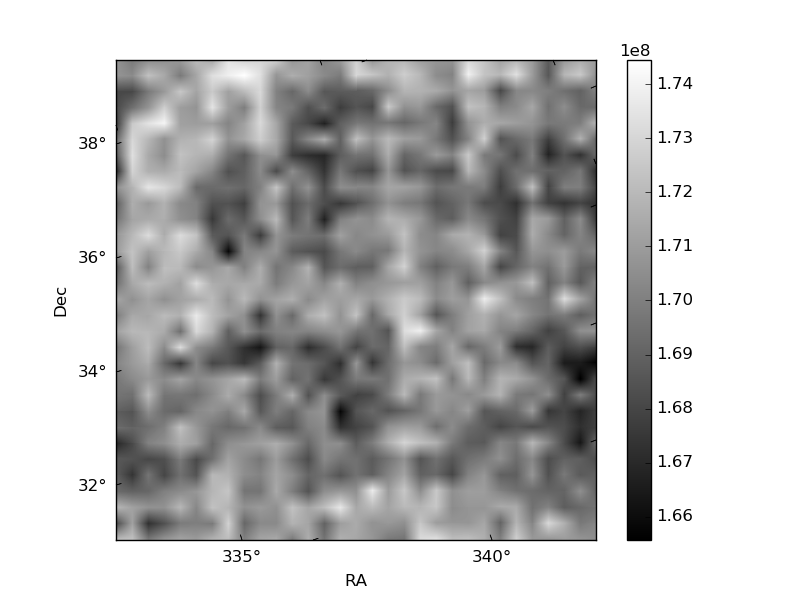
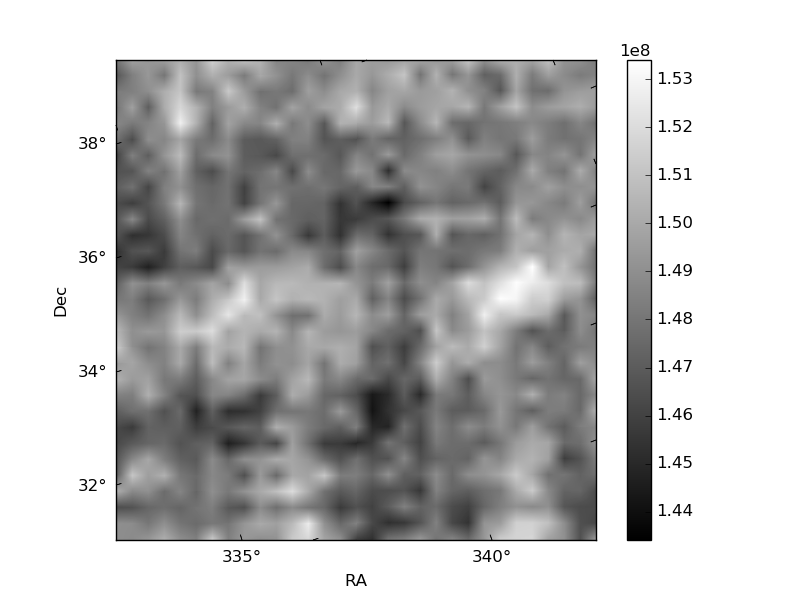
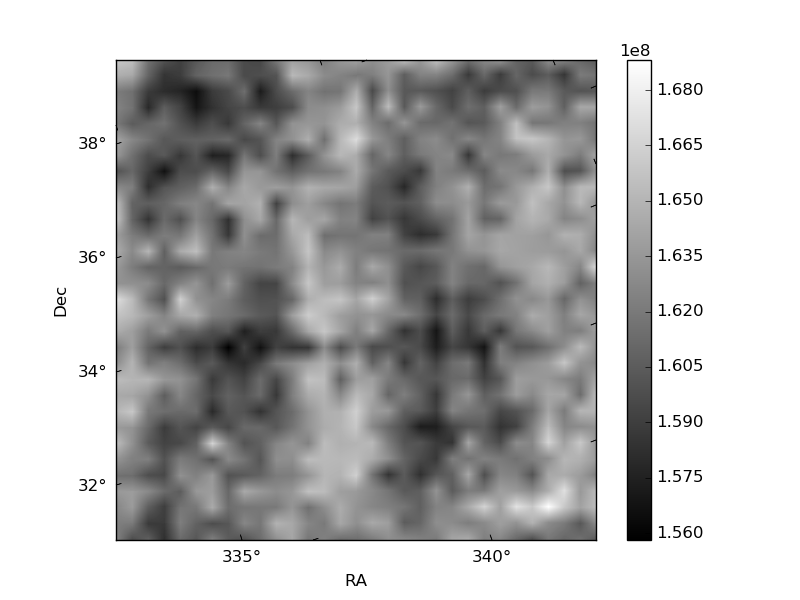
Histogram calculated using DETX and DETY for each event in the final _common_clean file
| Quadrant A | 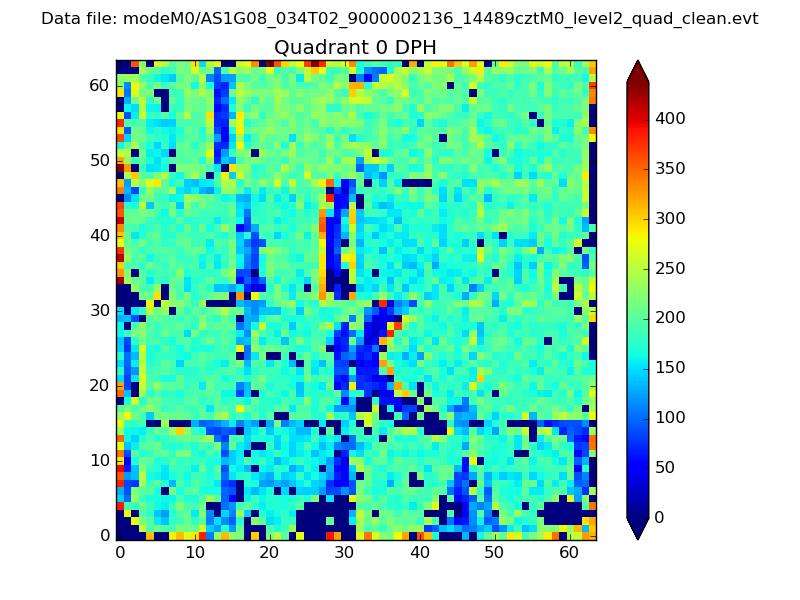 |
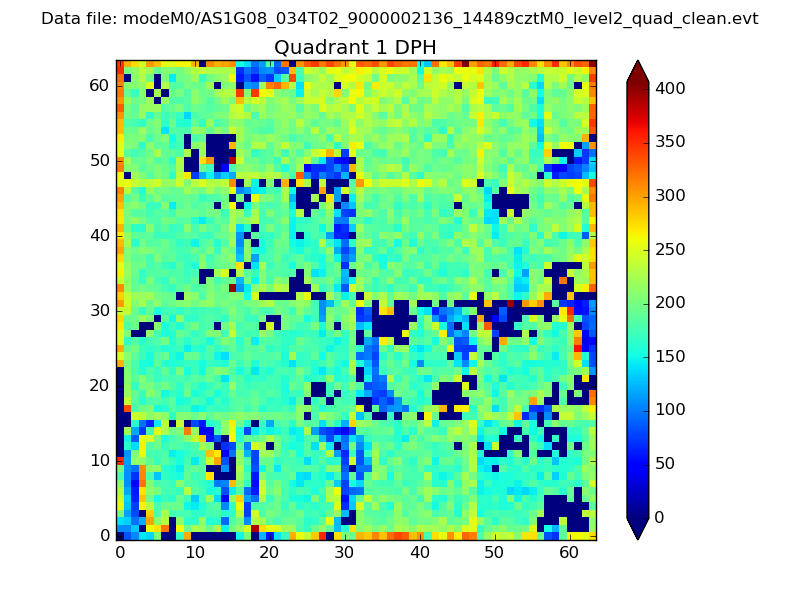 |
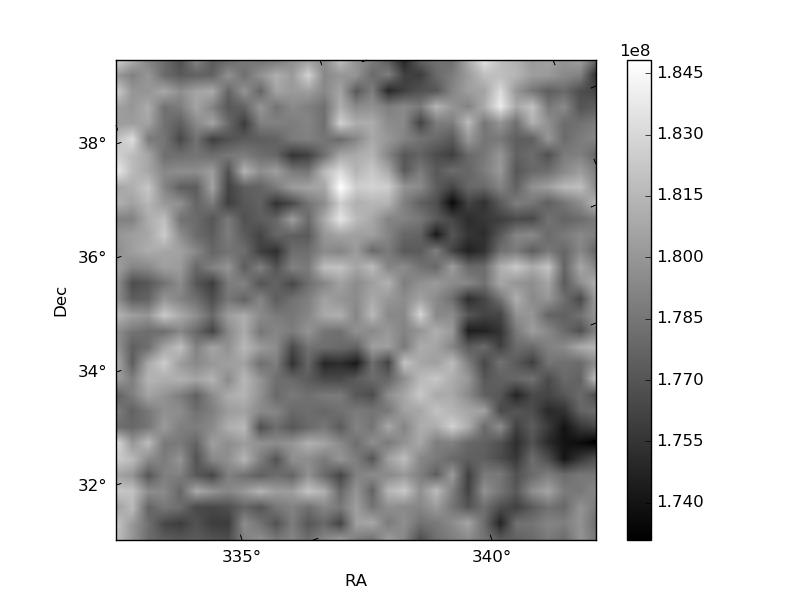
Quadrant B |
|---|---|---|---|
| Quadrant D | 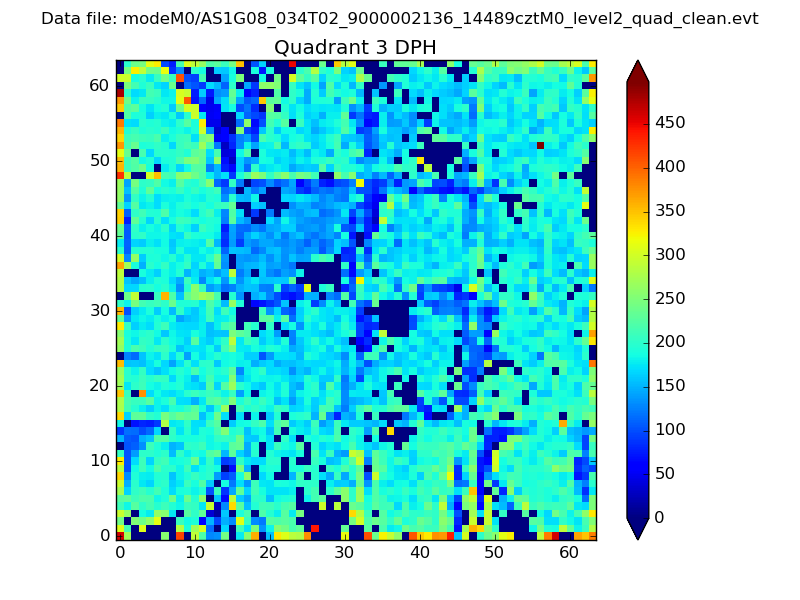 |
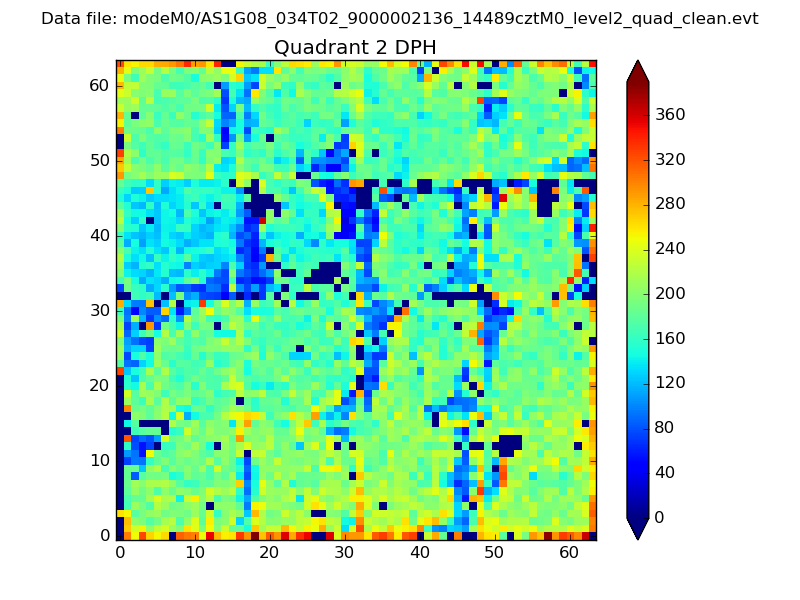 |
Quadrant C |
| Plot type | Count rate plots | Images |
|---|---|---|
| Comparison with Poisson distribution Blue bars denote a histogram of data divided into 1 sec bins. Red curve is a Poisson curve with rate = median count rate of data. |
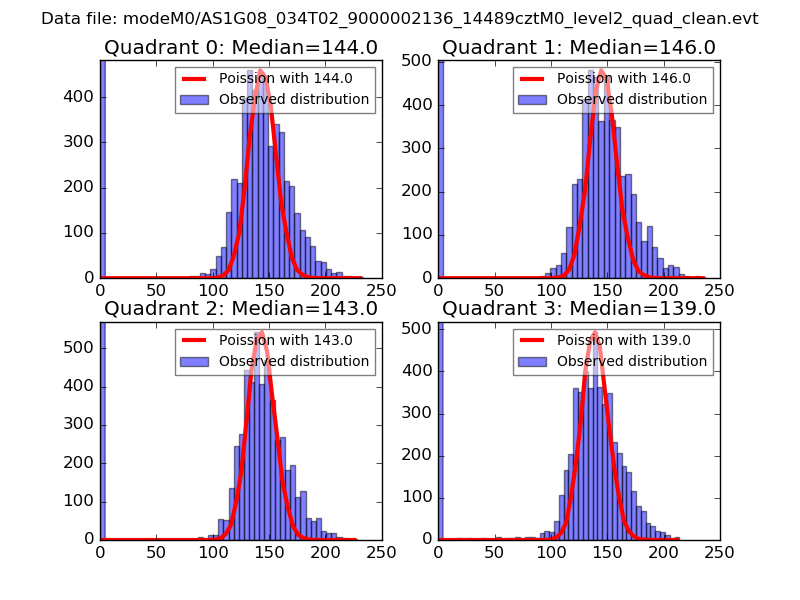 |
 |
| Quadrant-wise count rates Data is divided into 100 sec bins |
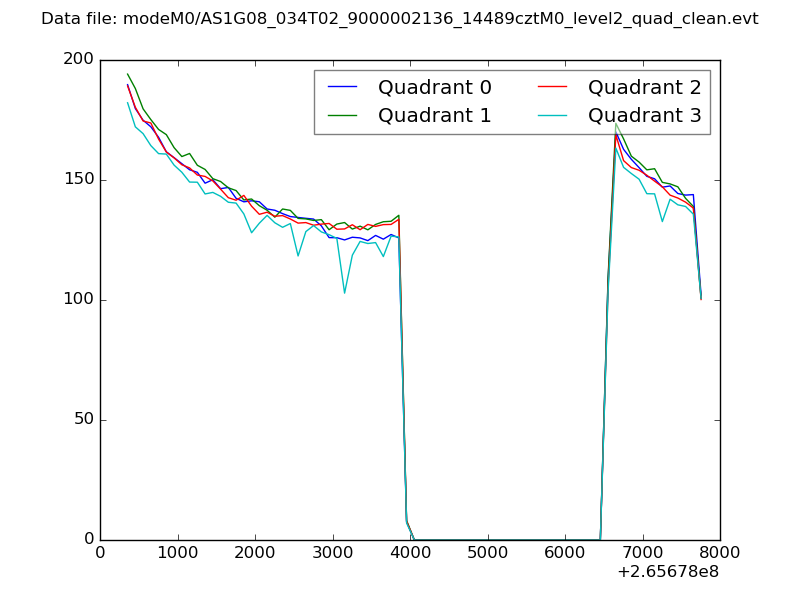 |
|
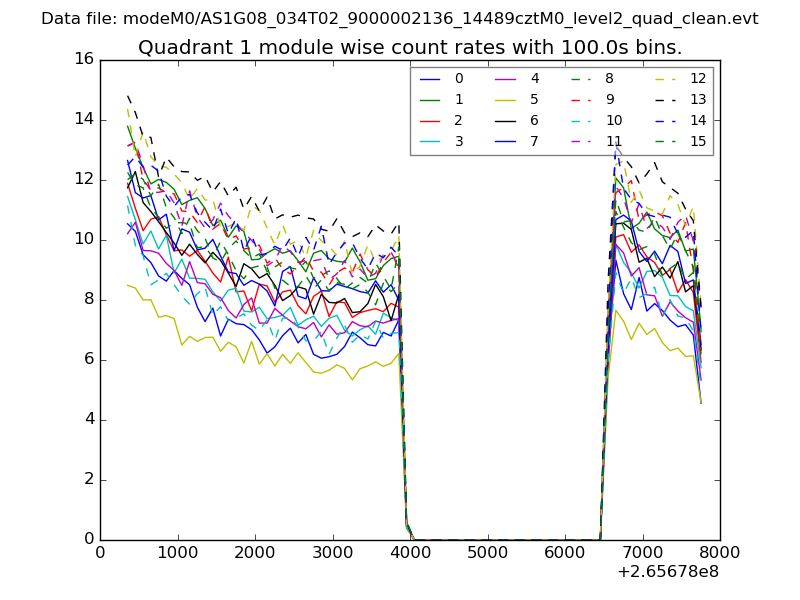
| Module-wise count rates for Quadrant A Data is divided into 100 sec bins |
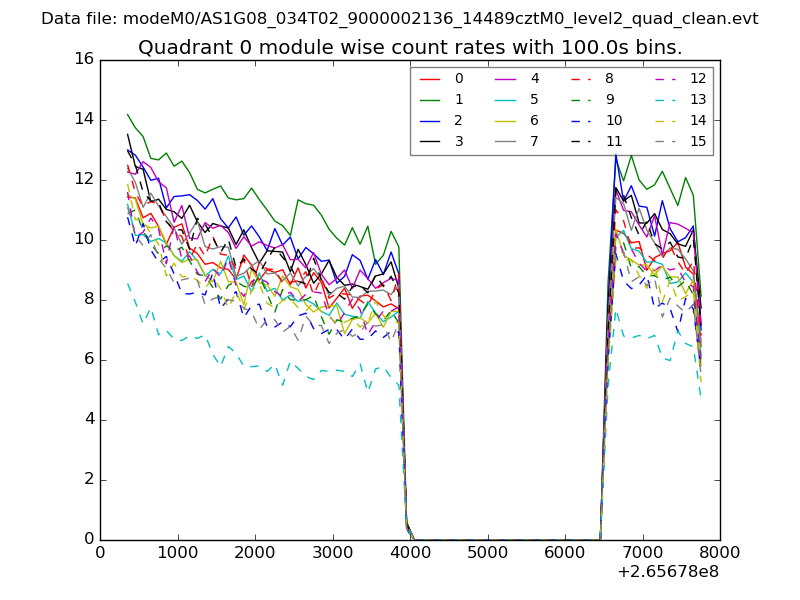 |
 |
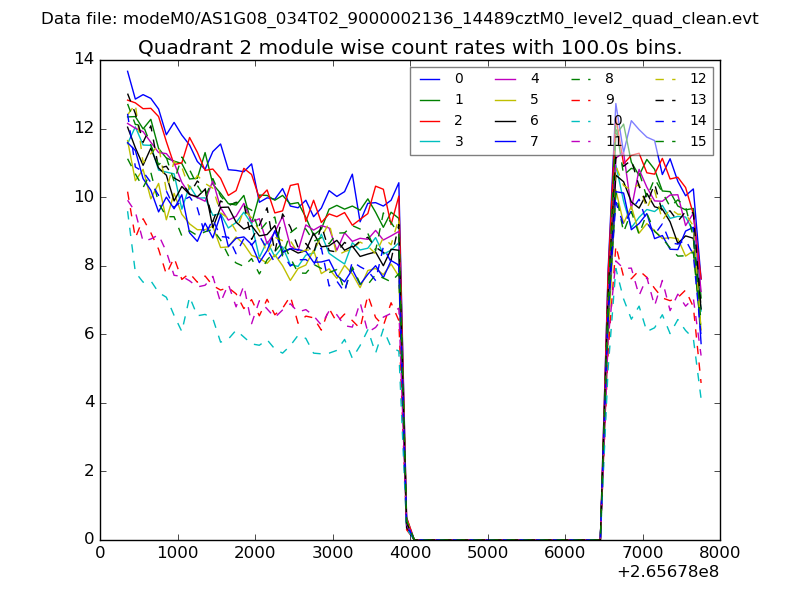
| Module-wise count rates for Quadrant B Data is divided into 100 sec bins |
 |
 |
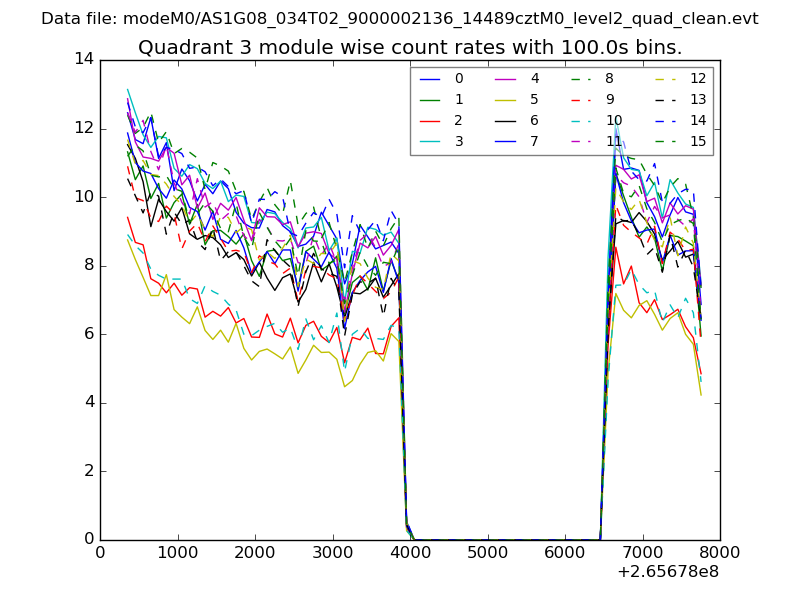
| Module-wise count rates for Quadrant C Data is divided into 100 sec bins |
 |
 |
| Module-wise count rates for Quadrant D Data is divided into 100 sec bins |
 |
 |
| Parameter | Plot |
|---|---|
| CZT HV Monitor | 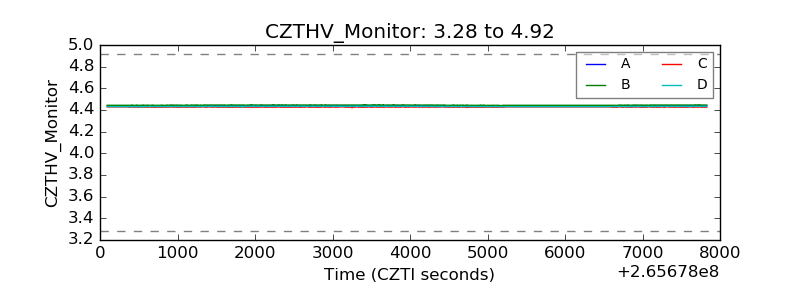 |
| D_VDD | 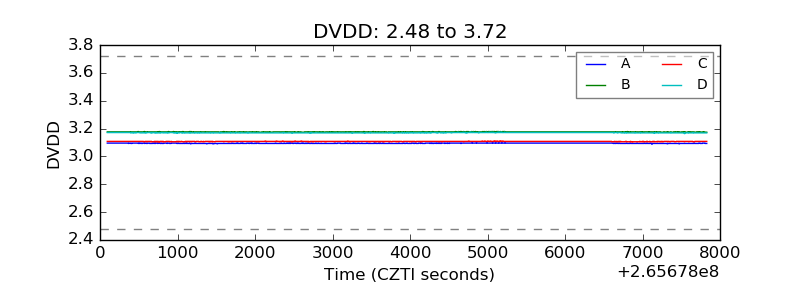 |
| Temperature 1 | 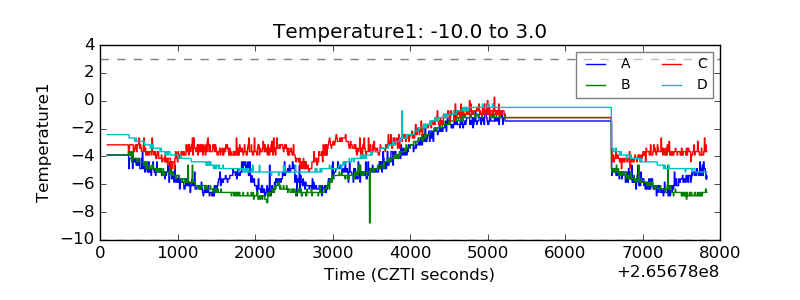 |
| Veto HV Monitor | 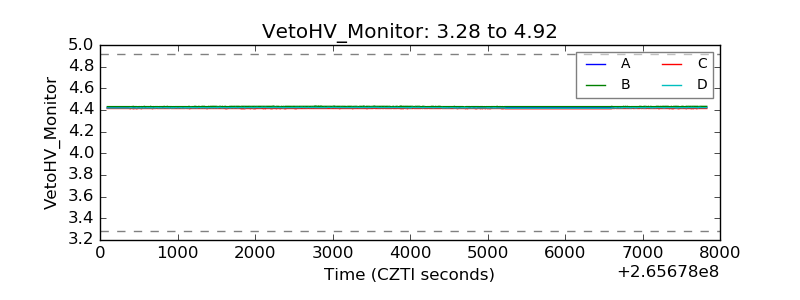 |
| Veto LLD | 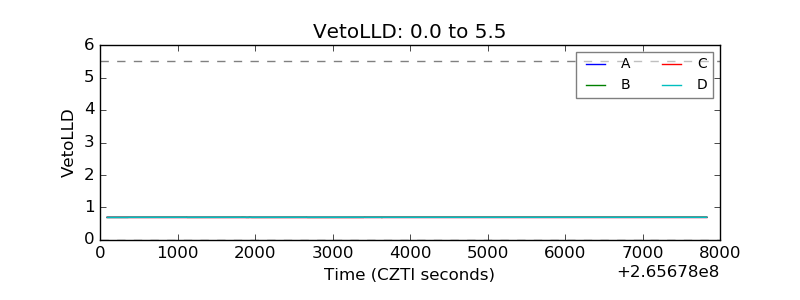 |
| Alpha Counter | 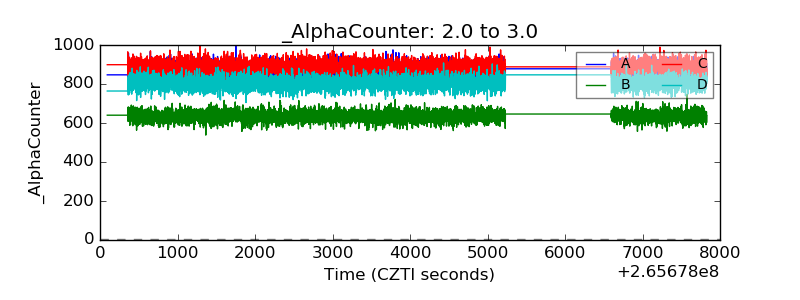 |
| _CPM_Rate | 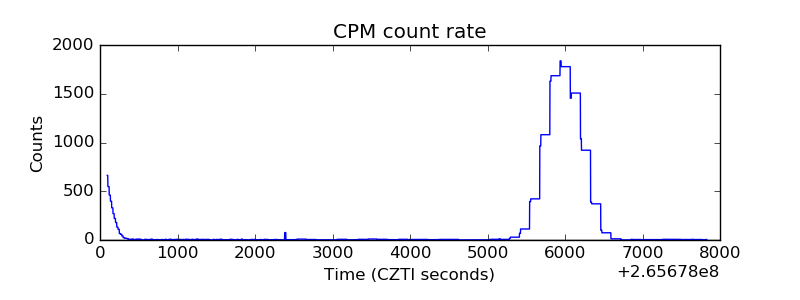 |
| CZT Counter | 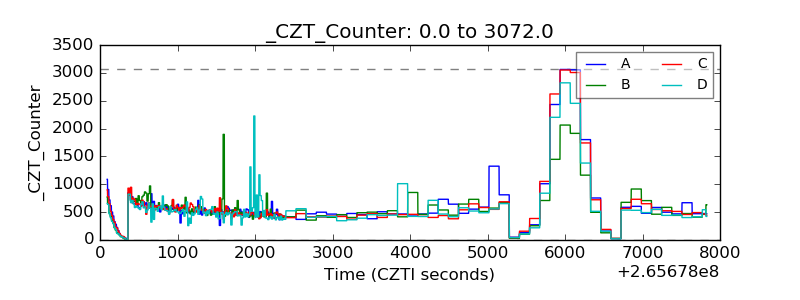 |
| +2.5 Volts monitor |  |
| +5 Volts monitor |  |
| _ROLL_ROT | 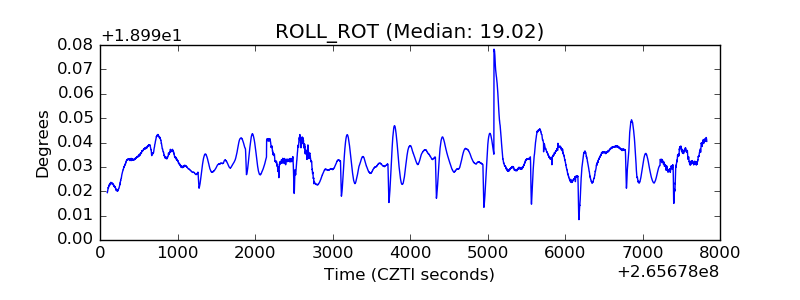 |
| _Roll_DEC | 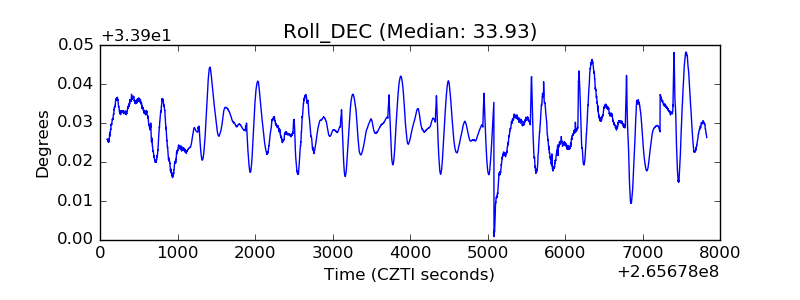 |
| _Roll_RA | 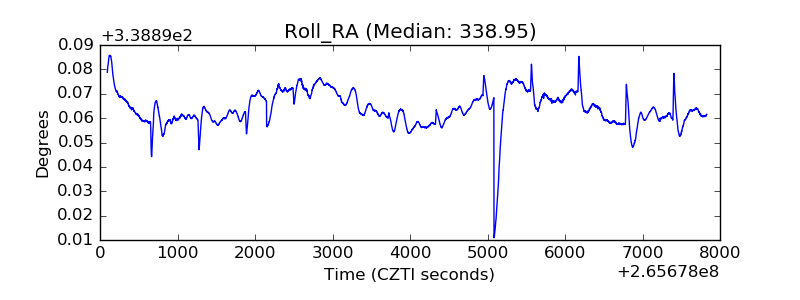 |
| Veto Counter | 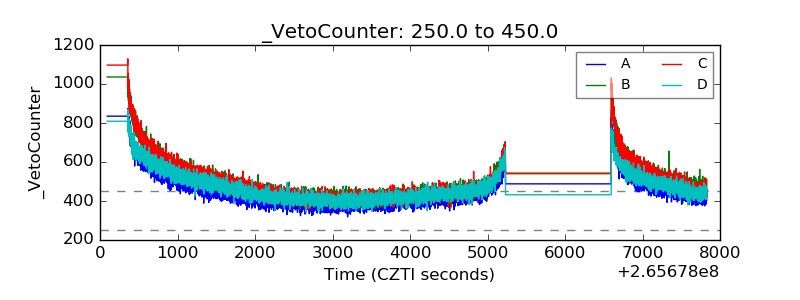 |