| Param | Original file | Final file |
|---|---|---|
| Filename | modeM0/AS1G08_034T02_9000002136_14490cztM0_level2.evt | modeM0/AS1G08_034T02_9000002136_14490cztM0_level2_quad_clean.evt |
| Size (bytes) | 462,997,440 | 96,180,480 |
| Size | 441.5 MB | 91.7 MB |
| Events in quadrant A | 3,097,495 | 625,303 |
| Events in quadrant B | 3,975,826 | 627,580 |
| Events in quadrant C | 3,120,877 | 620,336 |
| Events in quadrant D | 3,397,728 | 597,906 |
| Mode M0 | |||
|---|---|---|---|
| Quadrant | BADHDUFLAG | Total packets | Discarded packets |
| A | 0 | 13301 | 3 |
| B | 0 | 16087 | 2 |
| C | 0 | 13331 | 2 |
| D | 0 | 14380 | 2 |
| Mode SS | |||
|---|---|---|---|
| Quadrant | BADHDUFLAG | Total packets | Discarded packets |
| A | 0 | 128 | 0 |
| B | 0 | 128 | 0 |
| C | 0 | 128 | 0 |
| D | 0 | 128 | 0 |
| Mode M9 | |||
|---|---|---|---|
| Quadrant | BADHDUFLAG | Total packets | Discarded packets |
| A | 0 | 20 | 0 |
| B | 0 | 20 | 0 |
| C | 0 | 20 | 0 |
| D | 0 | 21 | 0 |
| Quadrant | Total seconds | Saturated seconds | Saturation percentage |
|---|---|---|---|
| A | 6330 | 27 | 0.426540% |
| B | 6330 | 232 | 3.665087% |
| C | 6330 | 24 | 0.379147% |
| D | 6330 | 68 | 1.074250% |
Noise dominated data is calculated using 1-second bins in cleaned event files. If a bin has >2000 counts, and if more than 50% of those come from <1% of pixels, then it is considered to be noise-dominated and hence unusable.
| Quadrant | # 1 sec bins | Bins with >0 counts | Bins with >2000 counts | High rate bins dominated by noise | Noise dominated (total time) | Noise dominated (detector-on time) | Marked lightcurve |
|---|---|---|---|---|---|---|---|
| A | 7586 | 6332 | 0 | 0 | 0.00% | 0.00% | 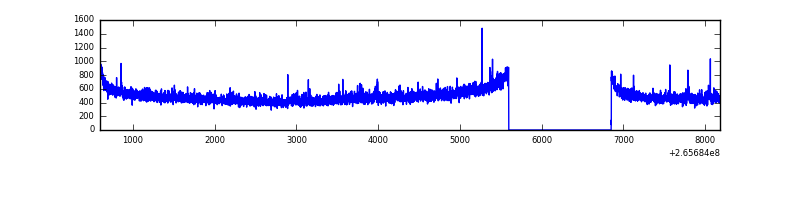 |
| B | 7586 | 6332 | 73 | 73 | 0.96% | 1.15% | 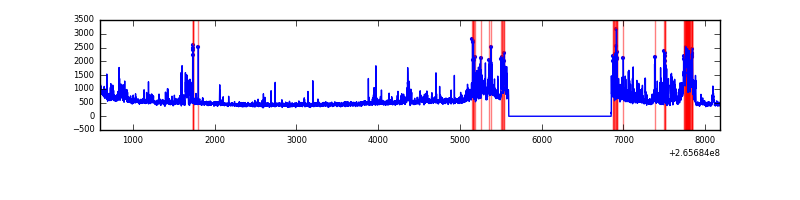 |
| C | 7586 | 6332 | 0 | 0 | 0.00% | 0.00% | 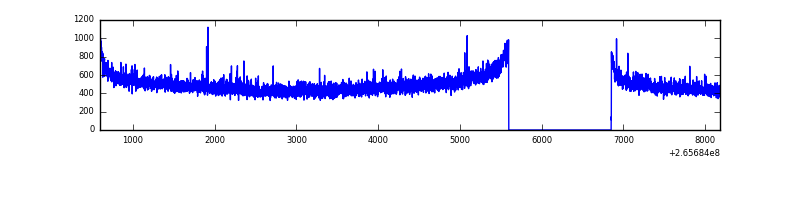 |
| D | 7586 | 6332 | 55 | 55 | 0.73% | 0.87% | 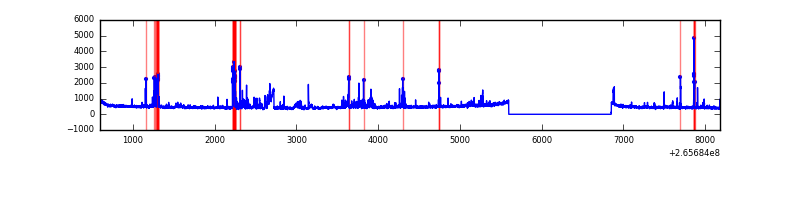 |
Top three noisy pixels from each quadrant. If the there are fewer than three noisy pixels in the level2.evt file, extra rows are filled as -1
| Pixel properties | Quadrant properties | ||||||
|---|---|---|---|---|---|---|---|
| Quadrant | DetID | PixID | Counts | Sigma | Mean | Median | Sigma |
| A | 12 | 189 | 54429 | 338.16 | 783 | 767 | 158.7 |
| A | 8 | 15 | 13370 | 79.42 | 783 | 767 | 158.7 |
| A | 0 | 226 | 6961 | 39.03 | 783 | 767 | 158.7 |
| B | 10 | 245 | 418884 | 2825.81 | 784 | 765 | 148.0 |
| B | 15 | 222 | 223793 | 1507.31 | 784 | 765 | 148.0 |
| B | 3 | 209 | 100359 | 673.09 | 784 | 765 | 148.0 |
| C | 3 | 233 | 115541 | 647.29 | 766 | 771 | 177.3 |
| C | 0 | 207 | 19401 | 105.07 | 766 | 771 | 177.3 |
| C | 13 | 61 | 5555 | 26.98 | 766 | 771 | 177.3 |
| D | 10 | 199 | 202880 | 1115.82 | 754 | 736 | 181.2 |
| D | 15 | 0 | 105833 | 580.13 | 754 | 736 | 181.2 |
| D | 10 | 70 | 94872 | 519.62 | 754 | 736 | 181.2 |
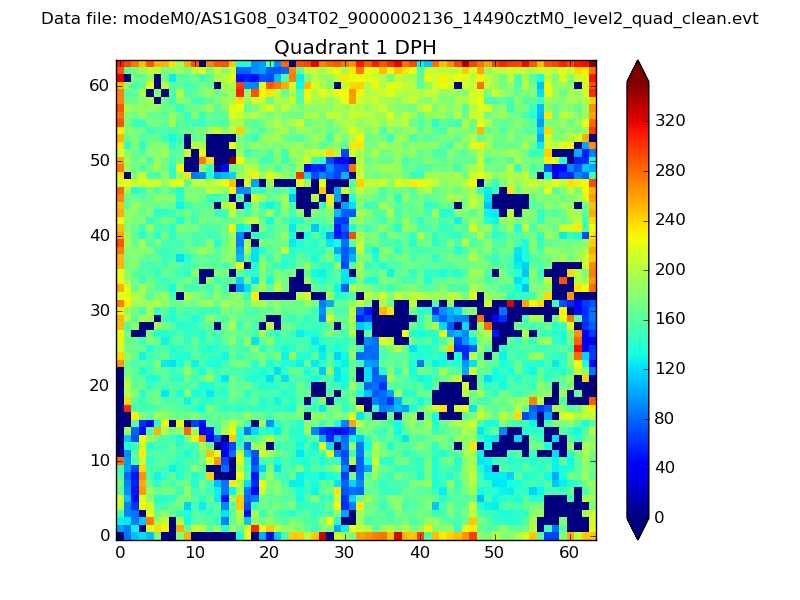
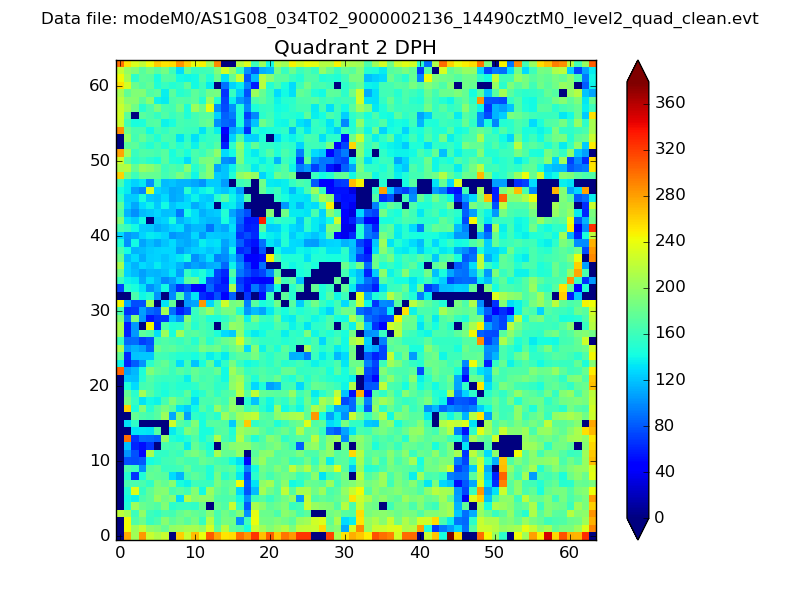
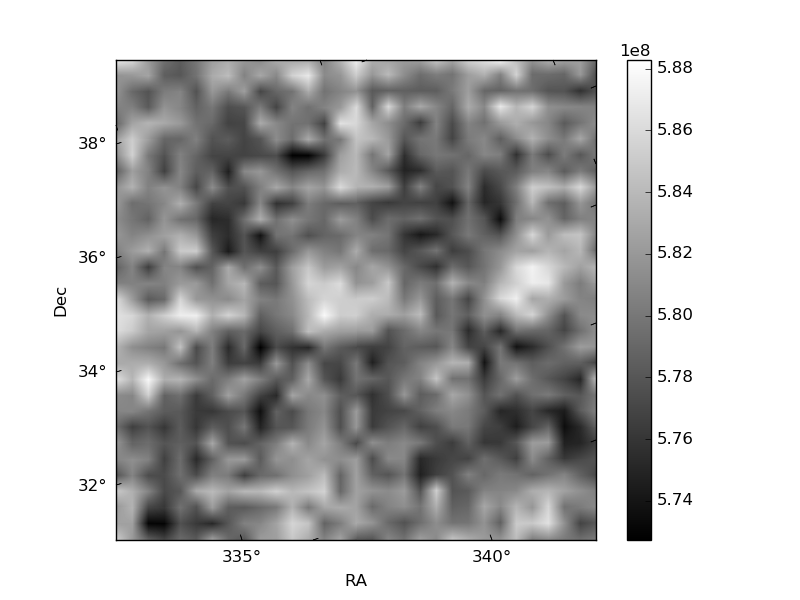
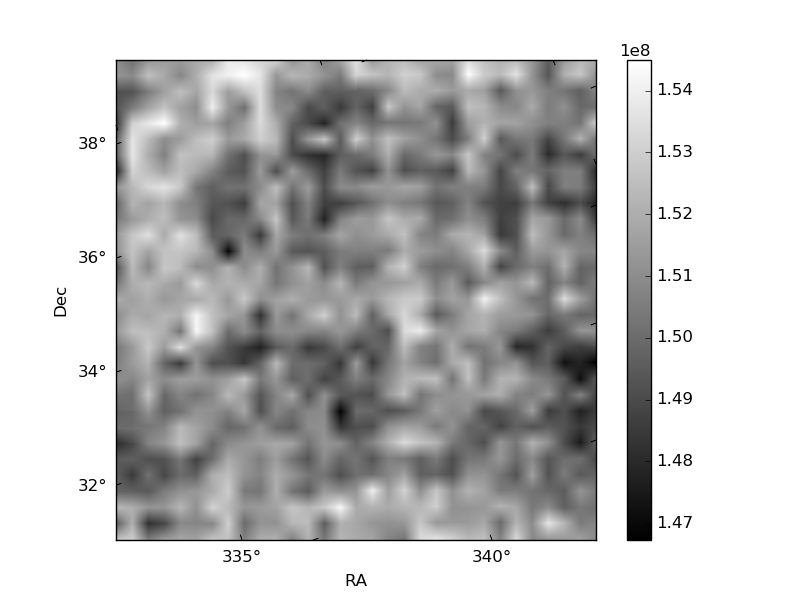
Histogram calculated using DETX and DETY for each event in the final _common_clean file
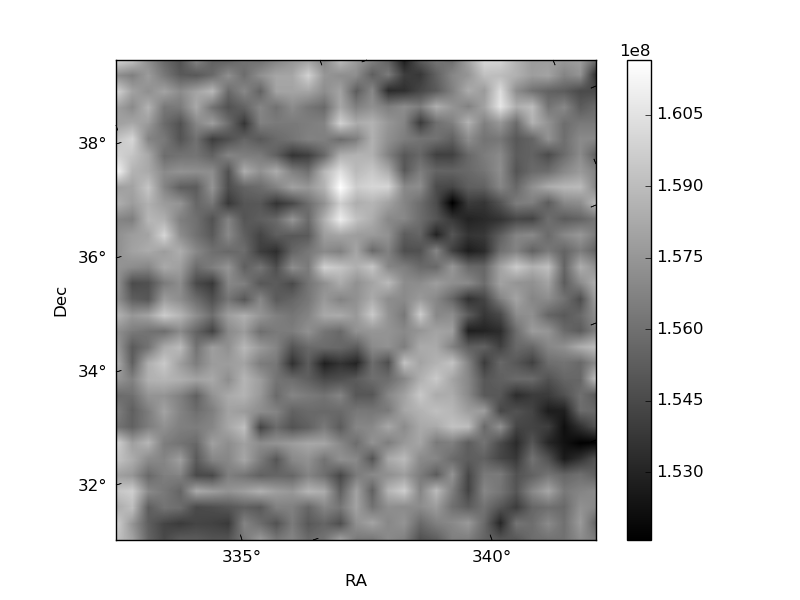
| Quadrant A |  |
 |
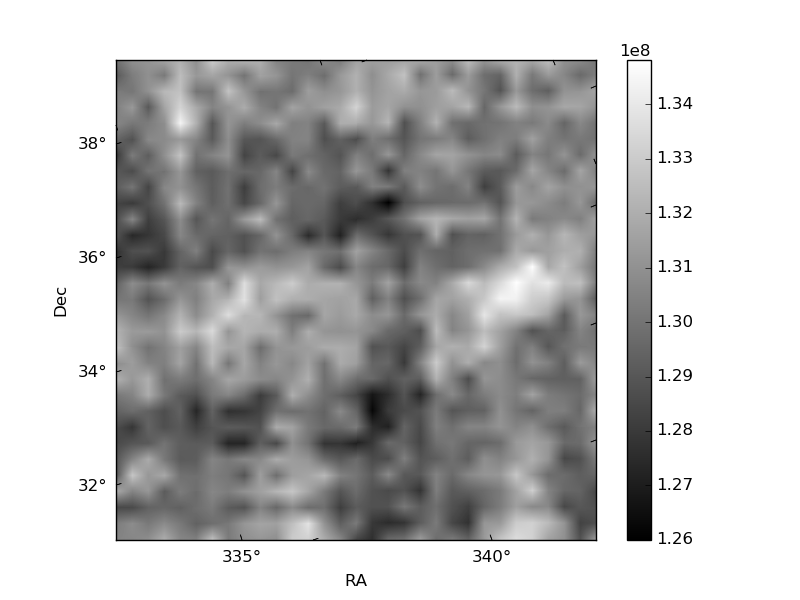
Quadrant B |
|---|---|---|---|
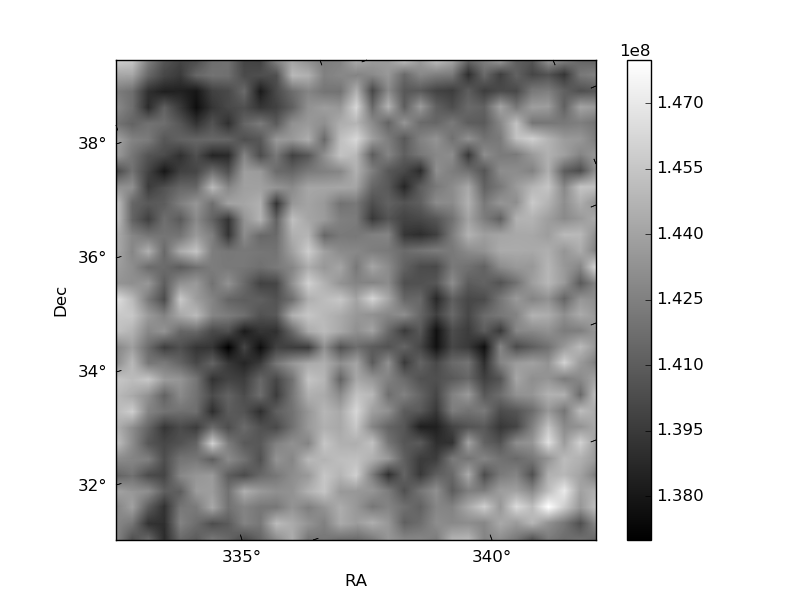
| Quadrant D | 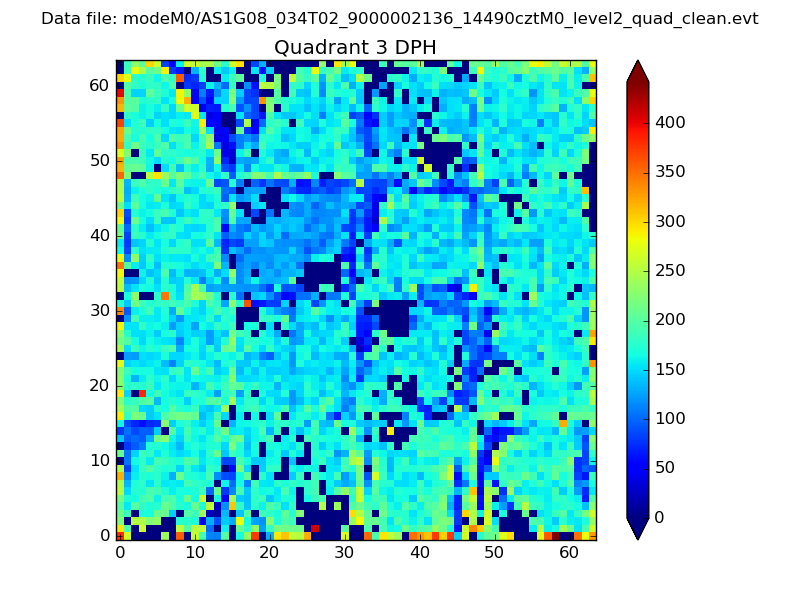 |
 |
Quadrant C |
| Plot type | Count rate plots | Images |
|---|---|---|
| Comparison with Poisson distribution Blue bars denote a histogram of data divided into 1 sec bins. Red curve is a Poisson curve with rate = median count rate of data. |
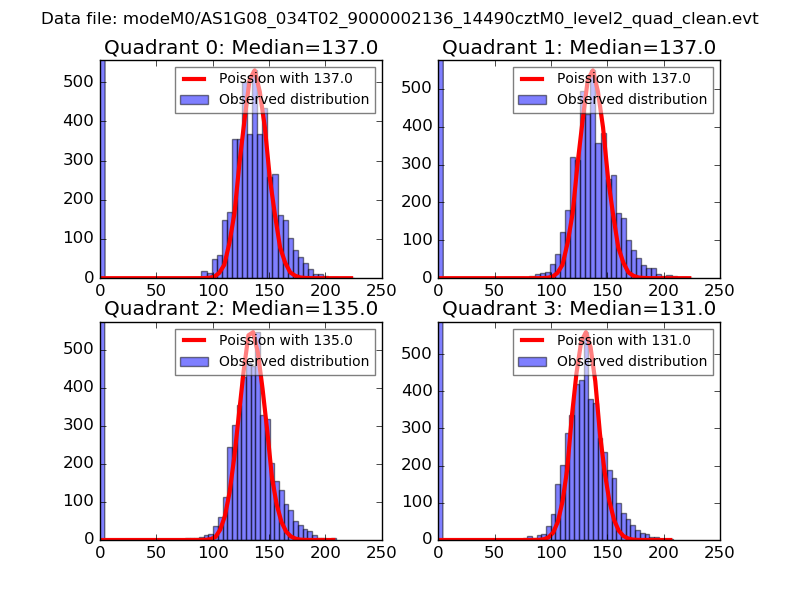 |
 |
| Quadrant-wise count rates Data is divided into 100 sec bins |
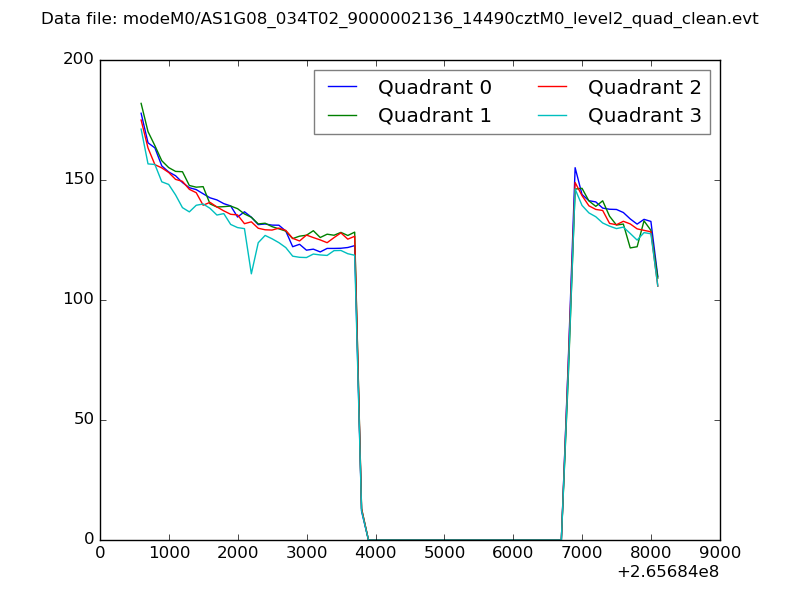 |
|
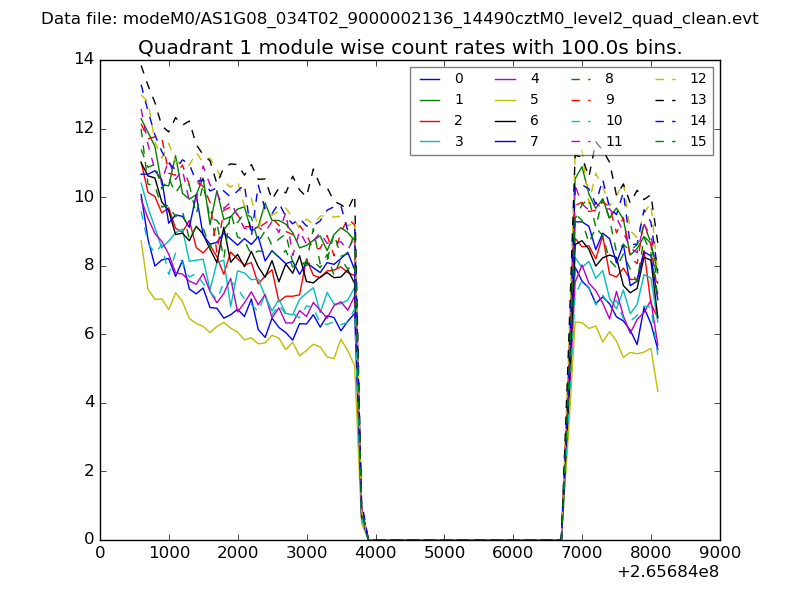
| Module-wise count rates for Quadrant A Data is divided into 100 sec bins |
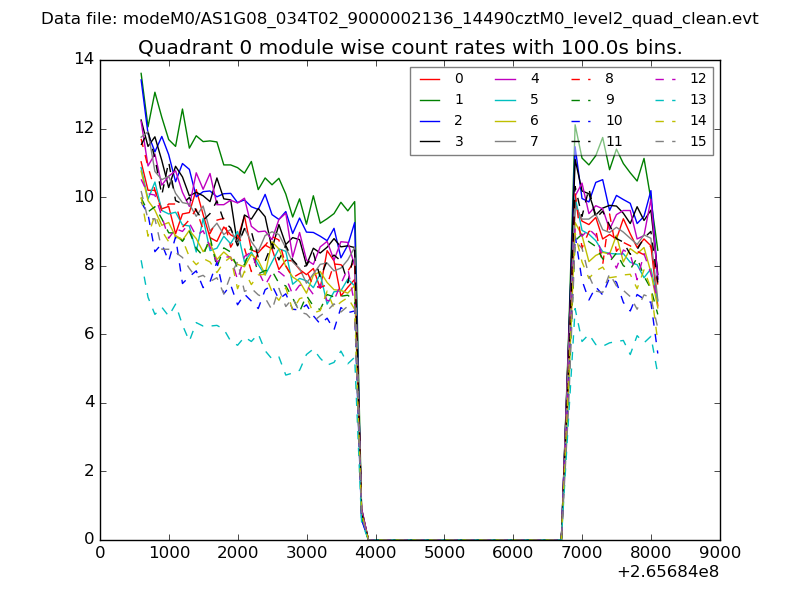 |
 |
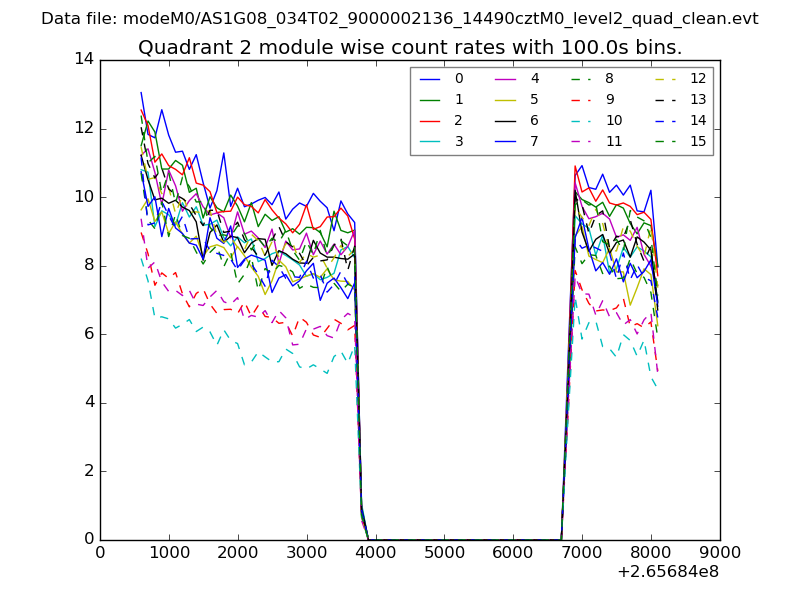
| Module-wise count rates for Quadrant B Data is divided into 100 sec bins |
 |
 |
| Module-wise count rates for Quadrant C Data is divided into 100 sec bins |
 |
 |
| Module-wise count rates for Quadrant D Data is divided into 100 sec bins |
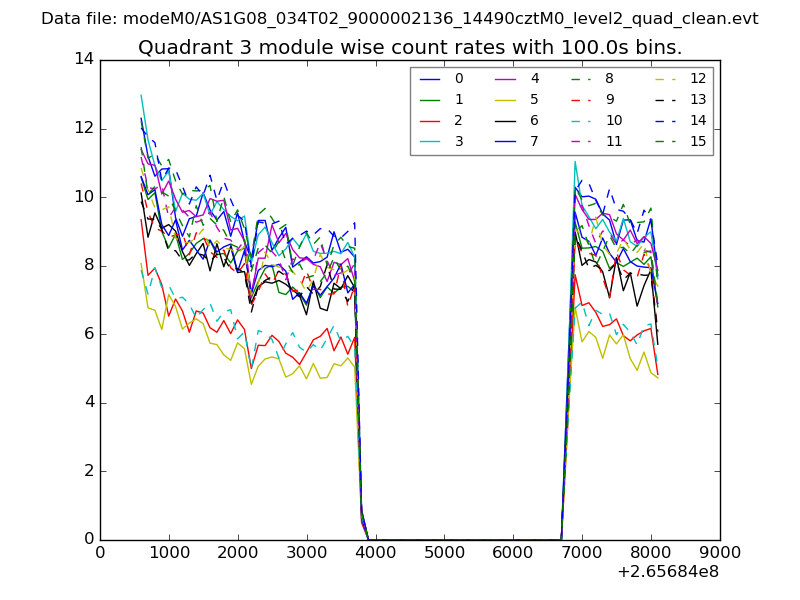 |
 |
| Parameter | Plot |
|---|---|
| CZT HV Monitor | 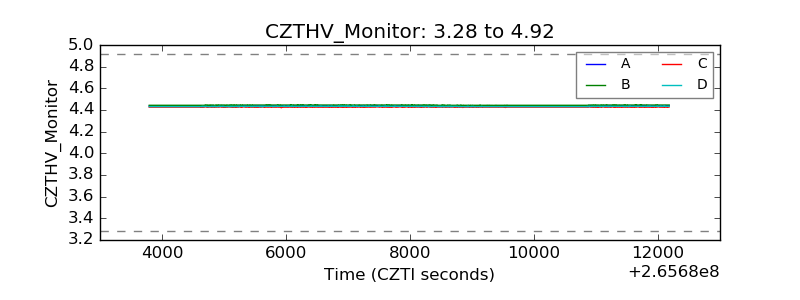 |
| D_VDD |  |
| Temperature 1 | 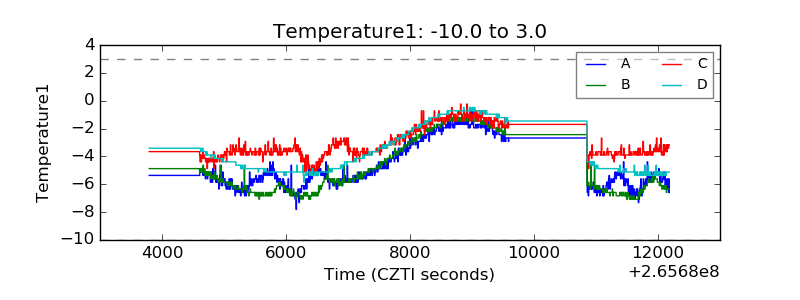 |
| Veto HV Monitor | 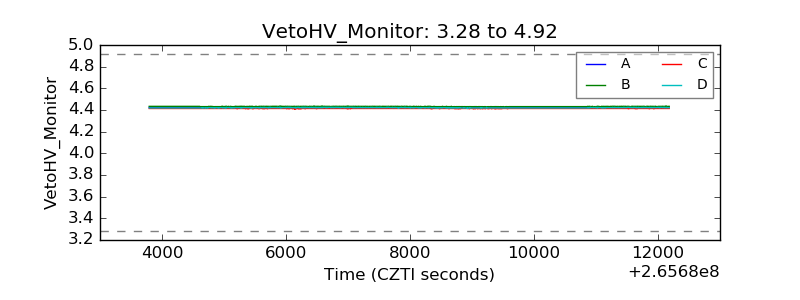 |
| Veto LLD |  |
| Alpha Counter | 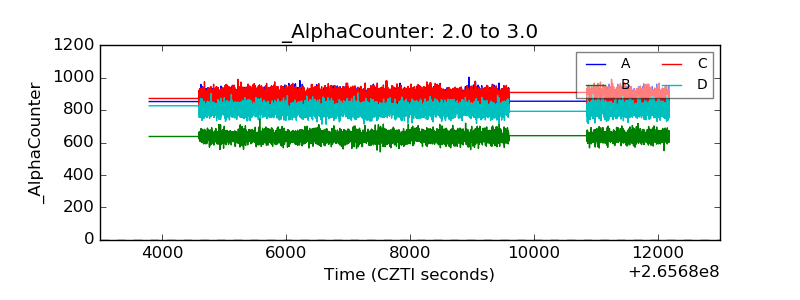 |
| _CPM_Rate | 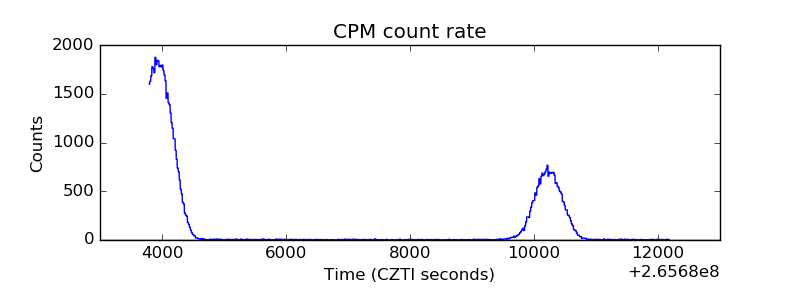 |
| CZT Counter | 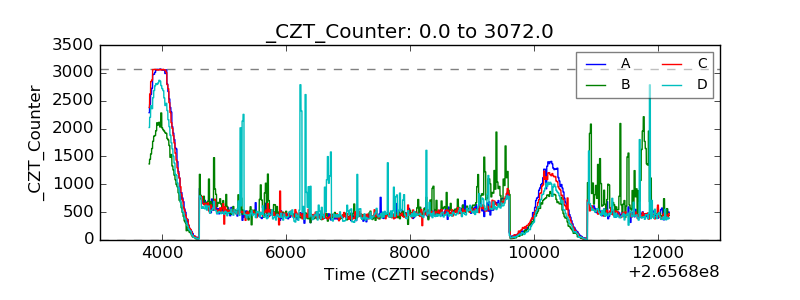 |
| +2.5 Volts monitor |  |
| +5 Volts monitor | 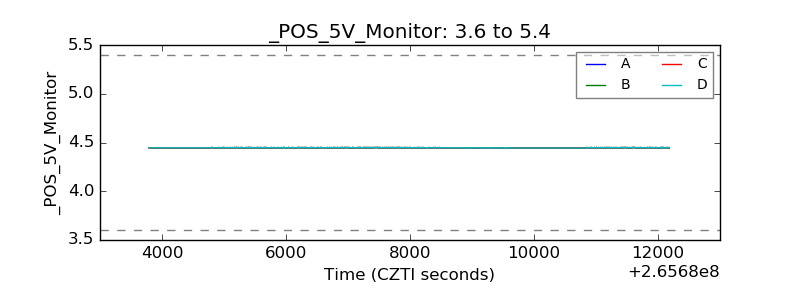 |
| _ROLL_ROT | 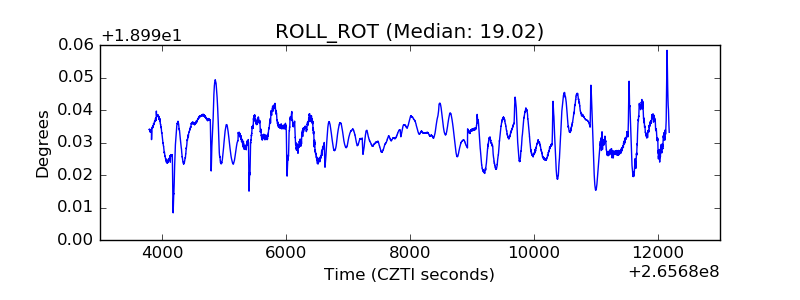 |
| _Roll_DEC | 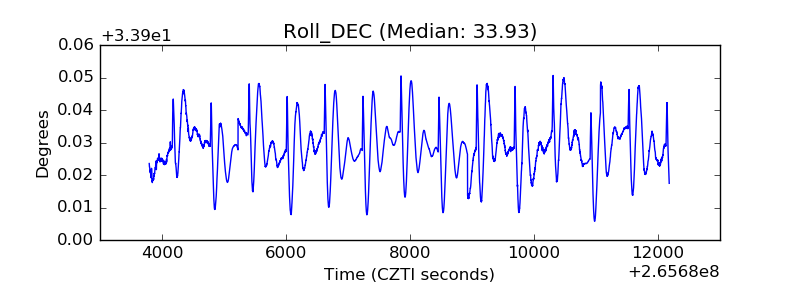 |
| _Roll_RA | 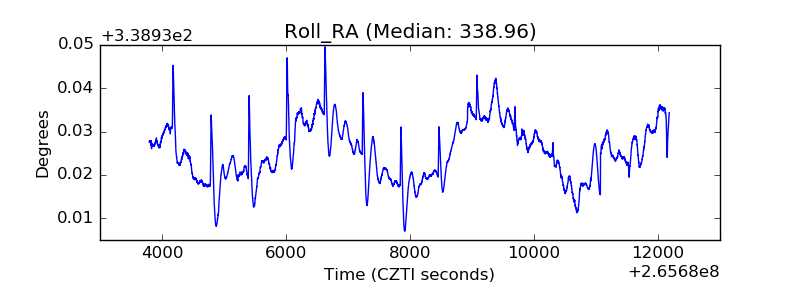 |
| Veto Counter | 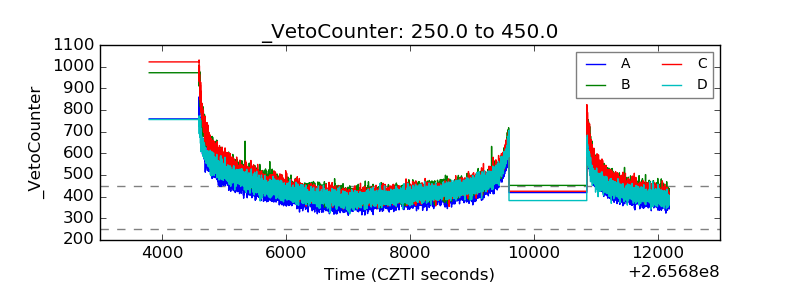 |