| Param | Original file | Final file |
|---|---|---|
| Filename | modeM0/AS1G08_034T02_9000002136_14491cztM0_level2.evt | modeM0/AS1G08_034T02_9000002136_14491cztM0_level2_quad_clean.evt |
| Size (bytes) | 84,024,000 | 22,631,040 |
| Size | 80.1 MB | 21.6 MB |
| Events in quadrant A | 524,527 | 152,133 |
| Events in quadrant B | 877,946 | 149,576 |
| Events in quadrant C | 531,348 | 151,884 |
| Events in quadrant D | 531,619 | 146,080 |
| Mode M0 | |||
|---|---|---|---|
| Quadrant | BADHDUFLAG | Total packets | Discarded packets |
| A | 0 | 3273 | 1025 |
| B | 0 | 4431 | 1074 |
| C | 0 | 3241 | 948 |
| D | 0 | 3346 | 993 |
| Mode SS | |||
|---|---|---|---|
| Quadrant | BADHDUFLAG | Total packets | Discarded packets |
| A | 0 | 31 | 9 |
| B | 0 | 31 | 9 |
| C | 0 | 32 | 10 |
| D | 0 | 32 | 10 |
| Quadrant | Total seconds | Saturated seconds | Saturation percentage |
|---|---|---|---|
| A | 1112 | 0 | 0.000000% |
| B | 1115 | 48 | 4.304933% |
| C | 1138 | 1 | 0.087873% |
| D | 1116 | 6 | 0.537634% |
Noise dominated data is calculated using 1-second bins in cleaned event files. If a bin has >2000 counts, and if more than 50% of those come from <1% of pixels, then it is considered to be noise-dominated and hence unusable.
| Quadrant | # 1 sec bins | Bins with >0 counts | Bins with >2000 counts | High rate bins dominated by noise | Noise dominated (total time) | Noise dominated (detector-on time) | Marked lightcurve |
|---|---|---|---|---|---|---|---|
| A | 1369 | 1174 | 0 | 0 | 0.00% | 0.00% | 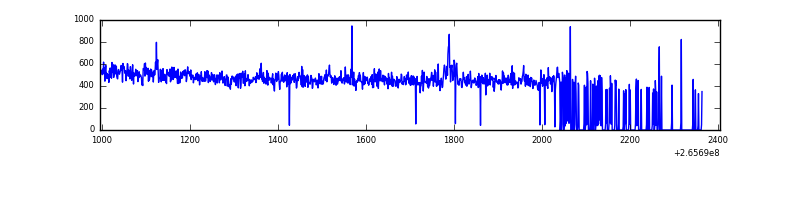 |
| B | 1339 | 1195 | 35 | 35 | 2.61% | 2.93% | 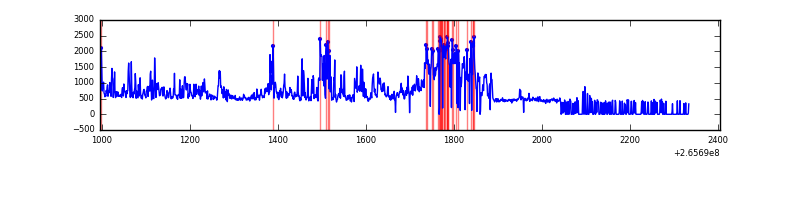 |
| C | 1403 | 1212 | 0 | 0 | 0.00% | 0.00% | 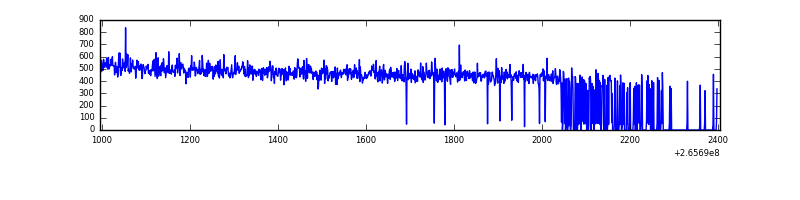 |
| D | 1409 | 1192 | 7 | 7 | 0.50% | 0.59% | 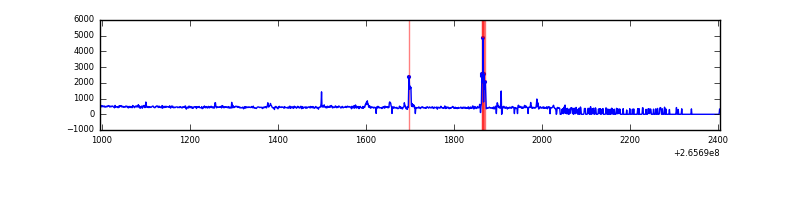 |
Top three noisy pixels from each quadrant. If the there are fewer than three noisy pixels in the level2.evt file, extra rows are filled as -1
| Pixel properties | Quadrant properties | ||||||
|---|---|---|---|---|---|---|---|
| Quadrant | DetID | PixID | Counts | Sigma | Mean | Median | Sigma |
| A | 12 | 189 | 17286 | 597.51 | 131 | 128 | 28.7 |
| A | 9 | 143 | 1831 | 59.31 | 131 | 128 | 28.7 |
| A | 8 | 15 | 1312 | 41.23 | 131 | 128 | 28.7 |
| B | 15 | 222 | 197574 | 7104.08 | 132 | 129 | 27.8 |
| B | 10 | 245 | 158765 | 5707.73 | 132 | 129 | 27.8 |
| B | 12 | 111 | 2763 | 94.77 | 132 | 129 | 27.8 |
| C | 3 | 233 | 14214 | 428.82 | 132 | 133 | 32.8 |
| C | 0 | 207 | 1095 | 29.3 | 132 | 133 | 32.8 |
| C | 13 | 61 | 979 | 25.76 | 132 | 133 | 32.8 |
| D | 10 | 199 | 43682 | 1331.14 | 126 | 123 | 32.7 |
| D | 2 | 234 | 3920 | 116.03 | 126 | 123 | 32.7 |
| D | 15 | 0 | 3806 | 112.55 | 126 | 123 | 32.7 |
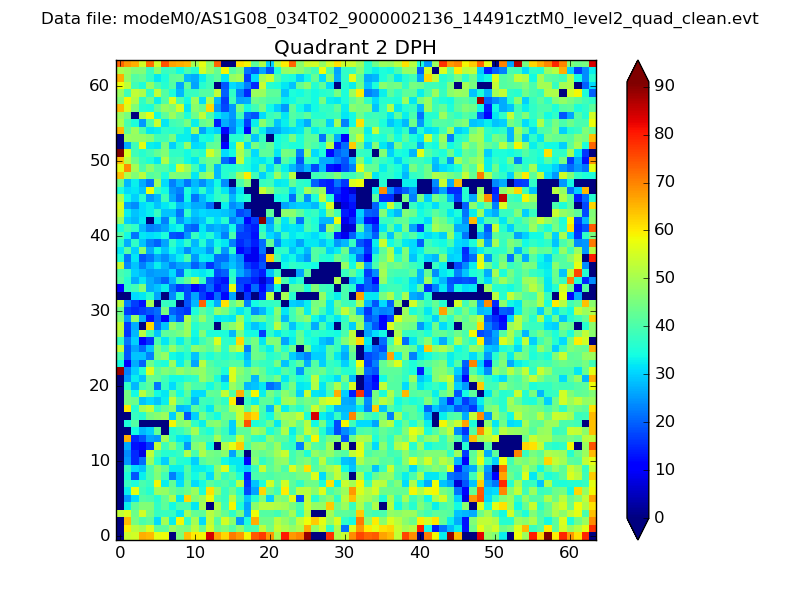
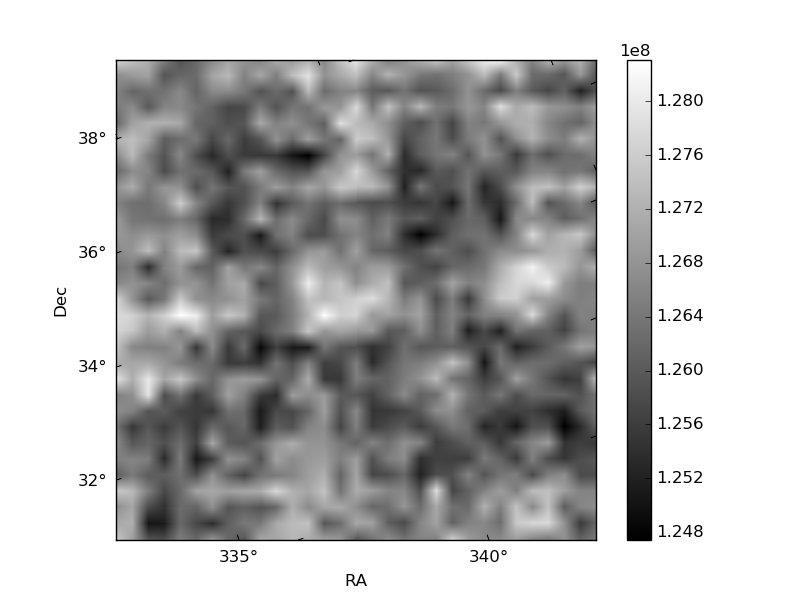
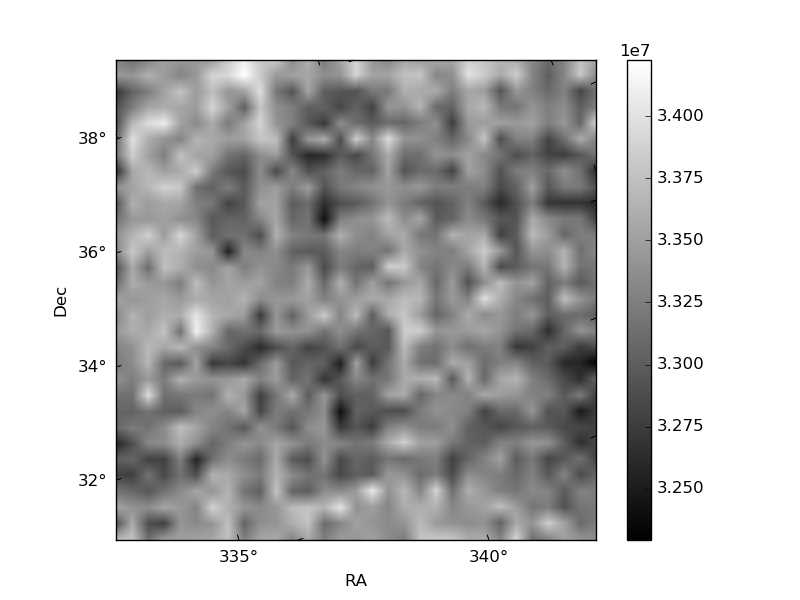
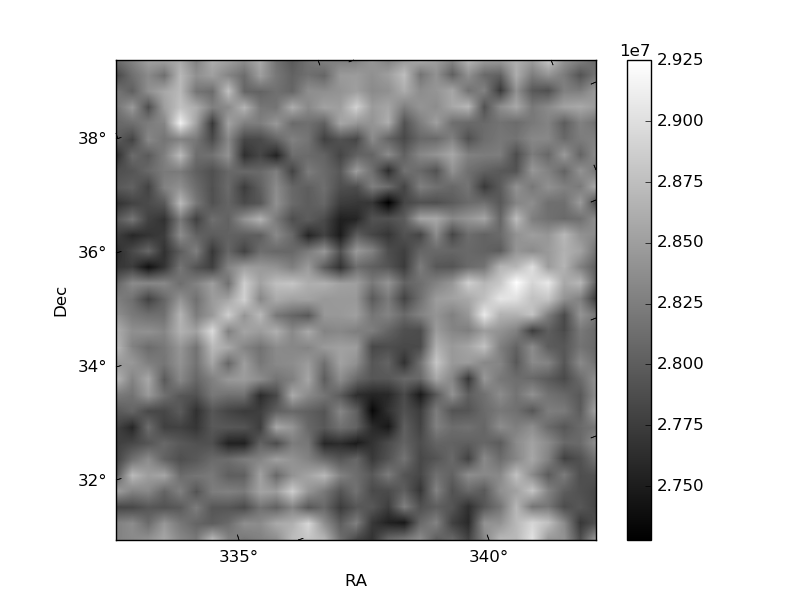
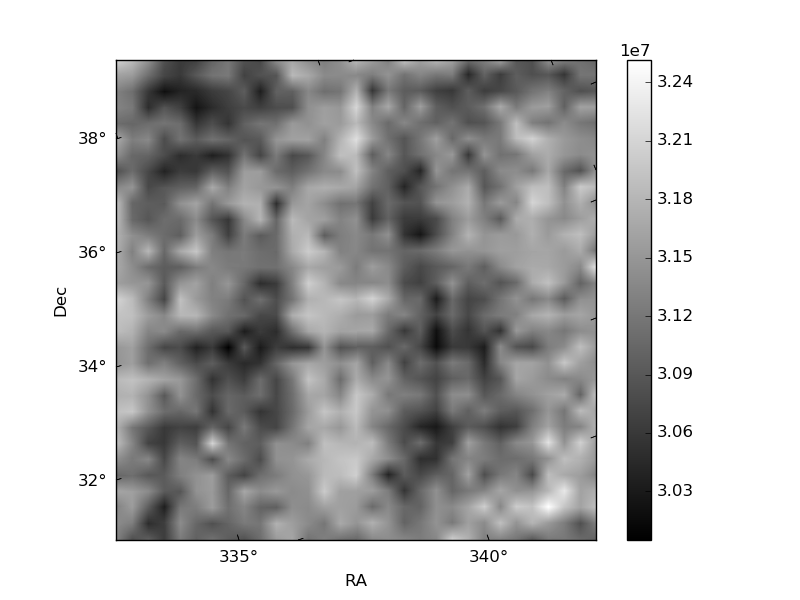
Histogram calculated using DETX and DETY for each event in the final _common_clean file
| Quadrant A | 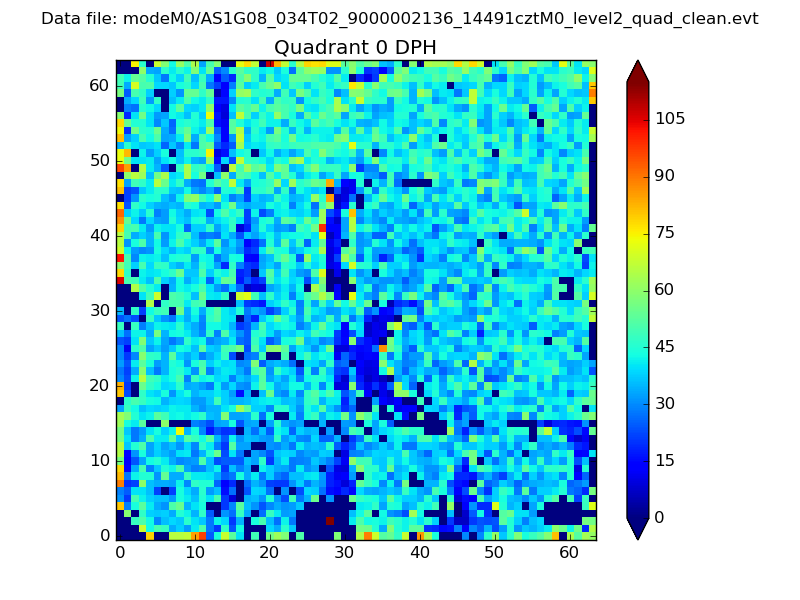 |
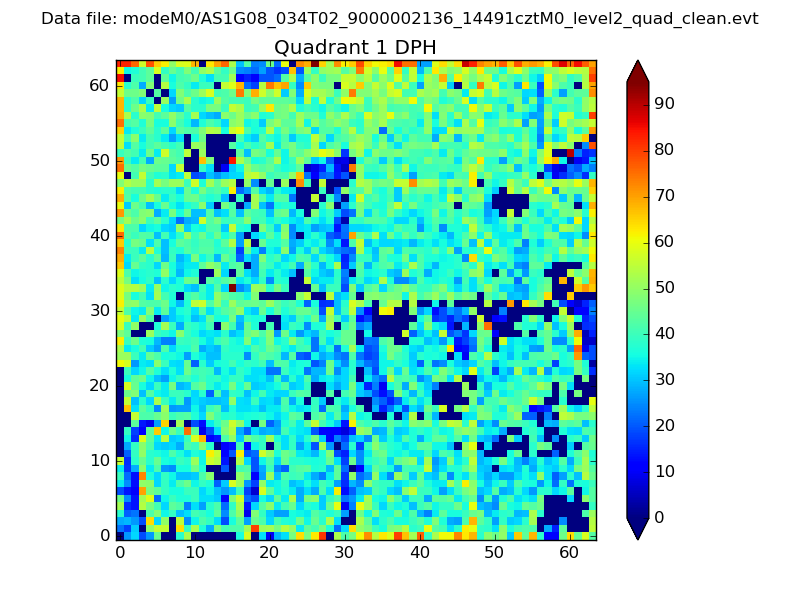 |
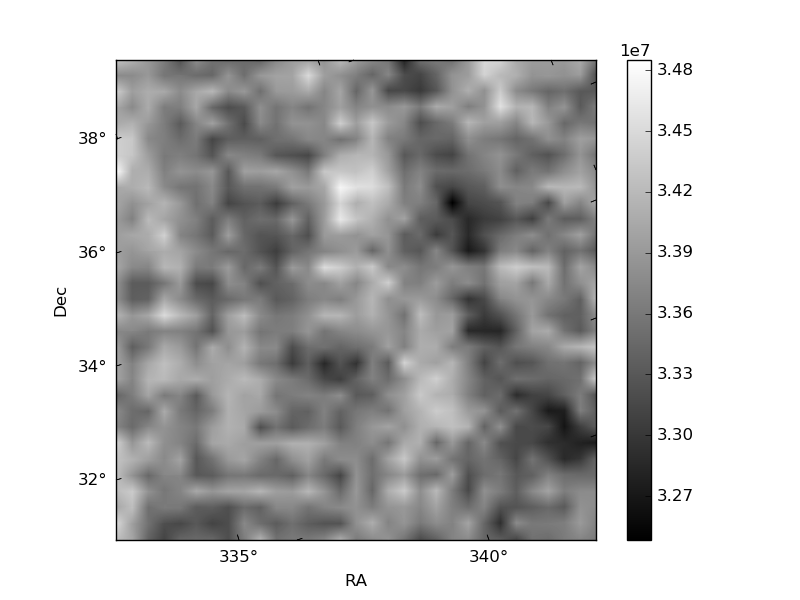
Quadrant B |
|---|---|---|---|
| Quadrant D | 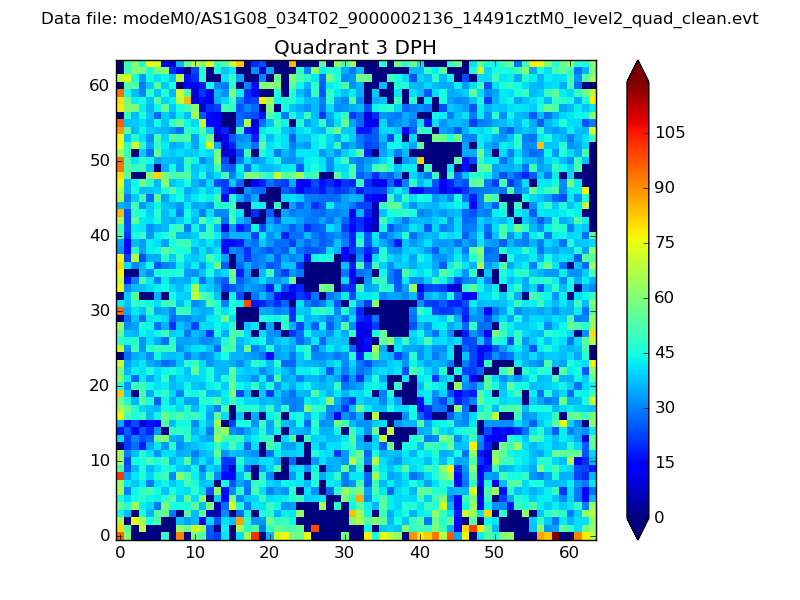 |
 |
Quadrant C |
| Plot type | Count rate plots | Images |
|---|---|---|
| Comparison with Poisson distribution Blue bars denote a histogram of data divided into 1 sec bins. Red curve is a Poisson curve with rate = median count rate of data. |
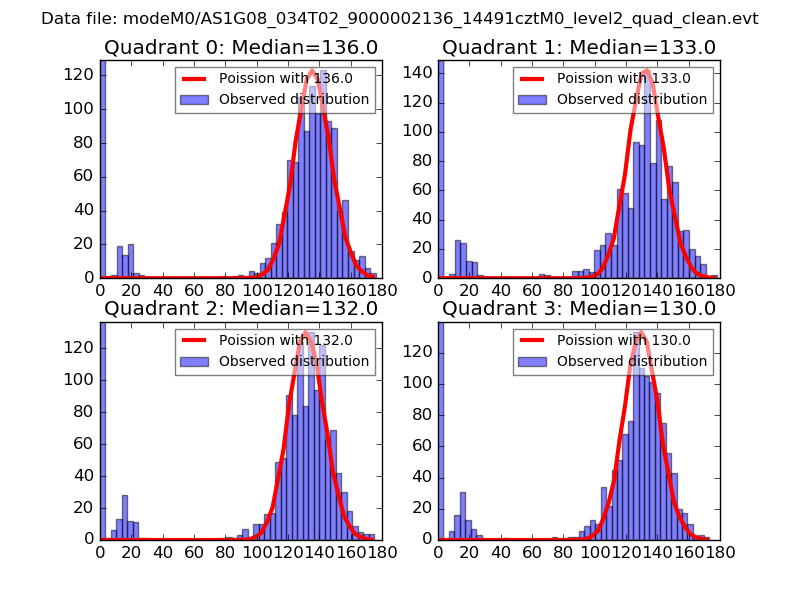 |
 |
| Quadrant-wise count rates Data is divided into 100 sec bins |
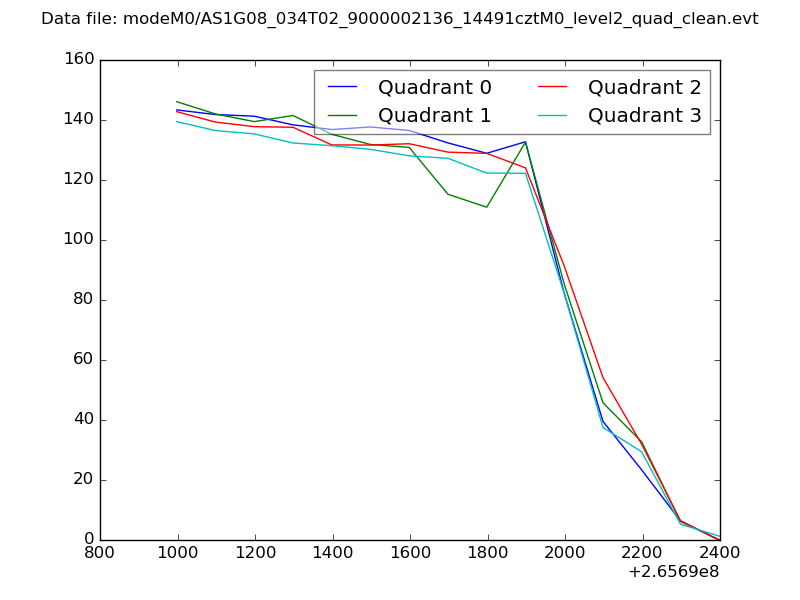 |
|
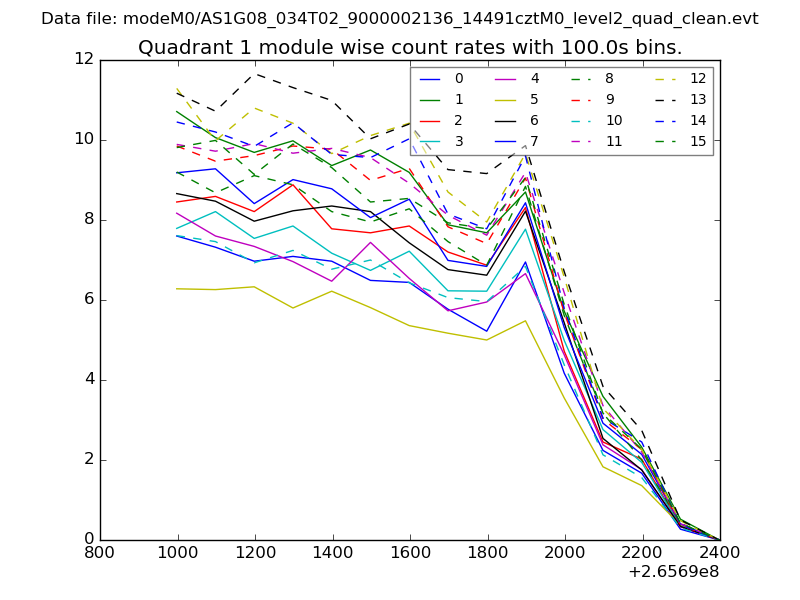
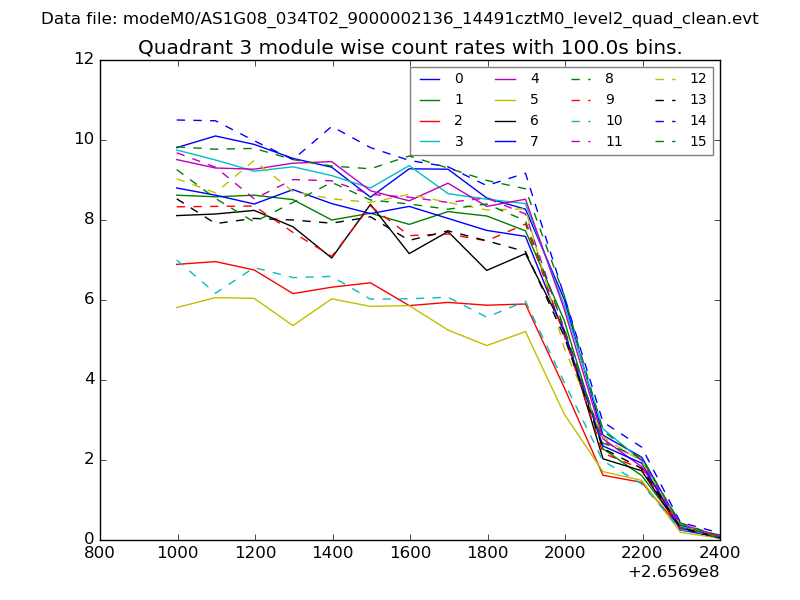
| Module-wise count rates for Quadrant A Data is divided into 100 sec bins |
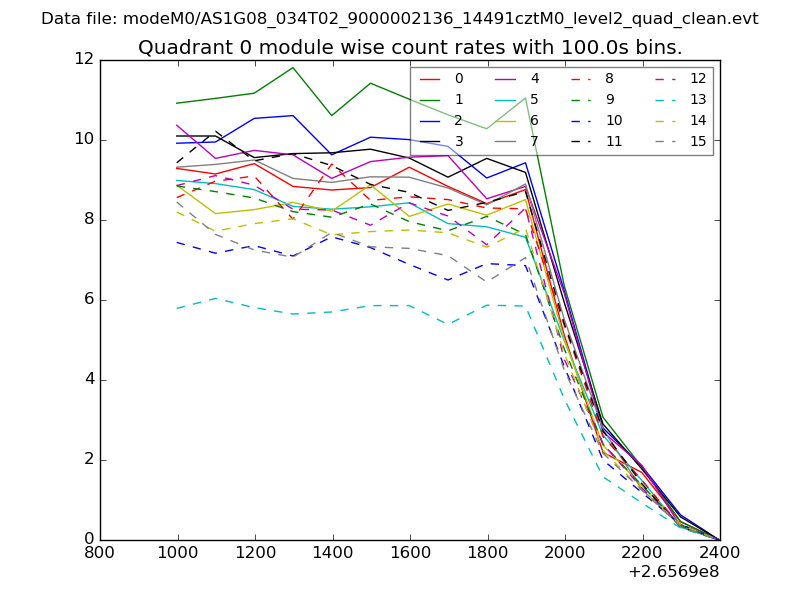 |
 |
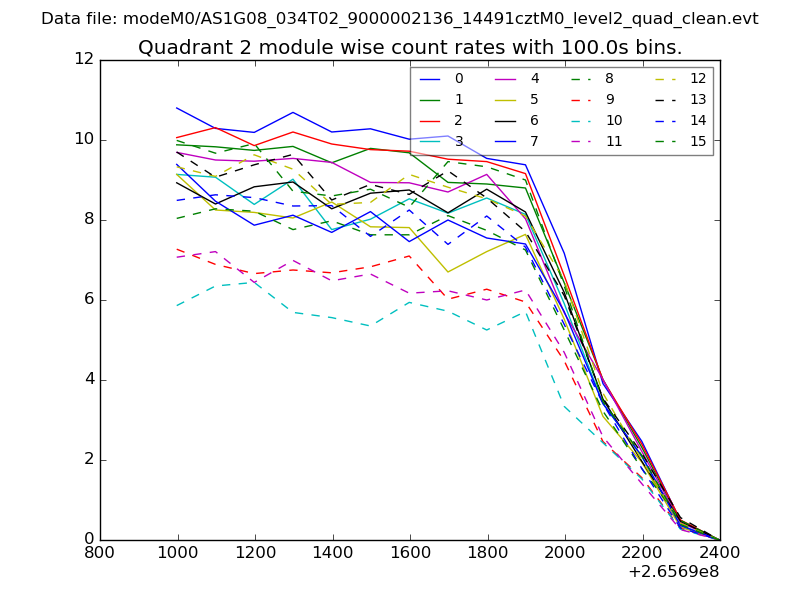
| Module-wise count rates for Quadrant B Data is divided into 100 sec bins |
 |
 |
| Module-wise count rates for Quadrant C Data is divided into 100 sec bins |
 |
 |
| Module-wise count rates for Quadrant D Data is divided into 100 sec bins |
 |
 |
| Parameter | Plot |
|---|---|
| CZT HV Monitor | 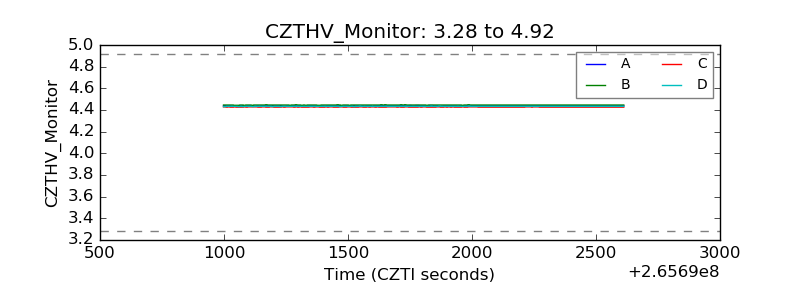 |
| D_VDD | 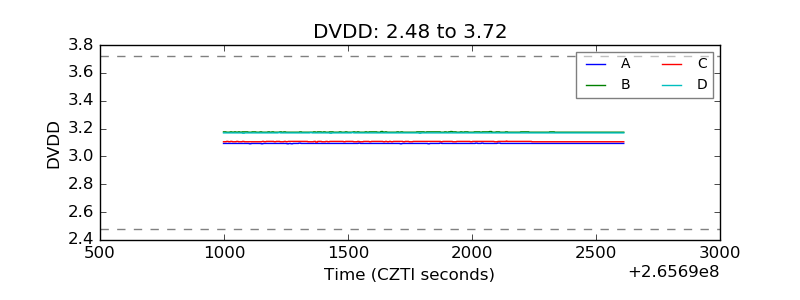 |
| Temperature 1 | 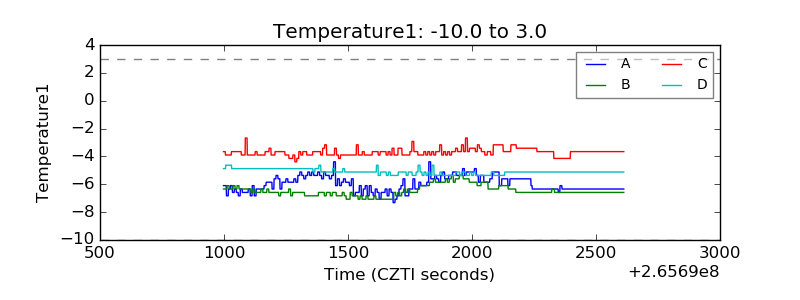 |
| Veto HV Monitor | 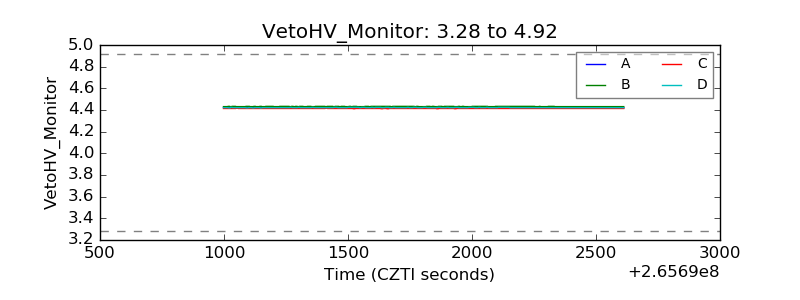 |
| Veto LLD | 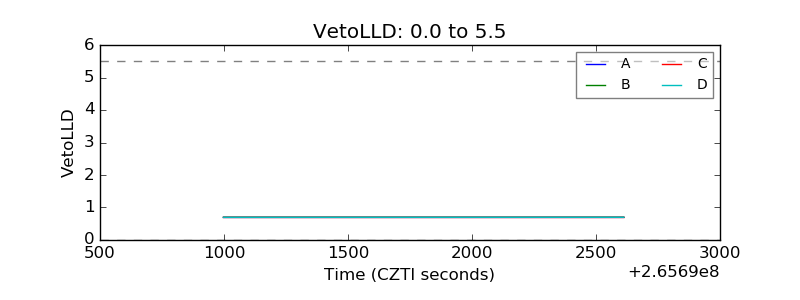 |
| Alpha Counter | 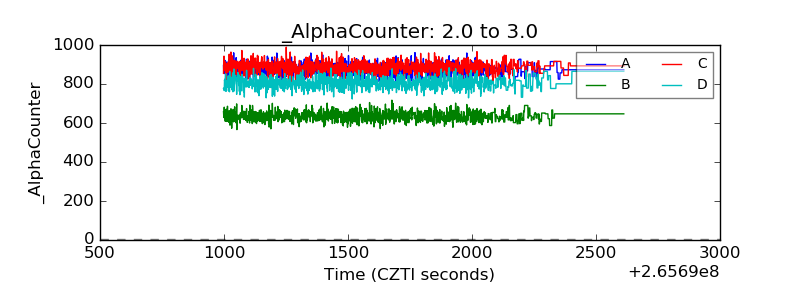 |
| _CPM_Rate | 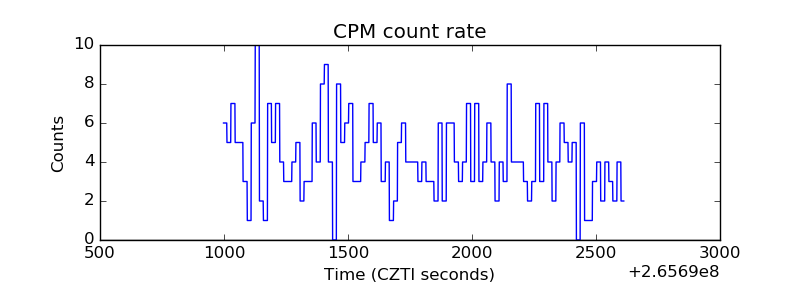 |
| CZT Counter | 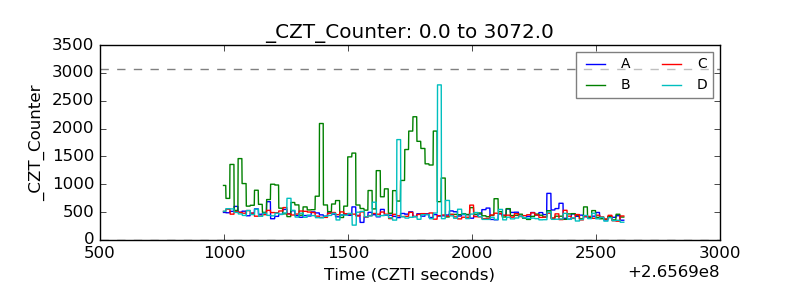 |
| +2.5 Volts monitor |  |
| +5 Volts monitor |  |
| _ROLL_ROT | 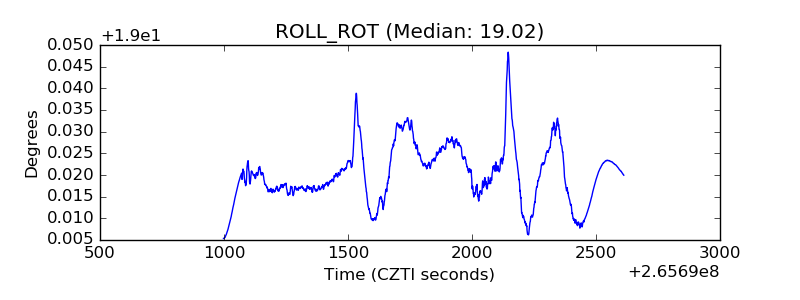 |
| _Roll_DEC | 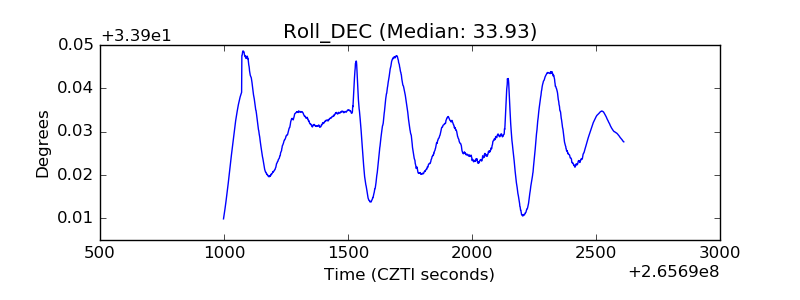 |
| _Roll_RA |  |
| Veto Counter | 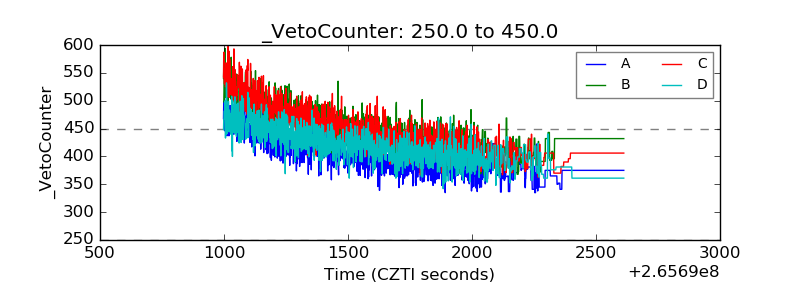 |