| Param | Original file | Final file |
|---|---|---|
| Filename | modeM0/AS1G08_034T02_9000002136_14492cztM0_level2.evt | modeM0/AS1G08_034T02_9000002136_14492cztM0_level2_quad_clean.evt |
| Size (bytes) | 317,039,040 | 32,172,480 |
| Size | 302.4 MB | 30.7 MB |
| Events in quadrant A | 2,409,071 | 165,789 |
| Events in quadrant B | 2,330,450 | 170,596 |
| Events in quadrant C | 2,359,458 | 167,716 |
| Events in quadrant D | 2,206,158 | 164,173 |
| Mode M0 | |||
|---|---|---|---|
| Quadrant | BADHDUFLAG | Total packets | Discarded packets |
| A | 0 | 11324 | 1338 |
| B | 0 | 11192 | 1475 |
| C | 0 | 11060 | 1382 |
| D | 0 | 10871 | 1323 |
| Mode SS | |||
|---|---|---|---|
| Quadrant | BADHDUFLAG | Total packets | Discarded packets |
| A | 0 | 102 | 20 |
| B | 0 | 102 | 14 |
| C | 0 | 103 | 17 |
| D | 0 | 103 | 15 |
| Mode M9 | |||
|---|---|---|---|
| Quadrant | BADHDUFLAG | Total packets | Discarded packets |
| A | 0 | 6 | 2 |
| B | 0 | 8 | 4 |
| C | 0 | 4 | 0 |
| D | 0 | 6 | 2 |
| Quadrant | Total seconds | Saturated seconds | Saturation percentage |
|---|---|---|---|
| A | 4337 | 193 | 4.450081% |
| B | 4325 | 179 | 4.138728% |
| C | 4365 | 70 | 1.603666% |
| D | 4356 | 127 | 2.915519% |
Noise dominated data is calculated using 1-second bins in cleaned event files. If a bin has >2000 counts, and if more than 50% of those come from <1% of pixels, then it is considered to be noise-dominated and hence unusable.
| Quadrant | # 1 sec bins | Bins with >0 counts | Bins with >2000 counts | High rate bins dominated by noise | Noise dominated (total time) | Noise dominated (detector-on time) | Marked lightcurve |
|---|---|---|---|---|---|---|---|
| A | 5409 | 4597 | 55 | 55 | 1.02% | 1.20% | 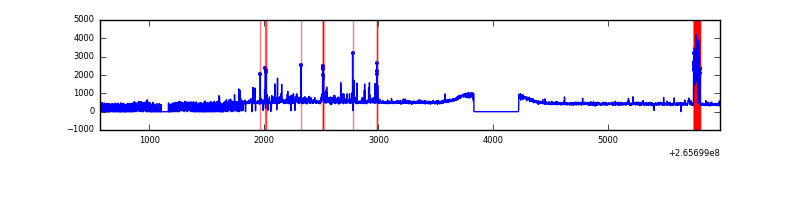 |
| B | 5411 | 4573 | 7 | 7 | 0.13% | 0.15% | 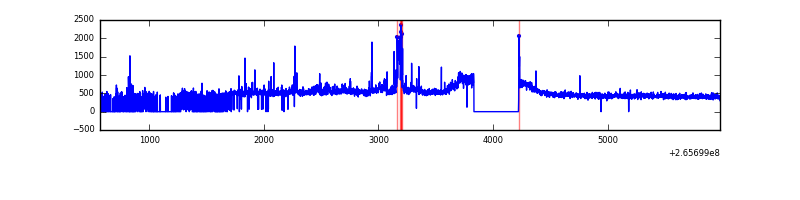 |
| C | 5411 | 4631 | 0 | 0 | 0.00% | 0.00% | 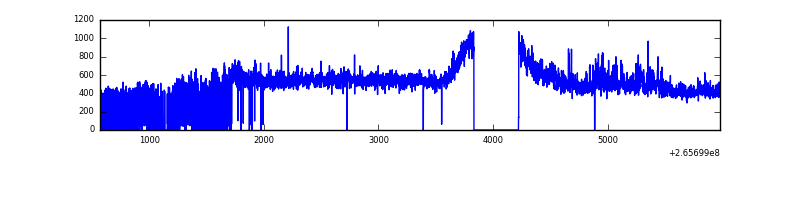 |
| D | 5409 | 4608 | 36 | 36 | 0.67% | 0.78% | 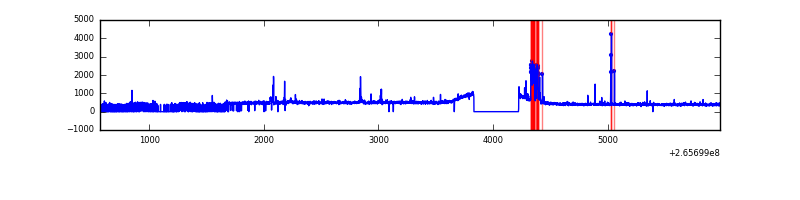 |
Top three noisy pixels from each quadrant. If the there are fewer than three noisy pixels in the level2.evt file, extra rows are filled as -1
| Pixel properties | Quadrant properties | ||||||
|---|---|---|---|---|---|---|---|
| Quadrant | DetID | PixID | Counts | Sigma | Mean | Median | Sigma |
| A | 4 | 2 | 150006 | 1306.91 | 545 | 532 | 114.4 |
| A | 0 | 23 | 117308 | 1021.02 | 545 | 532 | 114.4 |
| A | 8 | 15 | 16612 | 140.59 | 545 | 532 | 114.4 |
| B | 4 | 142 | 68118 | 630.64 | 545 | 532 | 107.2 |
| B | 0 | 189 | 28065 | 256.91 | 545 | 532 | 107.2 |
| B | 0 | 190 | 18861 | 171.03 | 545 | 532 | 107.2 |
| C | 3 | 233 | 164813 | 1316.43 | 534 | 535 | 124.8 |
| C | 0 | 207 | 107098 | 853.93 | 534 | 535 | 124.8 |
| C | 8 | 128 | 4190 | 29.29 | 534 | 535 | 124.8 |
| D | 10 | 199 | 130380 | 960.73 | 532 | 519 | 135.2 |
| D | 15 | 0 | 29796 | 216.6 | 532 | 519 | 135.2 |
| D | 2 | 234 | 17976 | 129.15 | 532 | 519 | 135.2 |
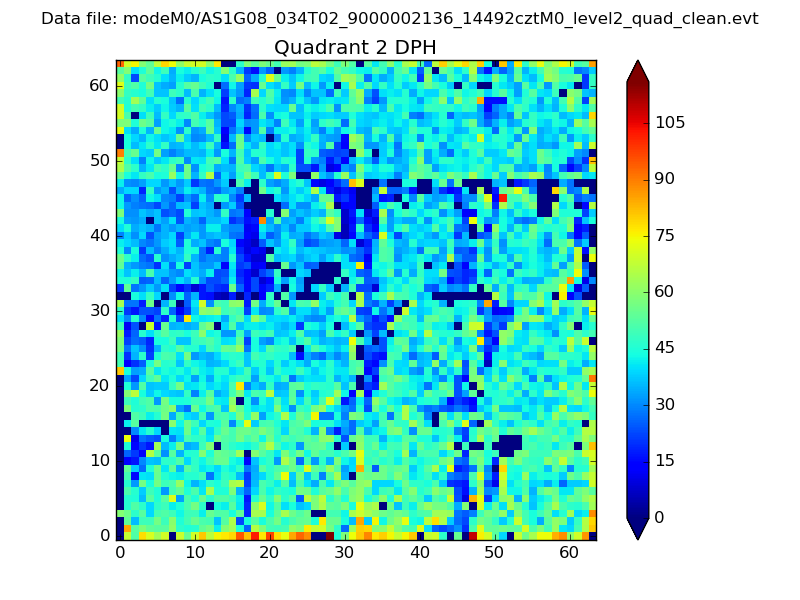
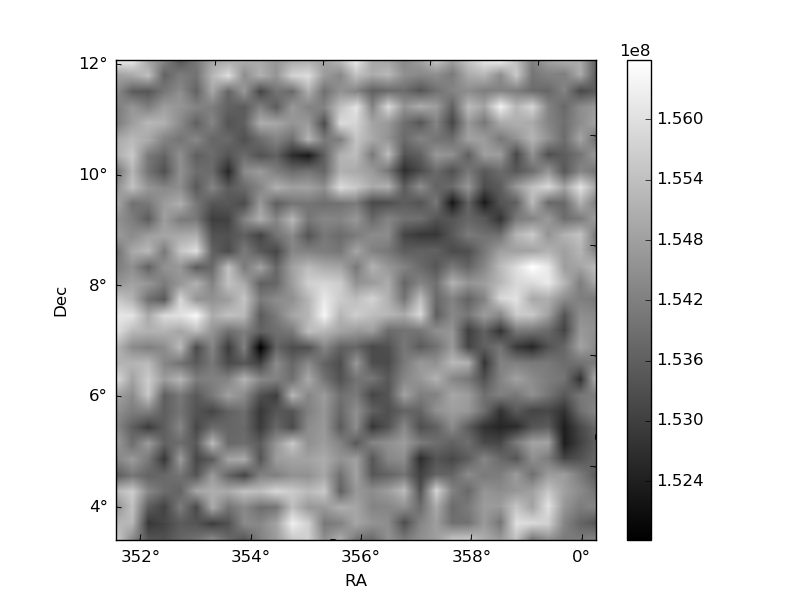
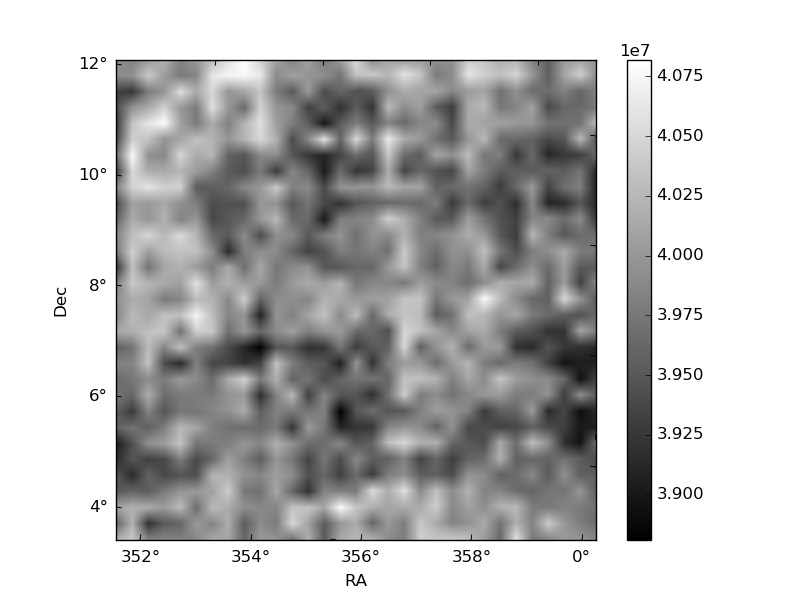
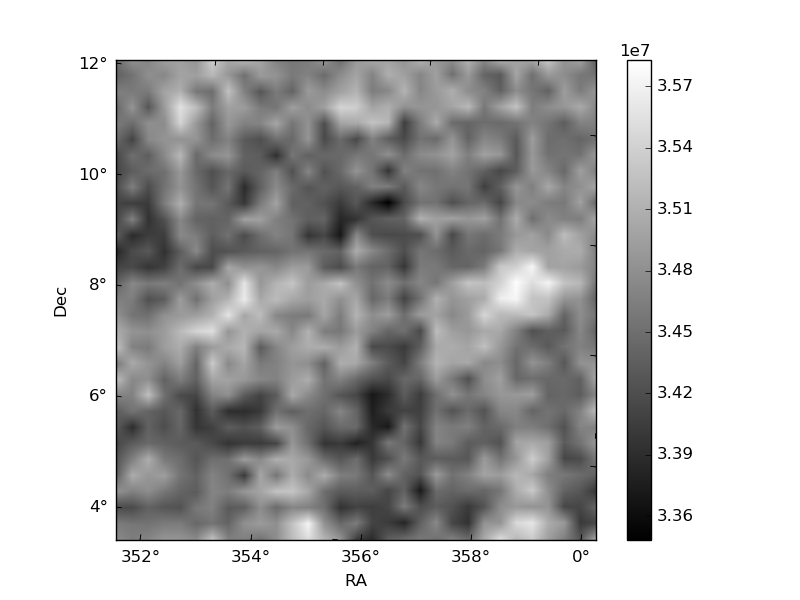
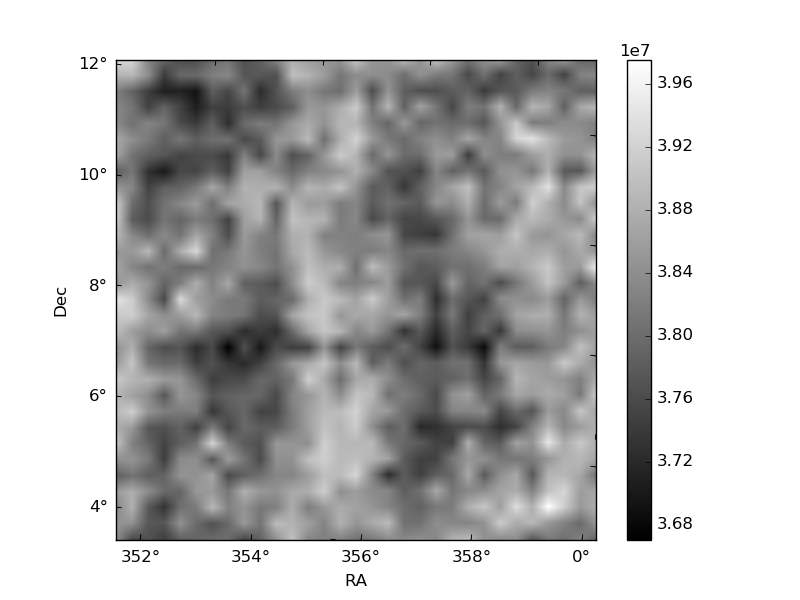
Histogram calculated using DETX and DETY for each event in the final _common_clean file
| Quadrant A | 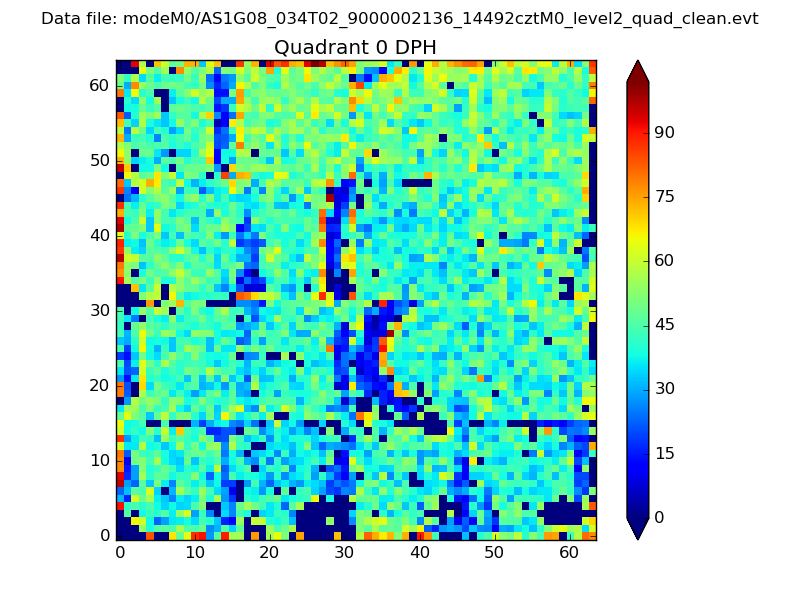 |
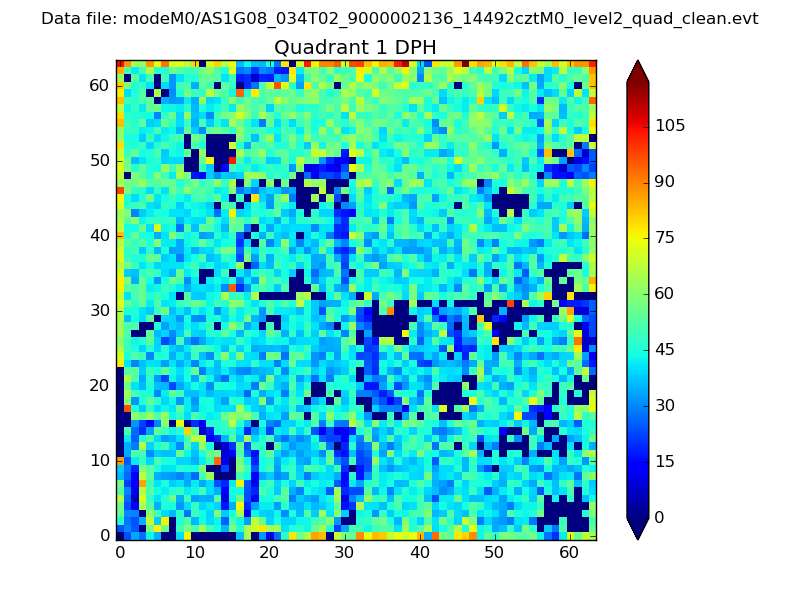 |
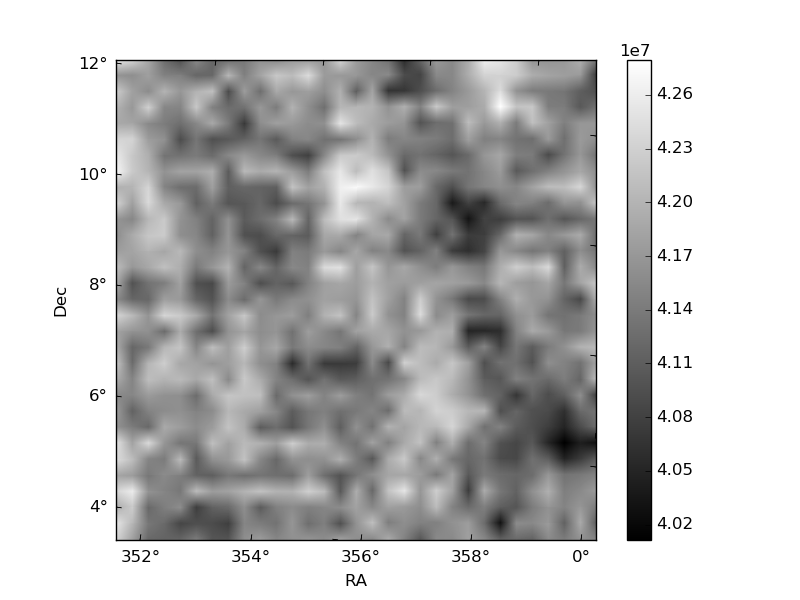
Quadrant B |
|---|---|---|---|
| Quadrant D | 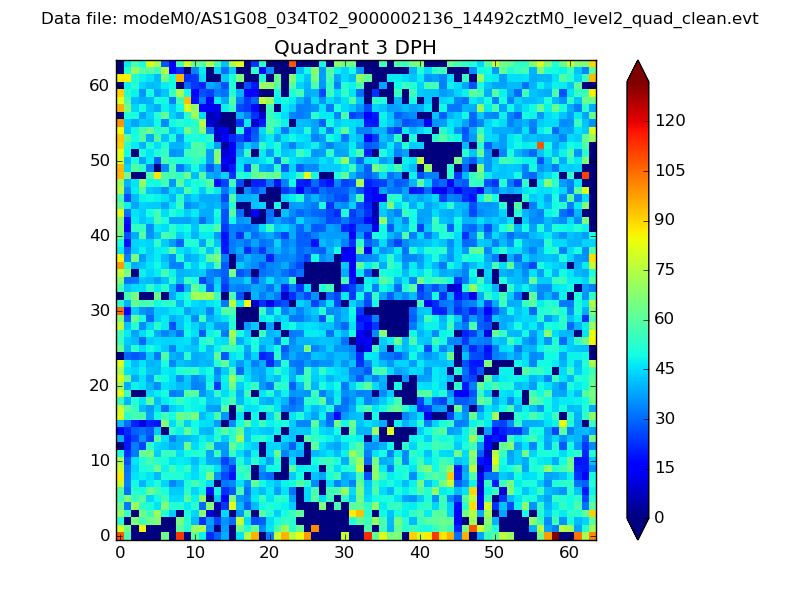 |
 |
Quadrant C |
| Plot type | Count rate plots | Images |
|---|---|---|
| Comparison with Poisson distribution Blue bars denote a histogram of data divided into 1 sec bins. Red curve is a Poisson curve with rate = median count rate of data. |
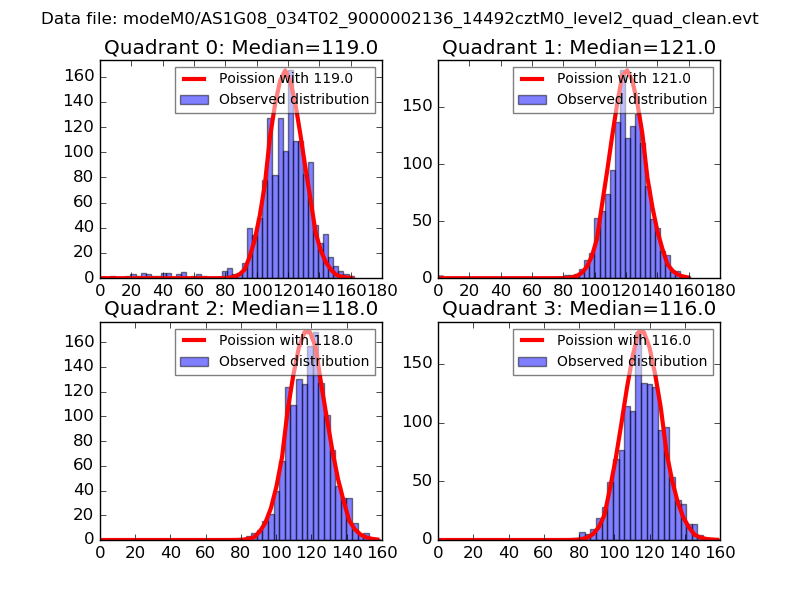 |
 |
| Quadrant-wise count rates Data is divided into 100 sec bins |
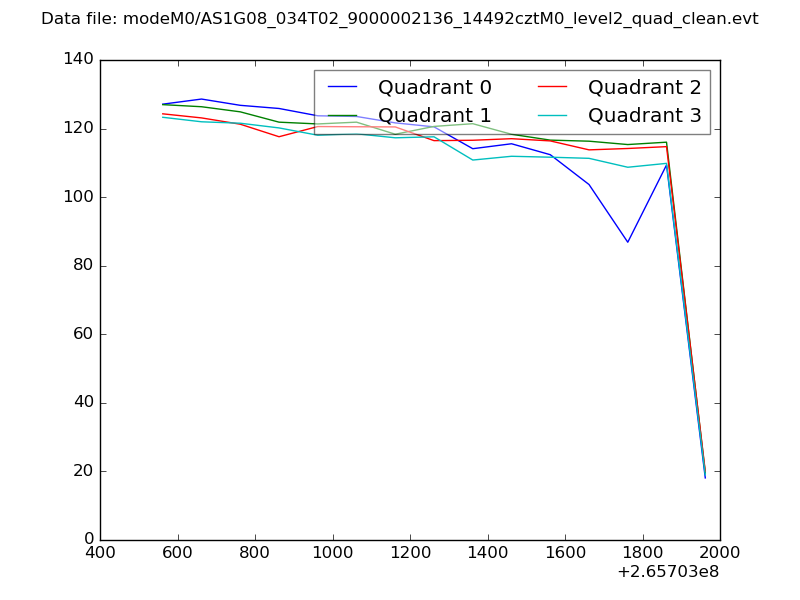 |
|
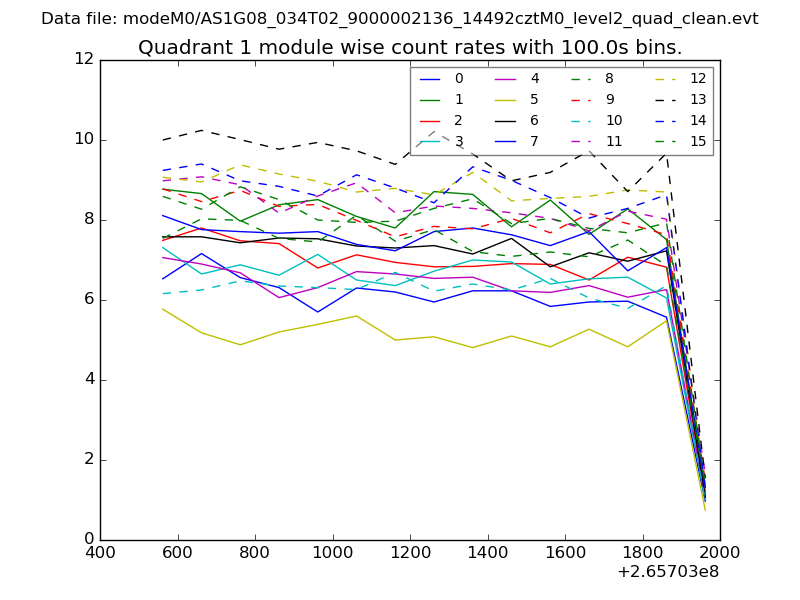
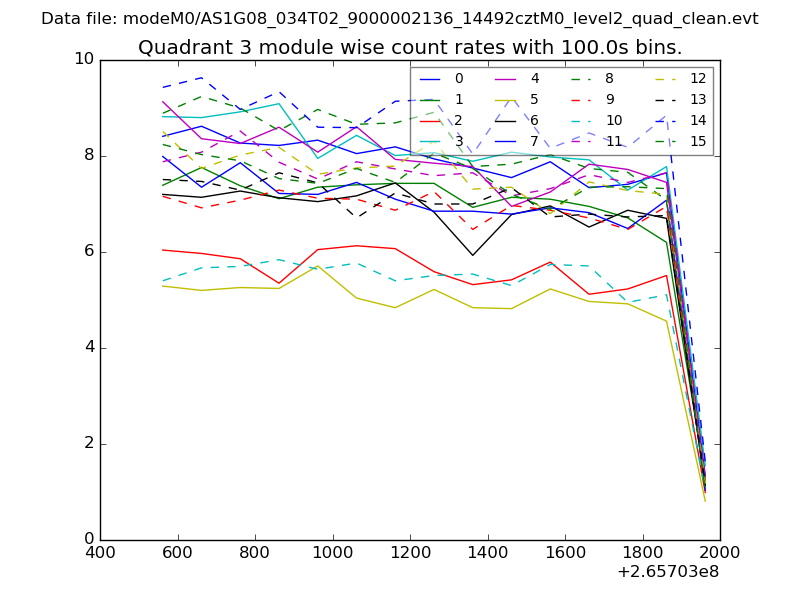
| Module-wise count rates for Quadrant A Data is divided into 100 sec bins |
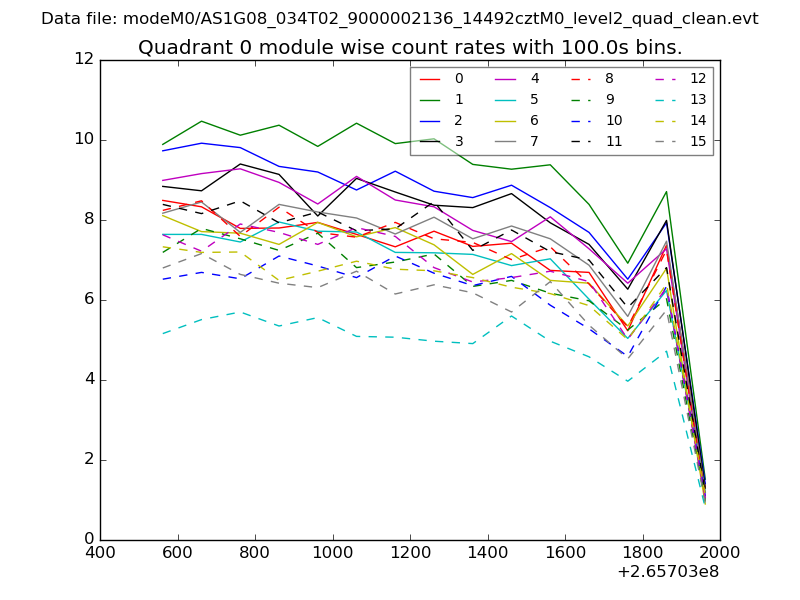 |
 |
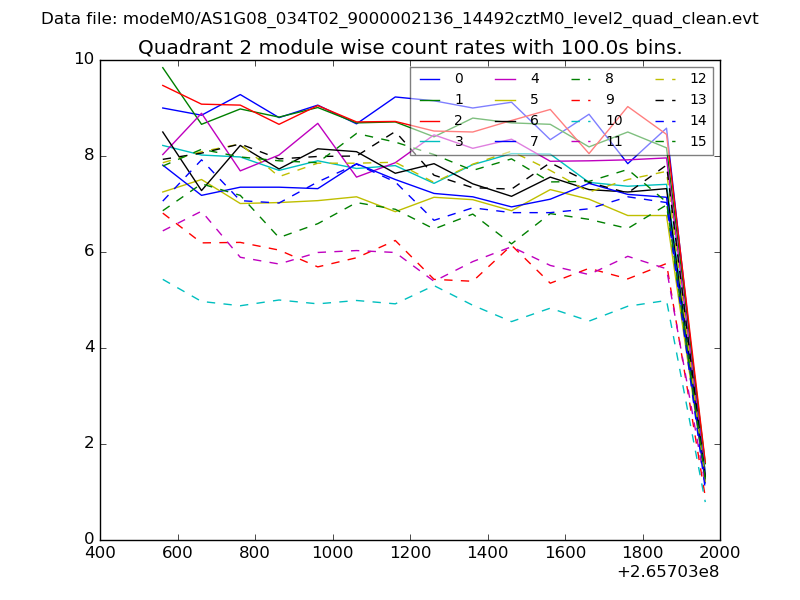
| Module-wise count rates for Quadrant B Data is divided into 100 sec bins |
 |
 |
| Module-wise count rates for Quadrant C Data is divided into 100 sec bins |
 |
 |
| Module-wise count rates for Quadrant D Data is divided into 100 sec bins |
 |
 |
| Parameter | Plot |
|---|---|
| CZT HV Monitor | 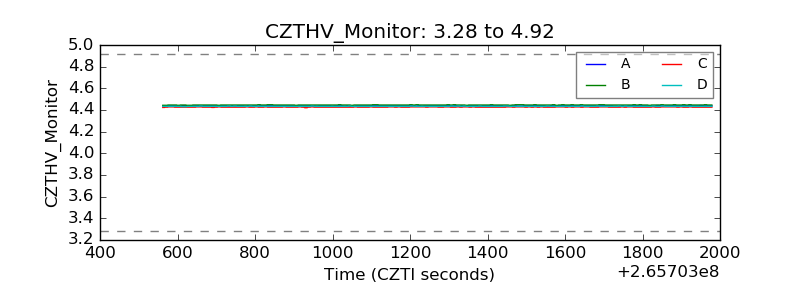 |
| D_VDD | 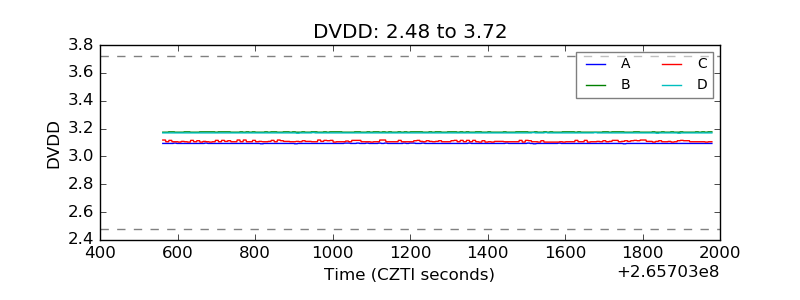 |
| Temperature 1 | 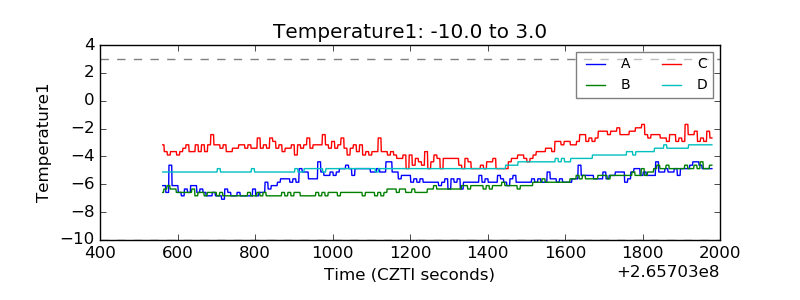 |
| Veto HV Monitor | 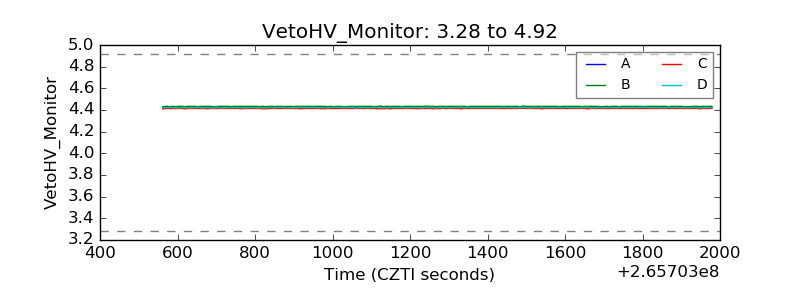 |
| Veto LLD | 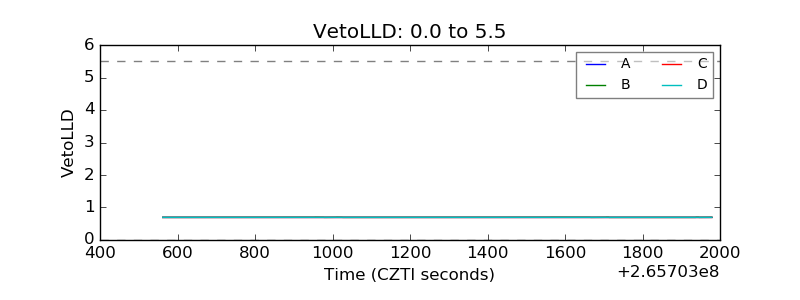 |
| Alpha Counter | 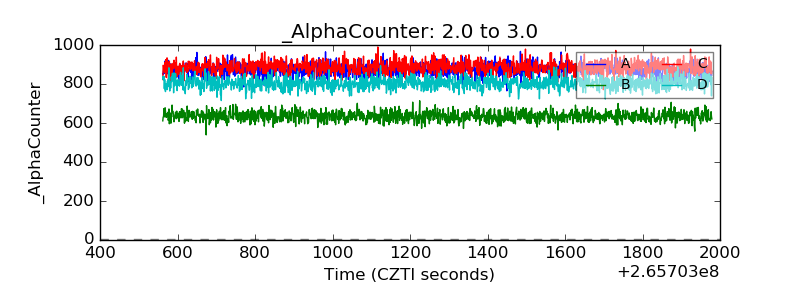 |
| _CPM_Rate | 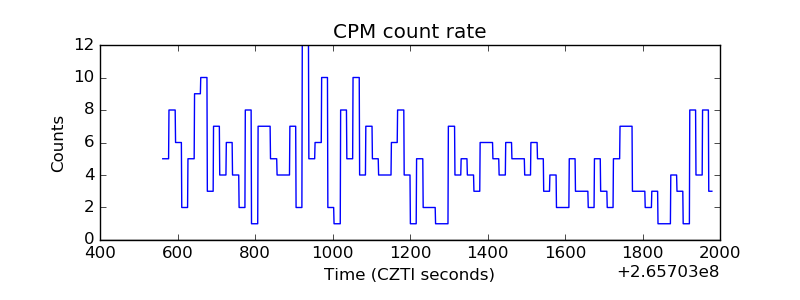 |
| CZT Counter | 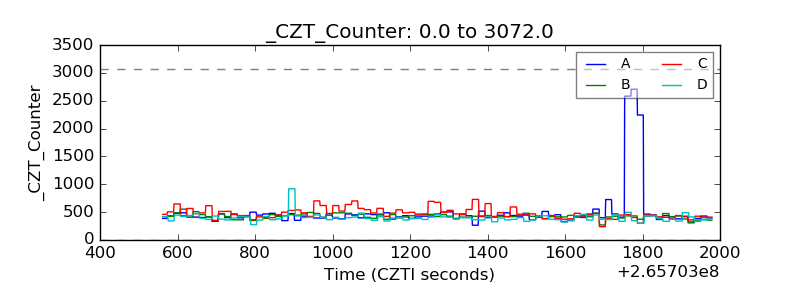 |
| +2.5 Volts monitor |  |
| +5 Volts monitor |  |
| _ROLL_ROT | 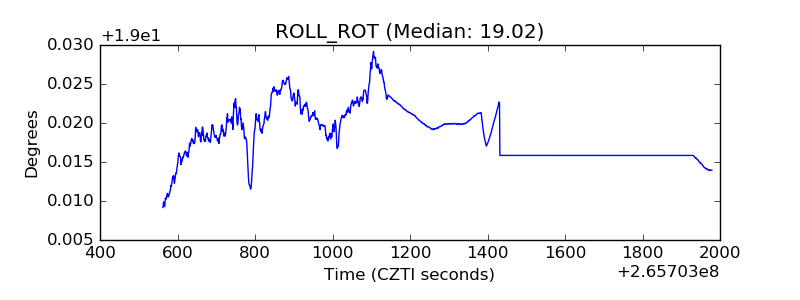 |
| _Roll_DEC | 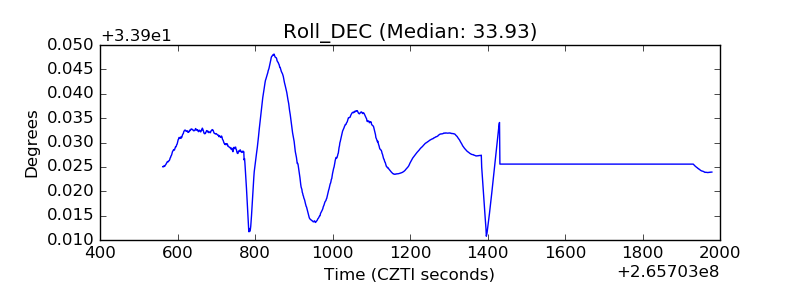 |
| _Roll_RA | 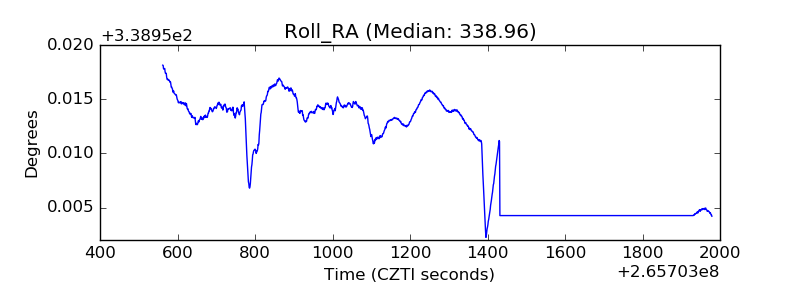 |
| Veto Counter | 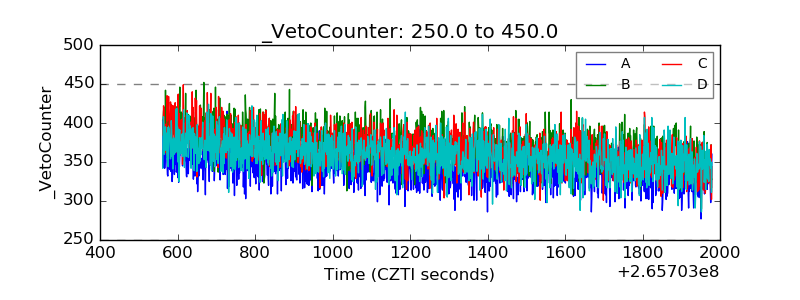 |