| Param | Original file | Final file |
|---|---|---|
| Filename | modeM0/AS1G08_034T02_9000002136_14494cztM0_level2.evt | modeM0/AS1G08_034T02_9000002136_14494cztM0_level2_quad_clean.evt |
| Size (bytes) | 566,357,760 | 84,029,760 |
| Size | 540.1 MB | 80.1 MB |
| Events in quadrant A | 5,004,423 | 484,897 |
| Events in quadrant B | 3,820,167 | 544,527 |
| Events in quadrant C | 3,377,321 | 541,832 |
| Events in quadrant D | 4,481,682 | 491,418 |
| Mode M0 | |||
|---|---|---|---|
| Quadrant | BADHDUFLAG | Total packets | Discarded packets |
| A | 0 | 19364 | 2 |
| B | 0 | 15844 | 1 |
| C | 0 | 14359 | 1 |
| D | 0 | 18126 | 1 |
| Mode SS | |||
|---|---|---|---|
| Quadrant | BADHDUFLAG | Total packets | Discarded packets |
| A | 0 | 142 | 0 |
| B | 0 | 142 | 0 |
| C | 0 | 142 | 0 |
| D | 0 | 142 | 0 |
| Mode M9 | |||
|---|---|---|---|
| Quadrant | BADHDUFLAG | Total packets | Discarded packets |
| A | 0 | 2 | 0 |
| B | 0 | 2 | 0 |
| C | 0 | 2 | 0 |
| D | 0 | 2 | 0 |
| Quadrant | Total seconds | Saturated seconds | Saturation percentage |
|---|---|---|---|
| A | 6907 | 795 | 11.510062% |
| B | 6907 | 264 | 3.822209% |
| C | 6907 | 94 | 1.360938% |
| D | 6907 | 638 | 9.237006% |
Noise dominated data is calculated using 1-second bins in cleaned event files. If a bin has >2000 counts, and if more than 50% of those come from <1% of pixels, then it is considered to be noise-dominated and hence unusable.
| Quadrant | # 1 sec bins | Bins with >0 counts | Bins with >2000 counts | High rate bins dominated by noise | Noise dominated (total time) | Noise dominated (detector-on time) | Marked lightcurve |
|---|---|---|---|---|---|---|---|
| A | 7118 | 6910 | 572 | 572 | 8.04% | 8.28% | 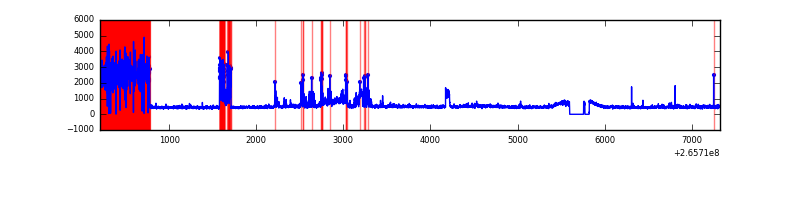 |
| B | 7118 | 6910 | 68 | 68 | 0.96% | 0.98% | 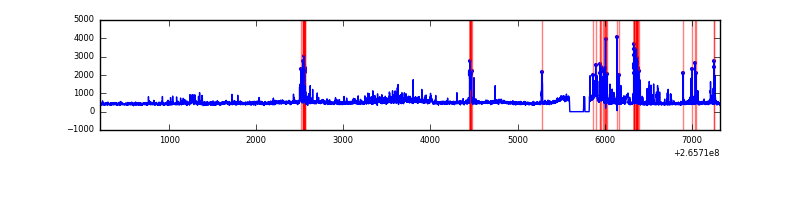 |
| C | 7118 | 6910 | 0 | 0 | 0.00% | 0.00% | 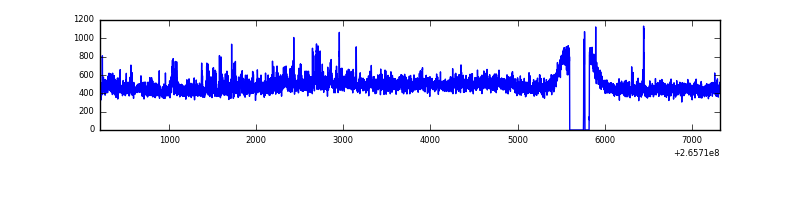 |
| D | 7118 | 6909 | 346 | 346 | 4.86% | 5.01% | 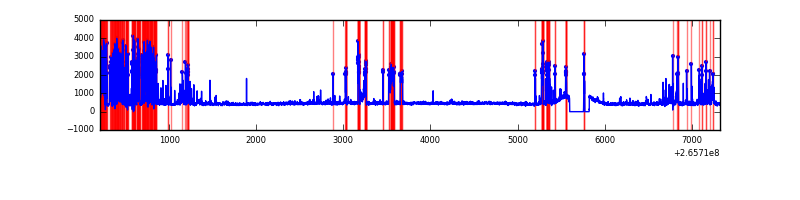 |
Top three noisy pixels from each quadrant. If the there are fewer than three noisy pixels in the level2.evt file, extra rows are filled as -1
| Pixel properties | Quadrant properties | ||||||
|---|---|---|---|---|---|---|---|
| Quadrant | DetID | PixID | Counts | Sigma | Mean | Median | Sigma |
| A | 0 | 23 | 1528375 | 9846.02 | 760 | 743 | 155.2 |
| A | 12 | 189 | 199709 | 1282.39 | 760 | 743 | 155.2 |
| A | 4 | 2 | 173101 | 1110.9 | 760 | 743 | 155.2 |
| B | 10 | 245 | 274741 | 1739.19 | 811 | 789 | 157.5 |
| B | 0 | 189 | 94842 | 597.1 | 811 | 789 | 157.5 |
| B | 0 | 85 | 79740 | 501.22 | 811 | 789 | 157.5 |
| C | 3 | 233 | 203369 | 1105.52 | 790 | 792 | 183.2 |
| C | 0 | 207 | 68772 | 370.99 | 790 | 792 | 183.2 |
| C | 8 | 128 | 11924 | 60.75 | 790 | 792 | 183.2 |
| D | 10 | 199 | 1230617 | 6496.76 | 754 | 735 | 189.3 |
| D | 12 | 110 | 263626 | 1388.7 | 754 | 735 | 189.3 |
| D | 10 | 70 | 55832 | 291.05 | 754 | 735 | 189.3 |
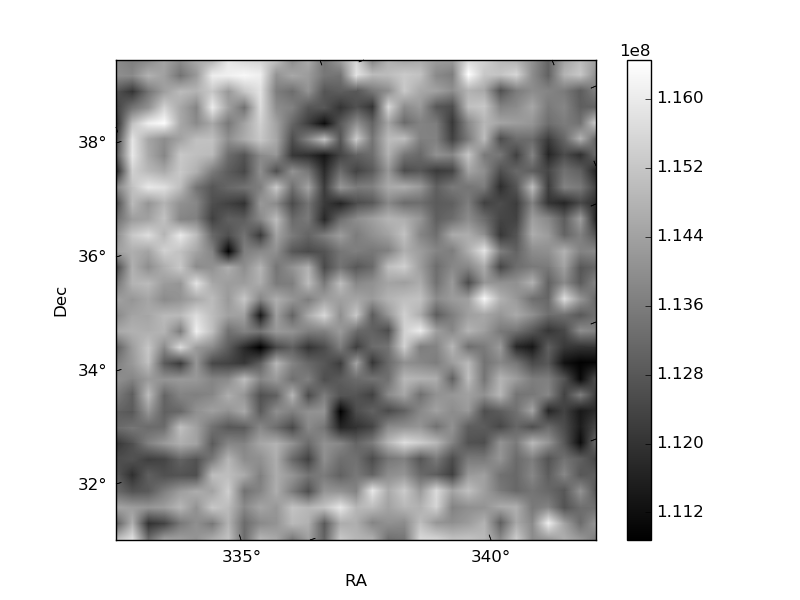
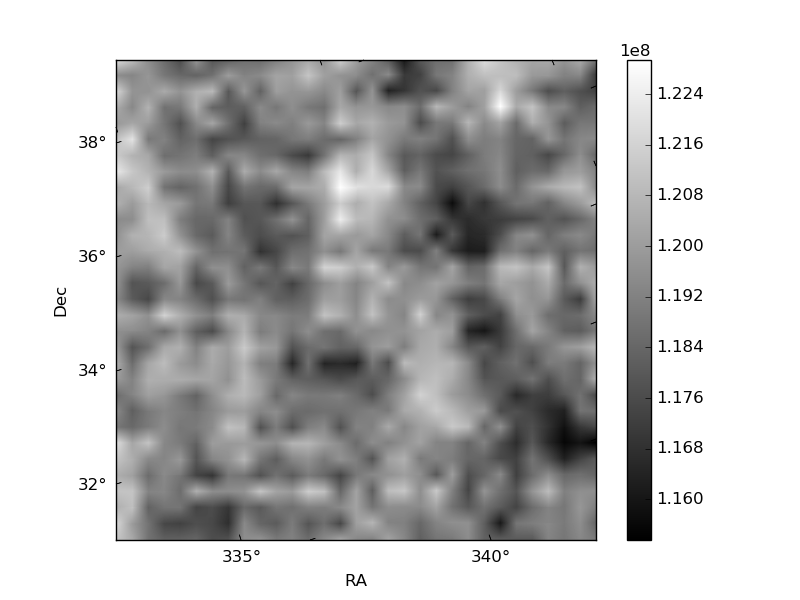
Histogram calculated using DETX and DETY for each event in the final _common_clean file
| Quadrant A | 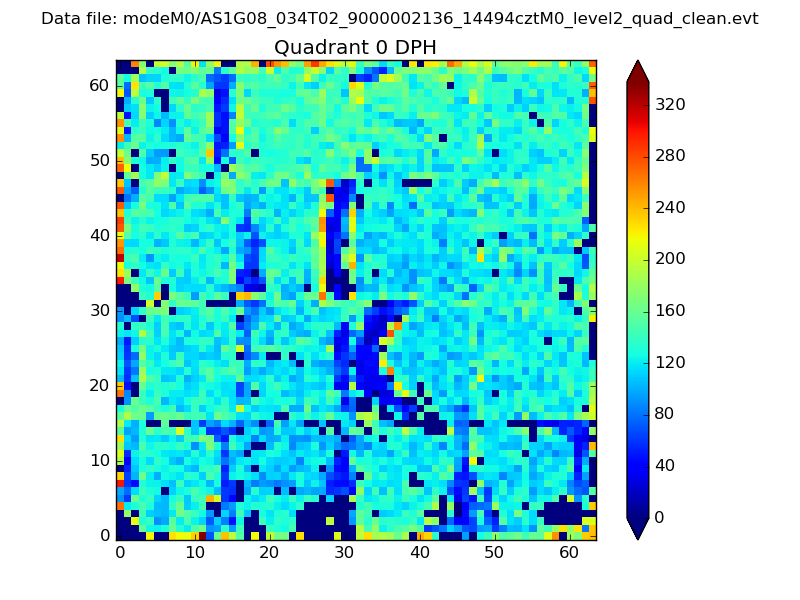 |
 |
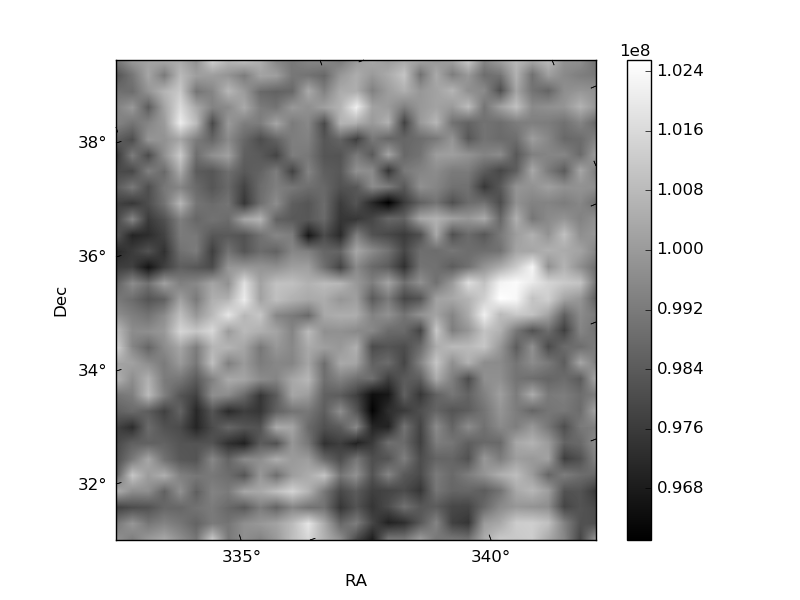
Quadrant B |
|---|---|---|---|
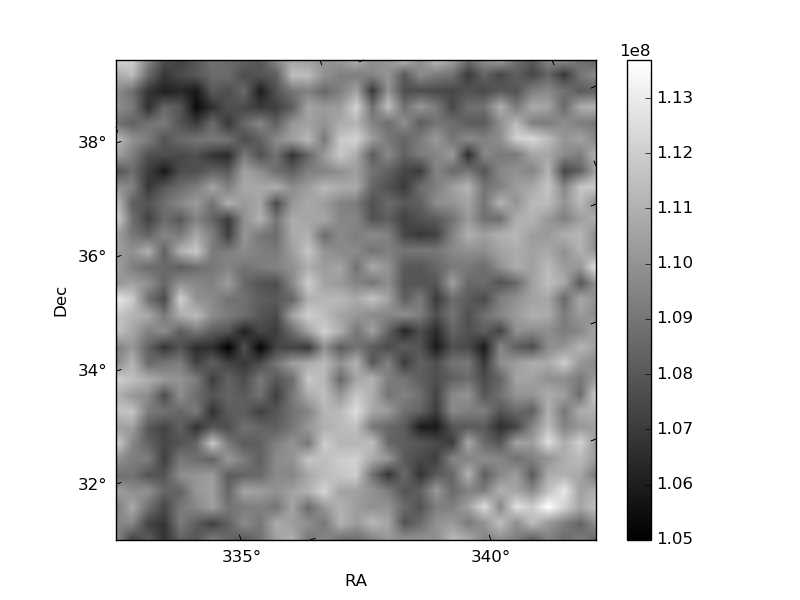
| Quadrant D | 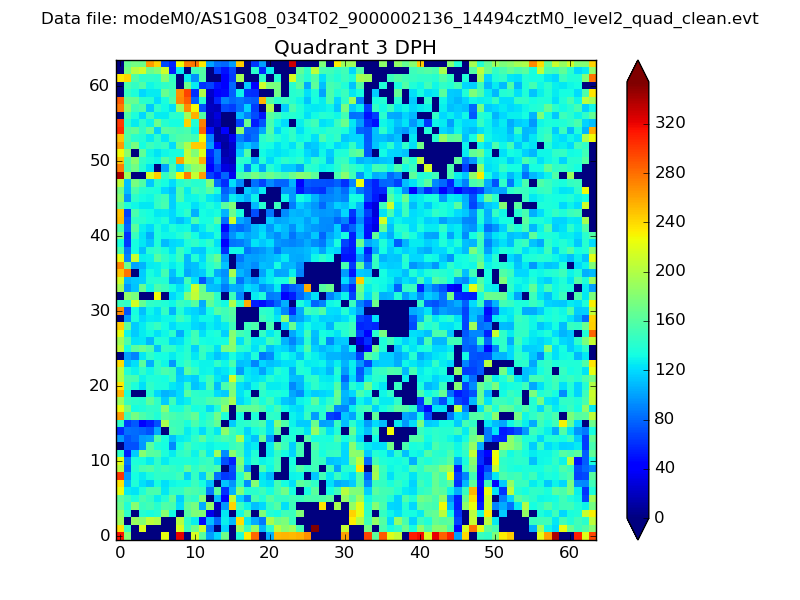 |
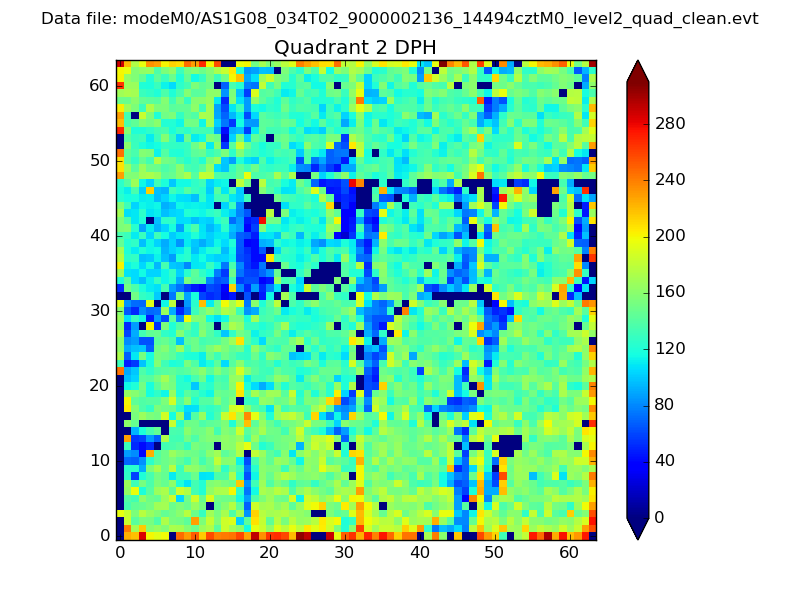 |
Quadrant C |
| Plot type | Count rate plots | Images |
|---|---|---|
| Comparison with Poisson distribution Blue bars denote a histogram of data divided into 1 sec bins. Red curve is a Poisson curve with rate = median count rate of data. |
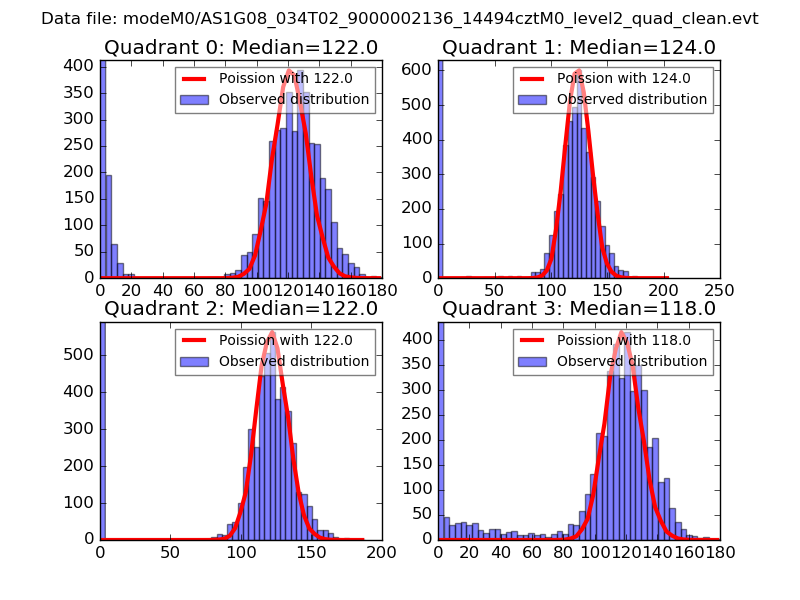 |
 |
| Quadrant-wise count rates Data is divided into 100 sec bins |
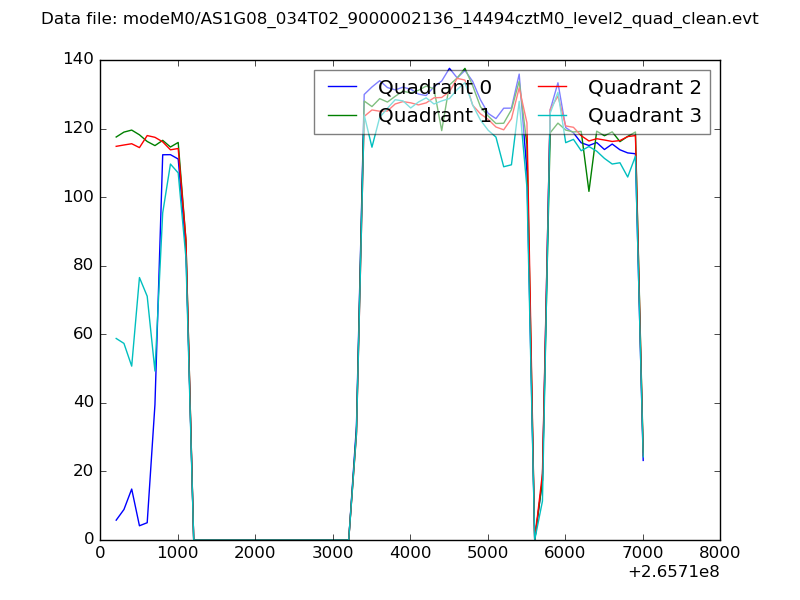 |
|
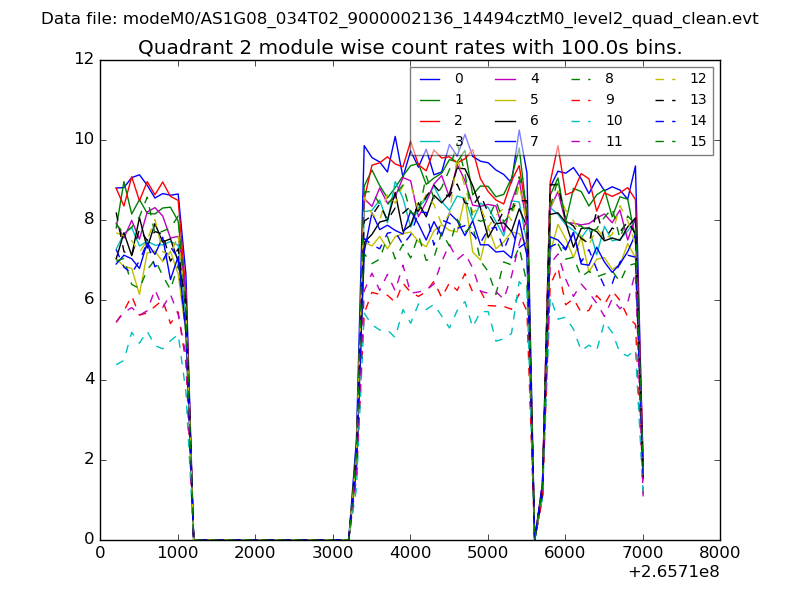
| Module-wise count rates for Quadrant A Data is divided into 100 sec bins |
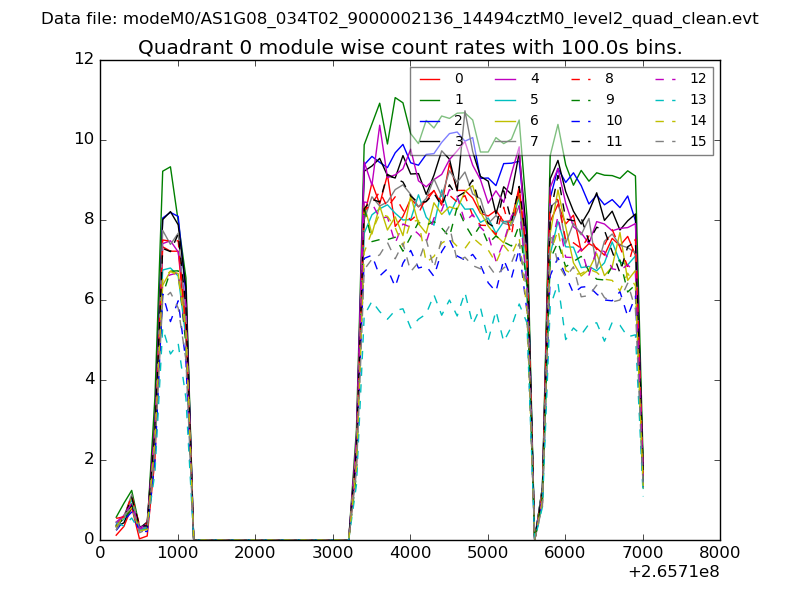 |
 |
| Module-wise count rates for Quadrant B Data is divided into 100 sec bins |
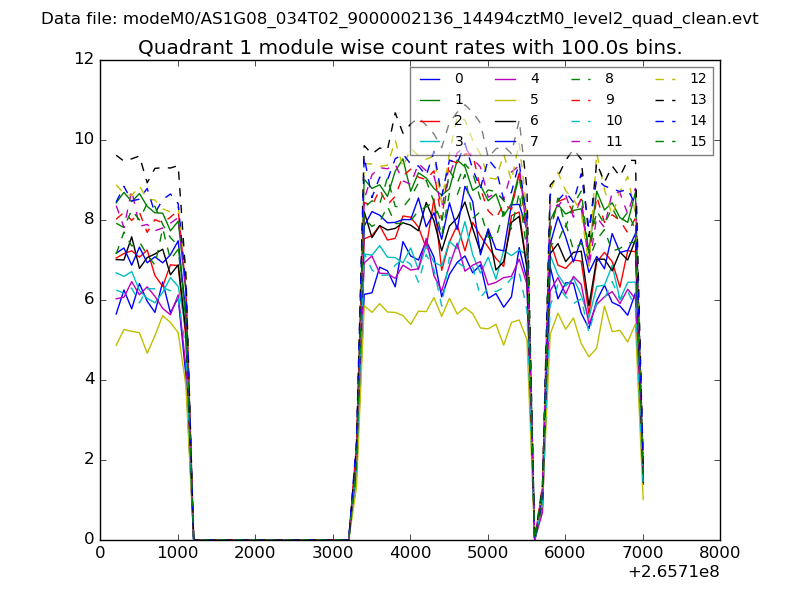 |
 |
| Module-wise count rates for Quadrant C Data is divided into 100 sec bins |
 |
 |
| Module-wise count rates for Quadrant D Data is divided into 100 sec bins |
 |
 |
| Parameter | Plot |
|---|---|
| CZT HV Monitor |  |
| D_VDD | 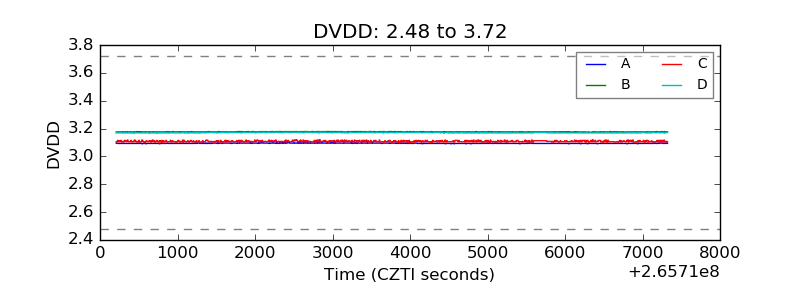 |
| Temperature 1 | 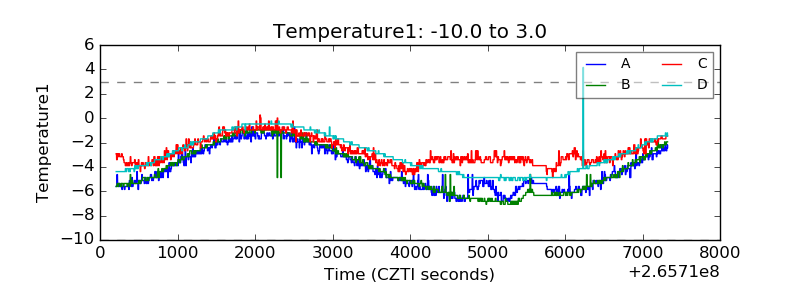 |
| Veto HV Monitor | 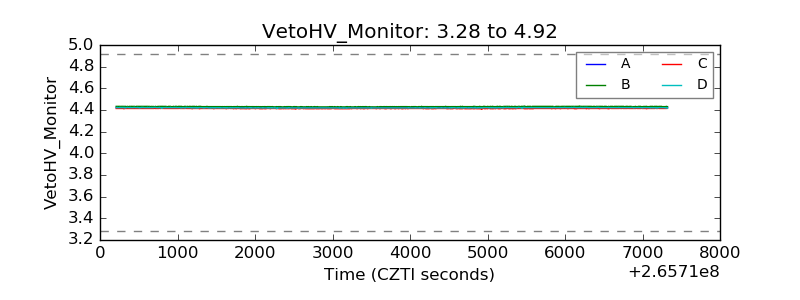 |
| Veto LLD | 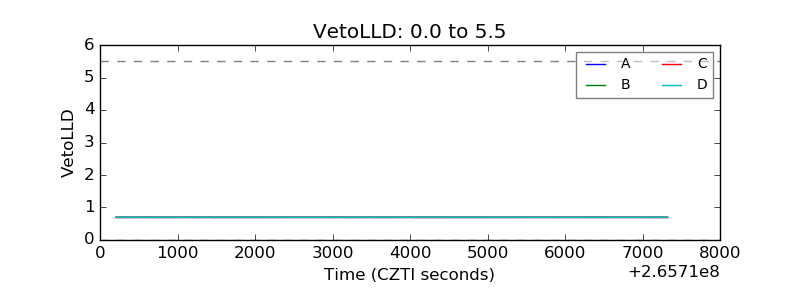 |
| Alpha Counter | 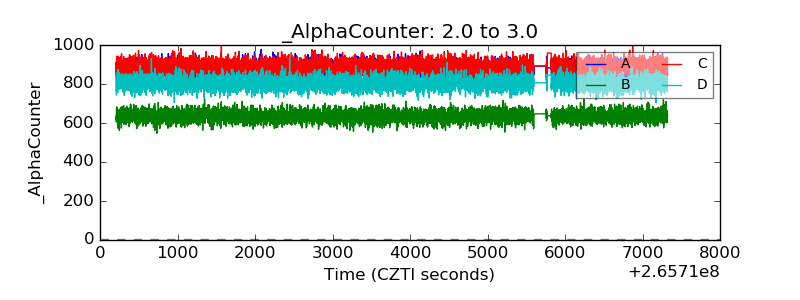 |
| _CPM_Rate | 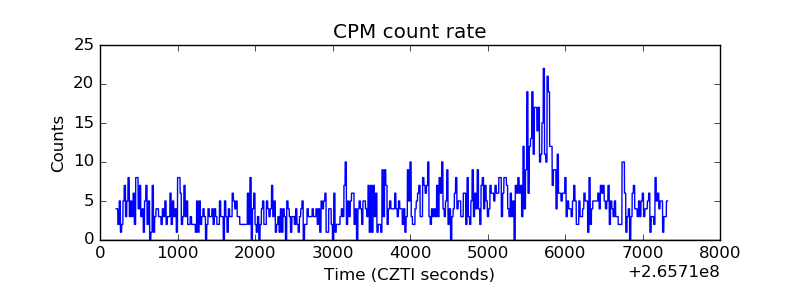 |
| CZT Counter |  |
| +2.5 Volts monitor |  |
| +5 Volts monitor |  |
| _ROLL_ROT |  |
| _Roll_DEC | 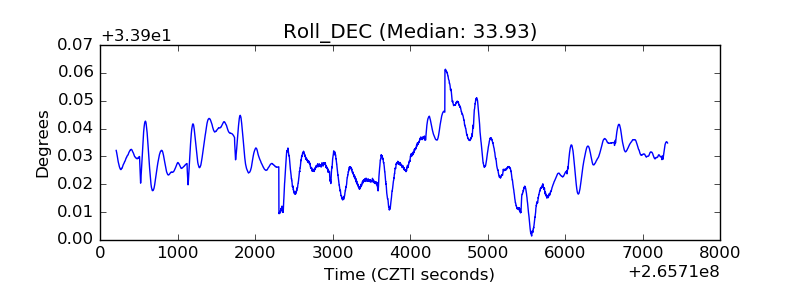 |
| _Roll_RA | 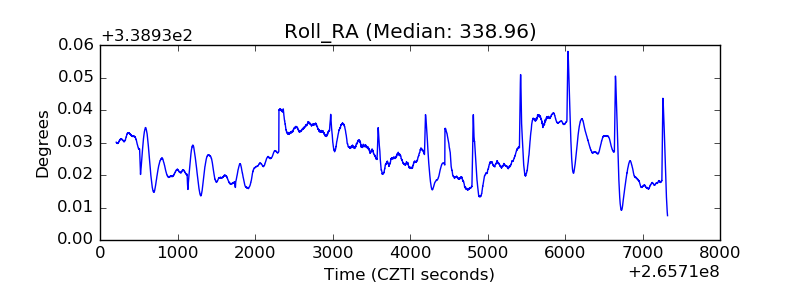 |
| Veto Counter | 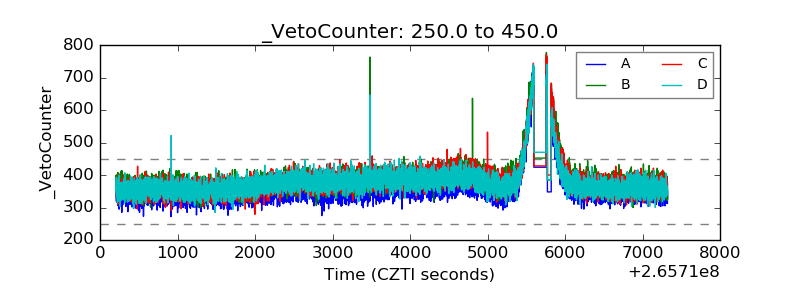 |