| Param | Original file | Final file |
|---|---|---|
| Filename | modeM0/AS1G08_034T02_9000002136_14497cztM0_level2.evt | modeM0/AS1G08_034T02_9000002136_14497cztM0_level2_quad_clean.evt |
| Size (bytes) | 676,739,520 | 109,209,600 |
| Size | 645.4 MB | 104.2 MB |
| Events in quadrant A | 4,718,691 | 668,812 |
| Events in quadrant B | 5,280,145 | 662,972 |
| Events in quadrant C | 4,785,313 | 656,578 |
| Events in quadrant D | 5,050,112 | 642,804 |
| Mode M0 | |||
|---|---|---|---|
| Quadrant | BADHDUFLAG | Total packets | Discarded packets |
| A | 0 | 20183 | 2 |
| B | 0 | 21804 | 2 |
| C | 0 | 20105 | 2 |
| D | 0 | 21796 | 2 |
| Mode SS | |||
|---|---|---|---|
| Quadrant | BADHDUFLAG | Total packets | Discarded packets |
| A | 0 | 196 | 0 |
| B | 0 | 196 | 0 |
| C | 0 | 196 | 0 |
| D | 0 | 196 | 0 |
| Mode M9 | |||
|---|---|---|---|
| Quadrant | BADHDUFLAG | Total packets | Discarded packets |
| A | 0 | 4 | 0 |
| B | 0 | 4 | 0 |
| C | 0 | 4 | 0 |
| D | 0 | 4 | 0 |
| Quadrant | Total seconds | Saturated seconds | Saturation percentage |
|---|---|---|---|
| A | 9753 | 137 | 1.404696% |
| B | 9753 | 236 | 2.419768% |
| C | 9753 | 101 | 1.035579% |
| D | 9753 | 212 | 2.173690% |
Noise dominated data is calculated using 1-second bins in cleaned event files. If a bin has >2000 counts, and if more than 50% of those come from <1% of pixels, then it is considered to be noise-dominated and hence unusable.
| Quadrant | # 1 sec bins | Bins with >0 counts | Bins with >2000 counts | High rate bins dominated by noise | Noise dominated (total time) | Noise dominated (detector-on time) | Marked lightcurve |
|---|---|---|---|---|---|---|---|
| A | 10154 | 9755 | 3 | 3 | 0.03% | 0.03% | 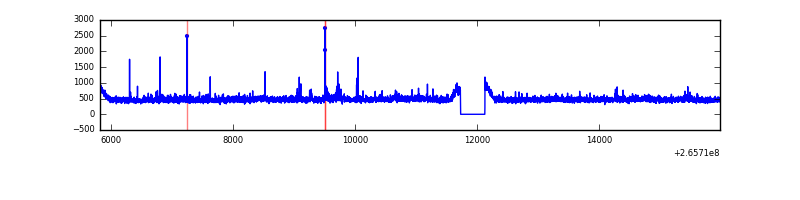 |
| B | 10154 | 9755 | 56 | 56 | 0.55% | 0.57% | 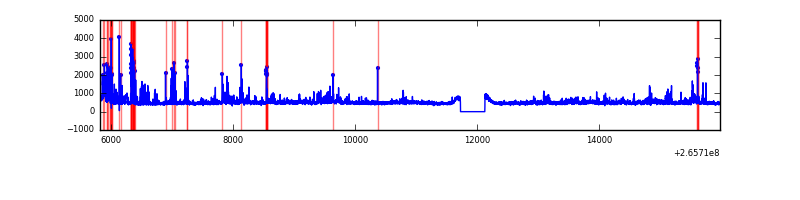 |
| C | 10154 | 9755 | 0 | 0 | 0.00% | 0.00% | 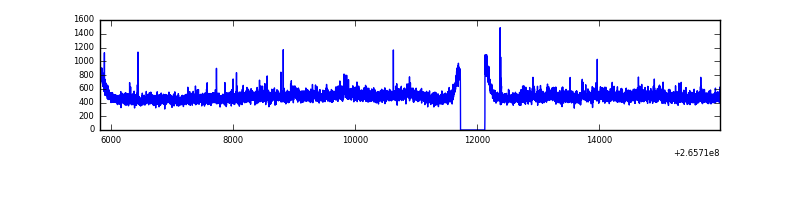 |
| D | 10154 | 9755 | 99 | 99 | 0.97% | 1.01% | 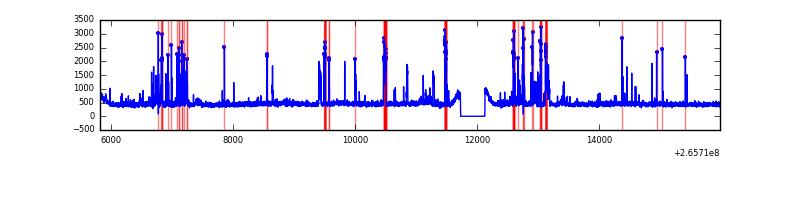 |
Top three noisy pixels from each quadrant. If the there are fewer than three noisy pixels in the level2.evt file, extra rows are filled as -1
| Pixel properties | Quadrant properties | ||||||
|---|---|---|---|---|---|---|---|
| Quadrant | DetID | PixID | Counts | Sigma | Mean | Median | Sigma |
| A | 8 | 15 | 101347 | 422.18 | 1161 | 1132 | 237.4 |
| A | 12 | 189 | 100110 | 416.97 | 1161 | 1132 | 237.4 |
| A | 15 | 69 | 21408 | 85.42 | 1161 | 1132 | 237.4 |
| B | 10 | 245 | 332683 | 1492.65 | 1150 | 1118 | 222.1 |
| B | 0 | 219 | 113814 | 507.34 | 1150 | 1118 | 222.1 |
| B | 0 | 189 | 76511 | 339.41 | 1150 | 1118 | 222.1 |
| C | 3 | 233 | 344564 | 1326.4 | 1116 | 1120 | 258.9 |
| C | 0 | 207 | 62726 | 237.93 | 1116 | 1120 | 258.9 |
| C | 8 | 128 | 10567 | 36.48 | 1116 | 1120 | 258.9 |
| D | 10 | 199 | 368898 | 1333.2 | 1118 | 1086 | 275.9 |
| D | 12 | 110 | 298209 | 1076.97 | 1118 | 1086 | 275.9 |
| D | 15 | 0 | 53265 | 189.13 | 1118 | 1086 | 275.9 |
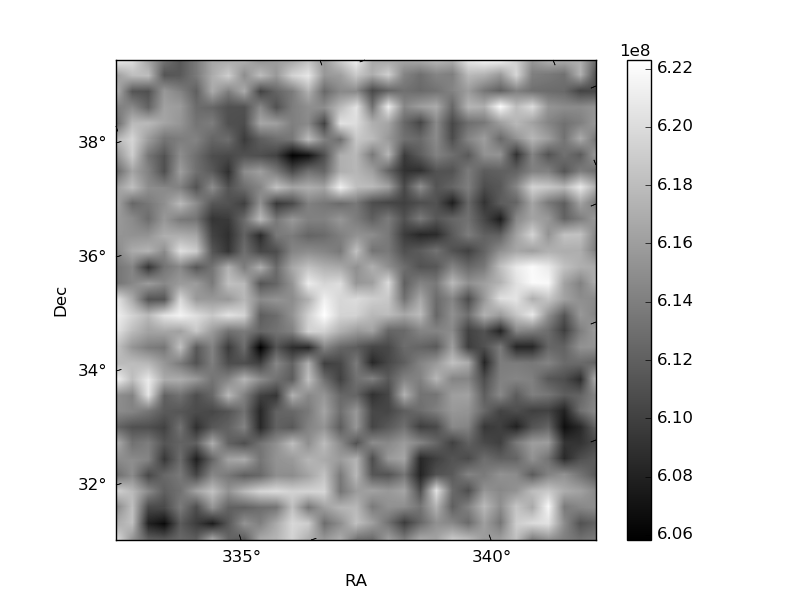
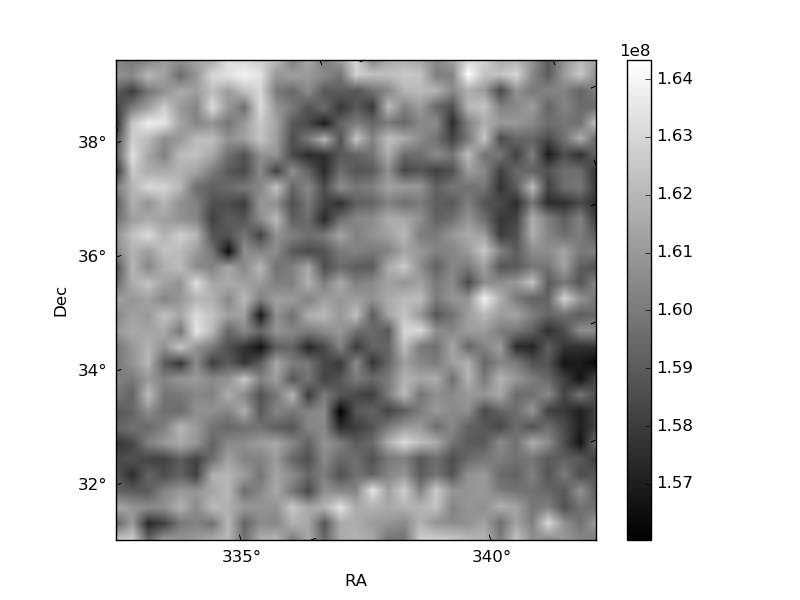
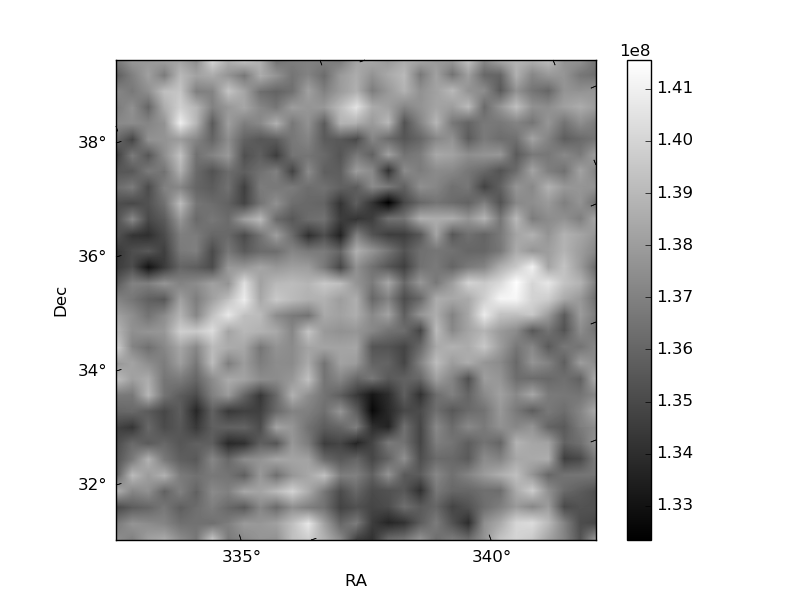
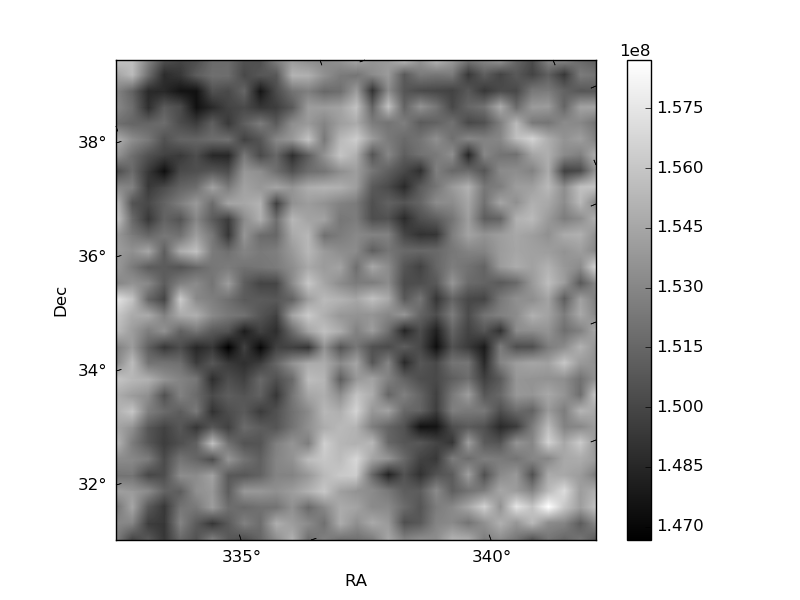
Histogram calculated using DETX and DETY for each event in the final _common_clean file
| Quadrant A | 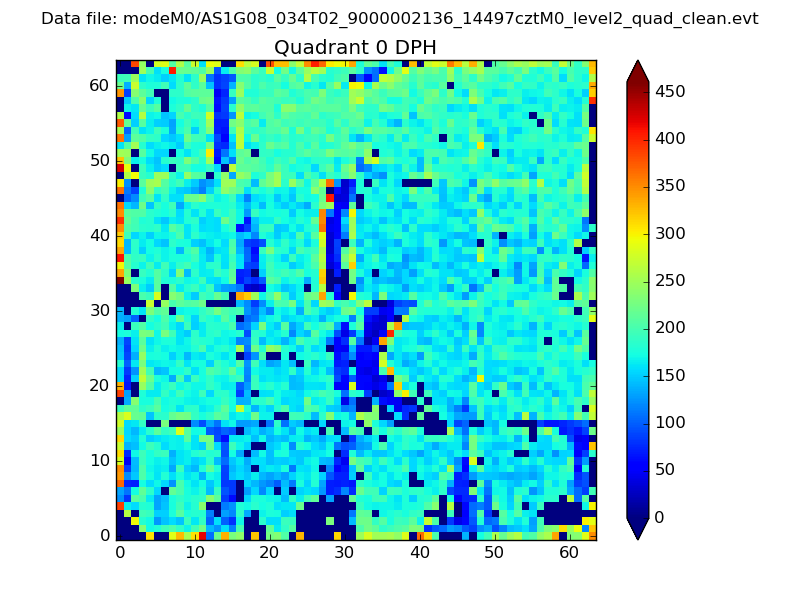 |
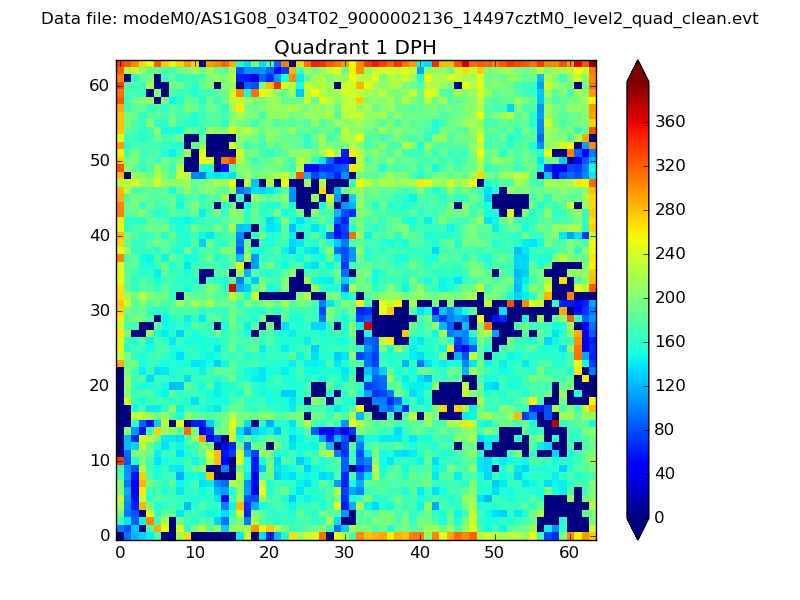 |
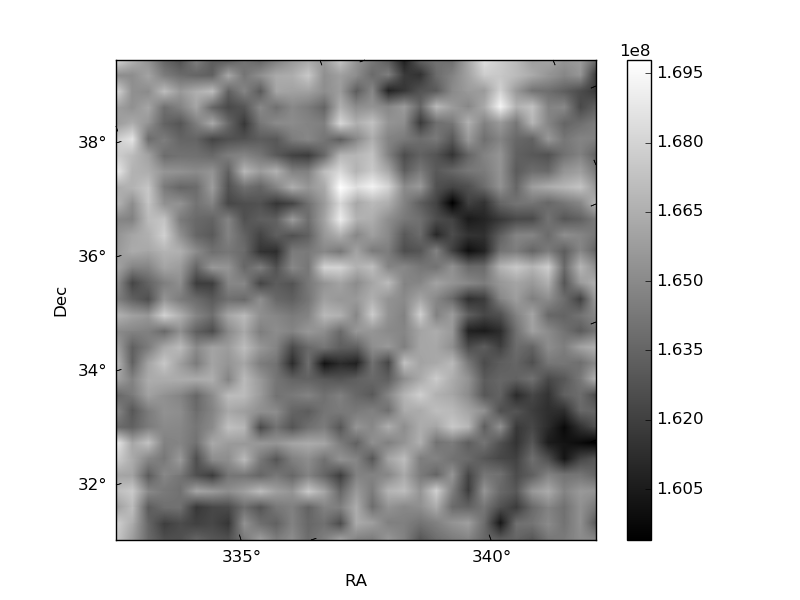
Quadrant B |
|---|---|---|---|
| Quadrant D | 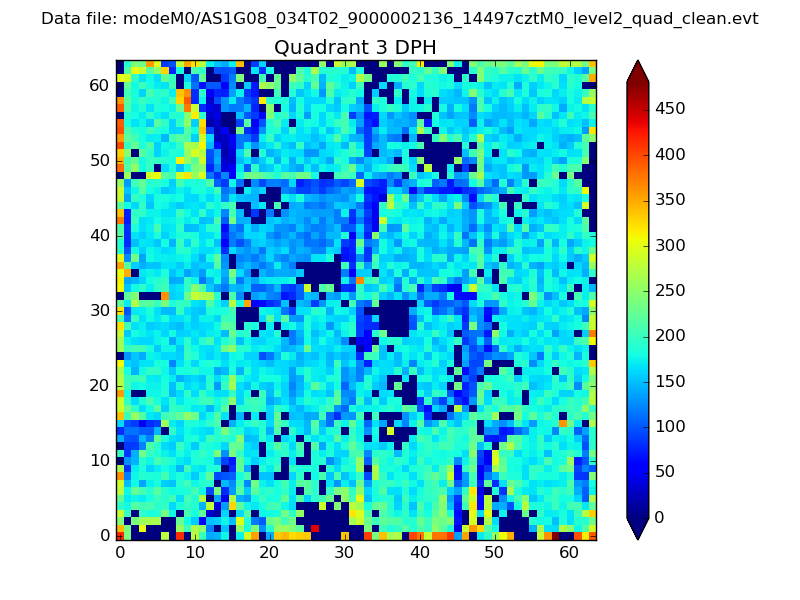 |
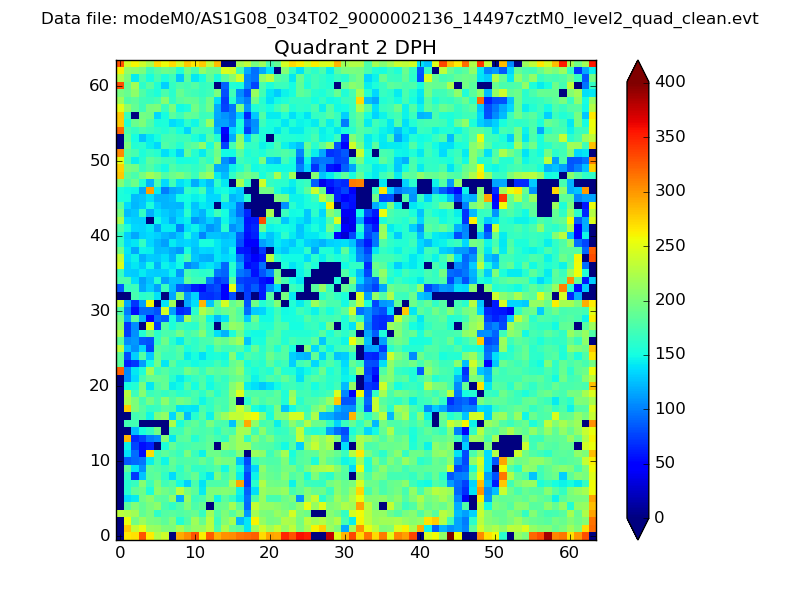 |
Quadrant C |
| Plot type | Count rate plots | Images |
|---|---|---|
| Comparison with Poisson distribution Blue bars denote a histogram of data divided into 1 sec bins. Red curve is a Poisson curve with rate = median count rate of data. |
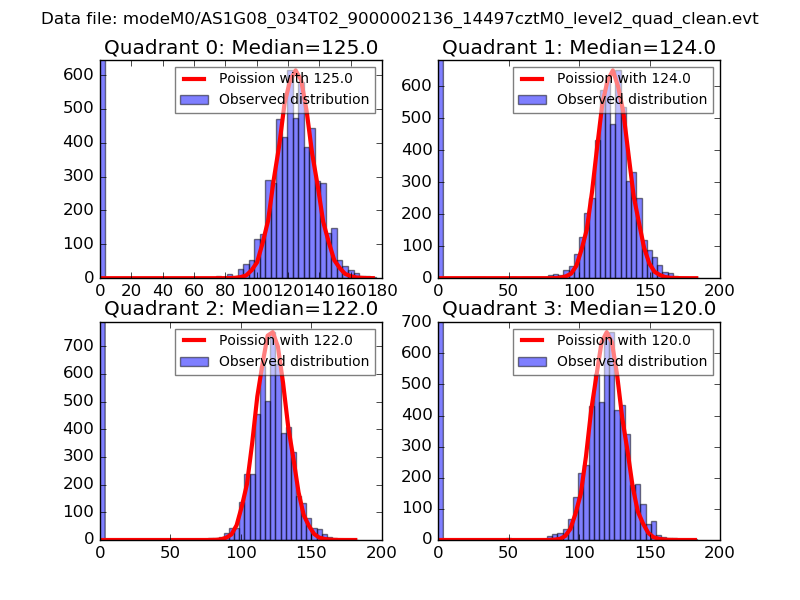 |
 |
| Quadrant-wise count rates Data is divided into 100 sec bins |
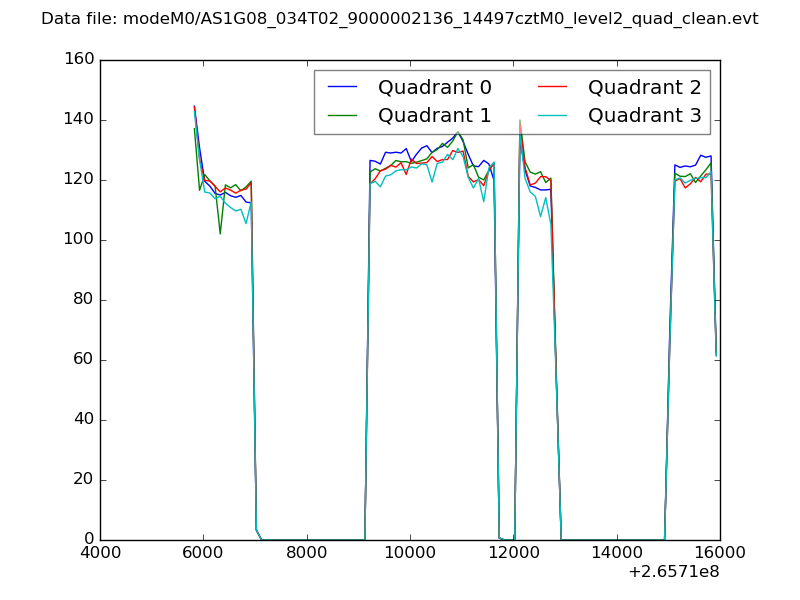 |
|
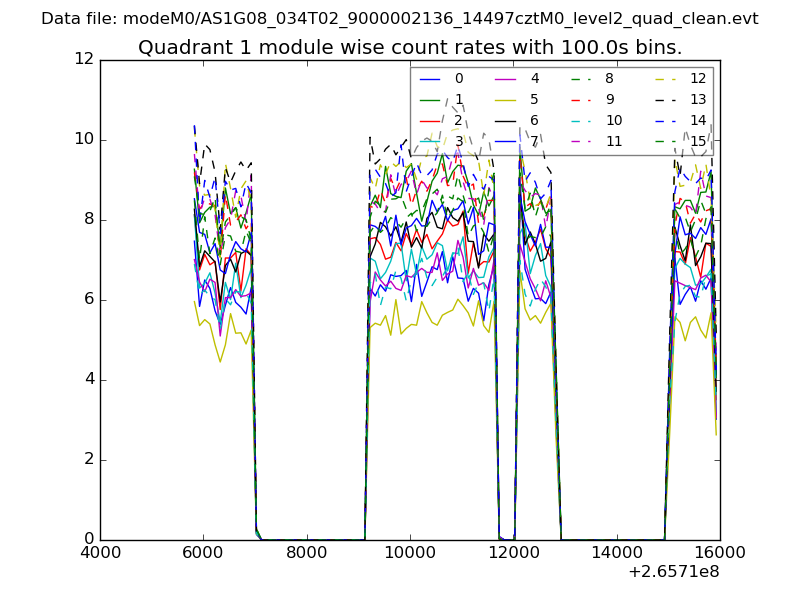
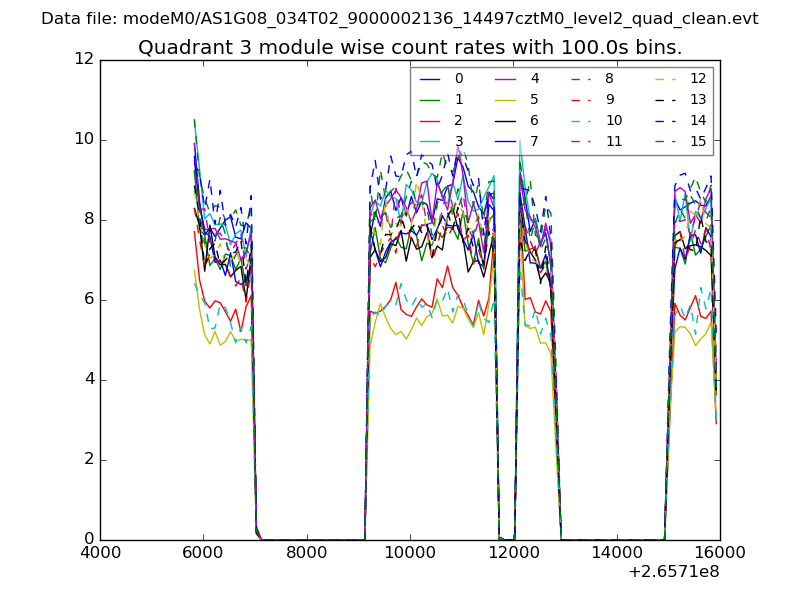
| Module-wise count rates for Quadrant A Data is divided into 100 sec bins |
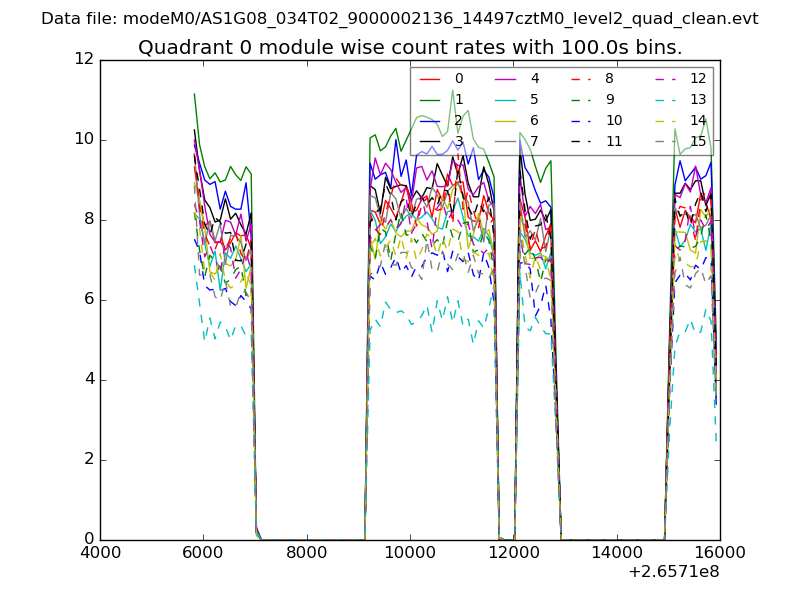 |
 |
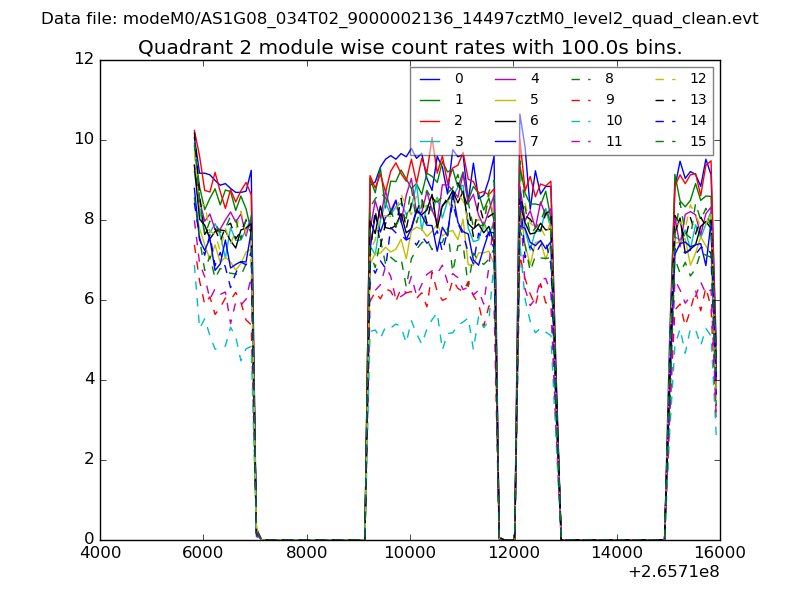
| Module-wise count rates for Quadrant B Data is divided into 100 sec bins |
 |
 |
| Module-wise count rates for Quadrant C Data is divided into 100 sec bins |
 |
 |
| Module-wise count rates for Quadrant D Data is divided into 100 sec bins |
 |
 |
| Parameter | Plot |
|---|---|
| CZT HV Monitor | 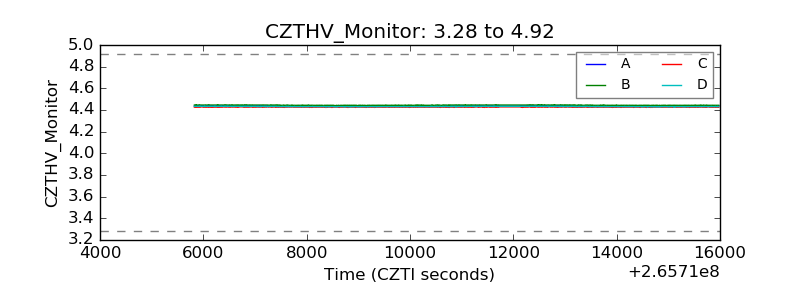 |
| D_VDD | 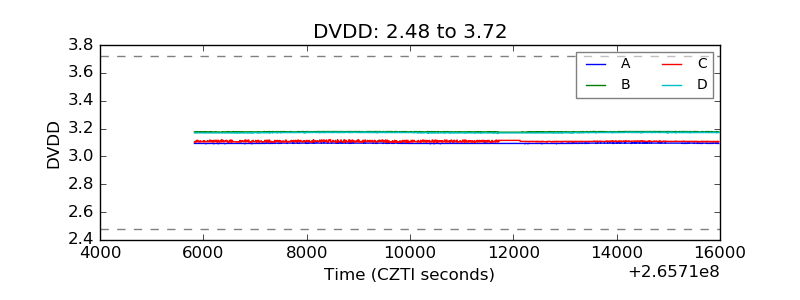 |
| Temperature 1 | 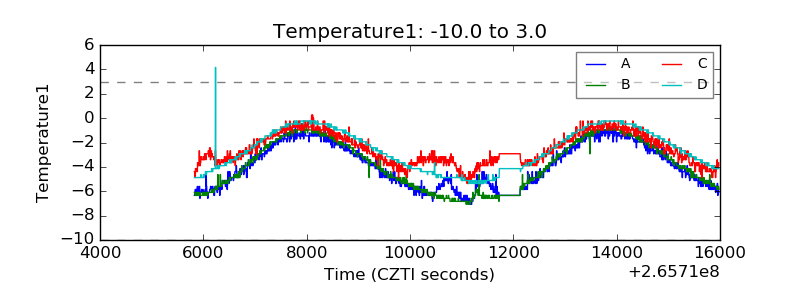 |
| Veto HV Monitor | 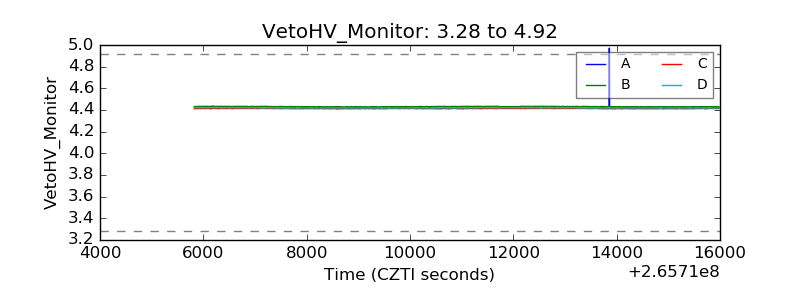 |
| Veto LLD | 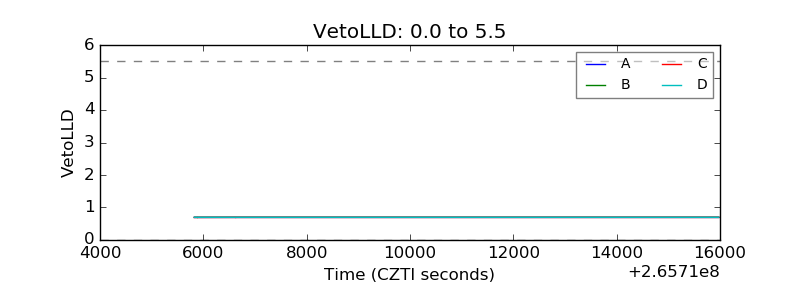 |
| Alpha Counter | 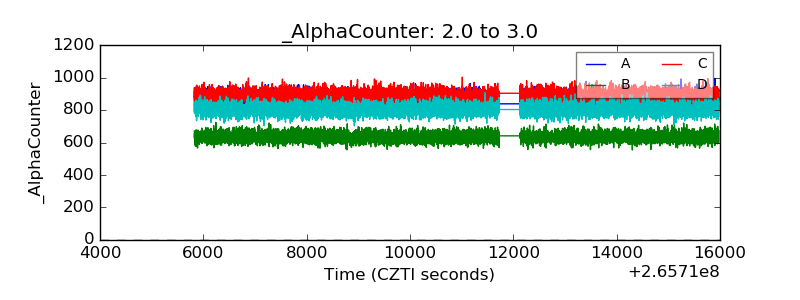 |
| _CPM_Rate | 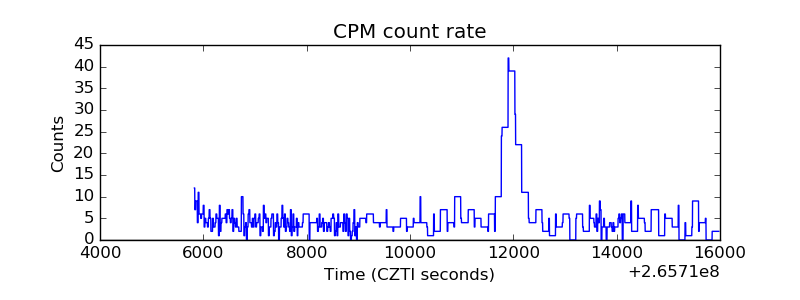 |
| CZT Counter | 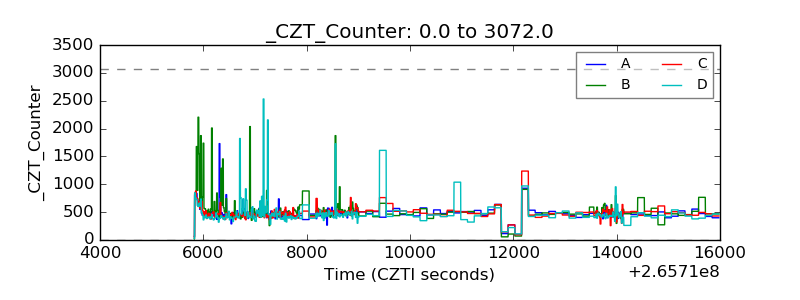 |
| +2.5 Volts monitor |  |
| +5 Volts monitor | 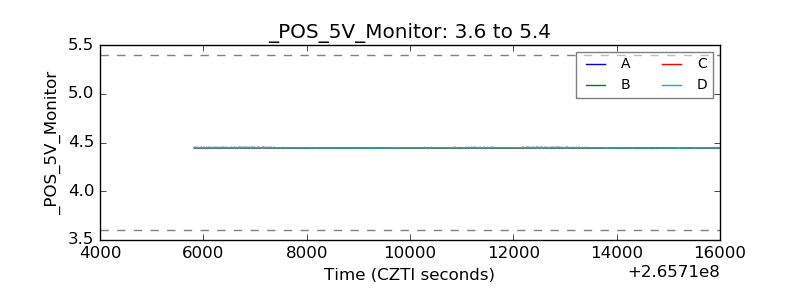 |
| _ROLL_ROT | 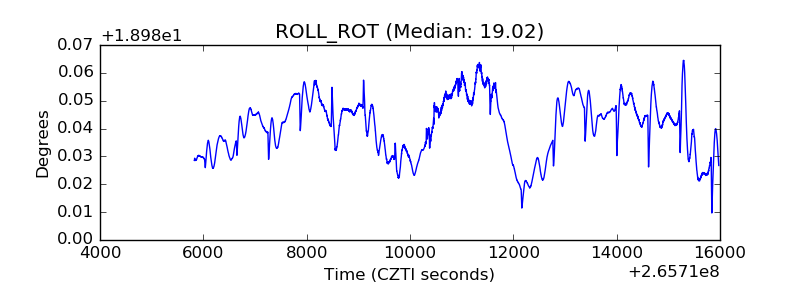 |
| _Roll_DEC | 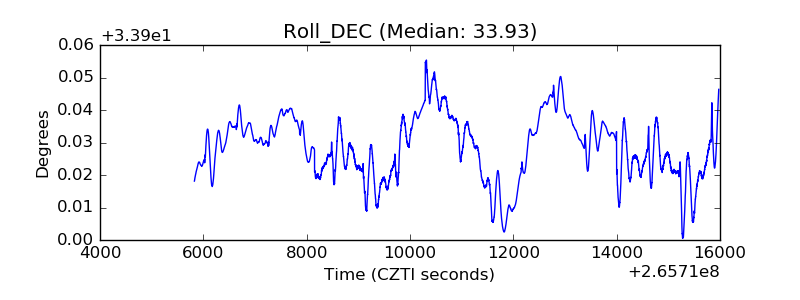 |
| _Roll_RA | 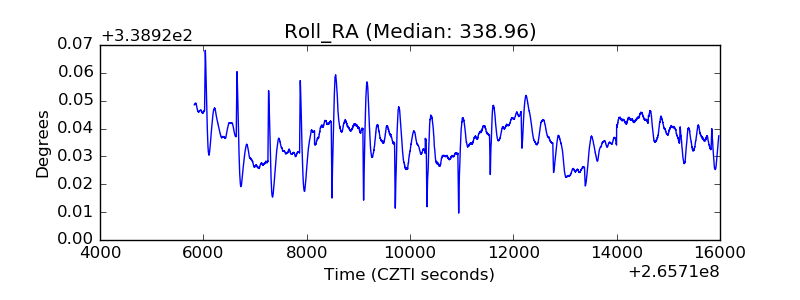 |
| Veto Counter | 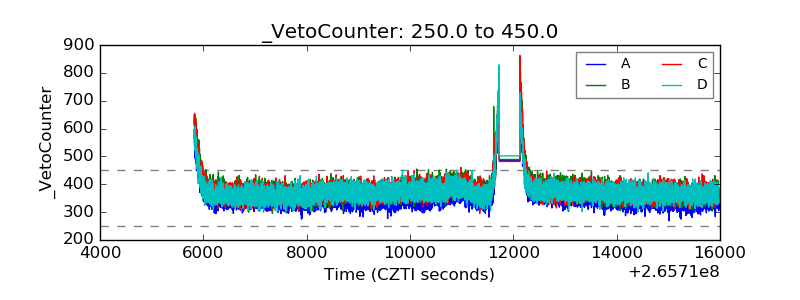 |