| Param | Original file | Final file |
|---|---|---|
| Filename | modeM0/AS1G08_066T01_9000002138cztM0_level2.fits | modeM0/AS1G08_066T01_9000002138cztM0_level2_quad_clean.evt |
| Size (bytes) | 1,374,909,120 | 1,301,451,840 |
| Size | 1.3 GB | 1.2 GB |
| Events in quadrant A | 8,406,906 | 7,830,098 |
| Events in quadrant B | 8,071,602 | 7,825,950 |
| Events in quadrant C | 8,338,950 | 7,495,393 |
| Events in quadrant D | 7,066,124 | 6,511,585 |
| Mode M9 | |||
|---|---|---|---|
| Quadrant | BADHDUFLAG | Total packets | Discarded packets |
| A | 0 | 221 | 0 |
| B | 0 | 221 | 0 |
| C | 0 | 221 | 0 |
| D | 0 | 222 | 0 |
| Mode SS | |||
|---|---|---|---|
| Quadrant | BADHDUFLAG | Total packets | Discarded packets |
| A | 0 | 2894 | 0 |
| B | 0 | 2894 | 0 |
| C | 0 | 2894 | 0 |
| D | 0 | 2894 | 0 |
| Mode M0 | |||
|---|---|---|---|
| Quadrant | BADHDUFLAG | Total packets | Discarded packets |
| A | 0 | 299727 | 0 |
| B | 0 | 312108 | 0 |
| C | 0 | 306711 | 0 |
| D | 0 | 349474 | 0 |
| Quadrant | Total seconds | Saturated seconds | Saturation percentage |
|---|---|---|---|
| A | 142357 | 2015 | 1.415456% |
| B | 142357 | 2829 | 1.987257% |
| C | 142357 | 1880 | 1.320624% |
| D | 142357 | 7911 | 5.557156% |
Noise dominated data is calculated using 1-second bins in cleaned event files. If a bin has >2000 counts, and if more than 50% of those come from <1% of pixels, then it is considered to be noise-dominated and hence unusable.
| Quadrant | # 1 sec bins | Bins with >0 counts | Bins with >2000 counts | High rate bins dominated by noise | Noise dominated (total time) | Noise dominated (detector-on time) | Marked lightcurve |
|---|---|---|---|---|---|---|---|
| A | 169012 | 142358 | 0 | 0 | 0.00% | 0.00% |  |
| B | 169012 | 142356 | 0 | 0 | 0.00% | 0.00% |  |
| C | 169012 | 142357 | 0 | 0 | 0.00% | 0.00% |  |
| D | 169012 | 141586 | 0 | 0 | 0.00% | 0.00% |  |
Top three noisy pixels from each quadrant. If the there are fewer than three noisy pixels in the level2.evt file, extra rows are filled as -1
| Pixel properties | Quadrant properties | ||||||
|---|---|---|---|---|---|---|---|
| Quadrant | DetID | PixID | Counts | Sigma | Mean | Median | Sigma |
| A | 0 | 29 | 8112 | 11.12 | 2188 | 2046 | 545.4 |
| A | 7 | 110 | 6713 | 8.56 | 2188 | 2046 | 545.4 |
| A | 15 | 236 | 6234 | 7.68 | 2188 | 2046 | 545.4 |
| B | 2 | 9 | 7023 | 12.0 | 2135 | 2040 | 415.2 |
| B | 5 | 128 | 5340 | 7.95 | 2135 | 2040 | 415.2 |
| B | 3 | 17 | 5321 | 7.9 | 2135 | 2040 | 415.2 |
| C | 1 | 80 | 6322 | 7.59 | 2202 | 2049 | 563.3 |
| C | 1 | 81 | 6113 | 7.21 | 2202 | 2049 | 563.3 |
| C | 12 | 241 | 5892 | 6.82 | 2202 | 2049 | 563.3 |
| D | 3 | 14 | 5105 | 6.06 | 2018 | 1836 | 539.8 |
| D | 6 | 231 | 5055 | 5.96 | 2018 | 1836 | 539.8 |
| D | 10 | 189 | 4874 | 5.63 | 2018 | 1836 | 539.8 |
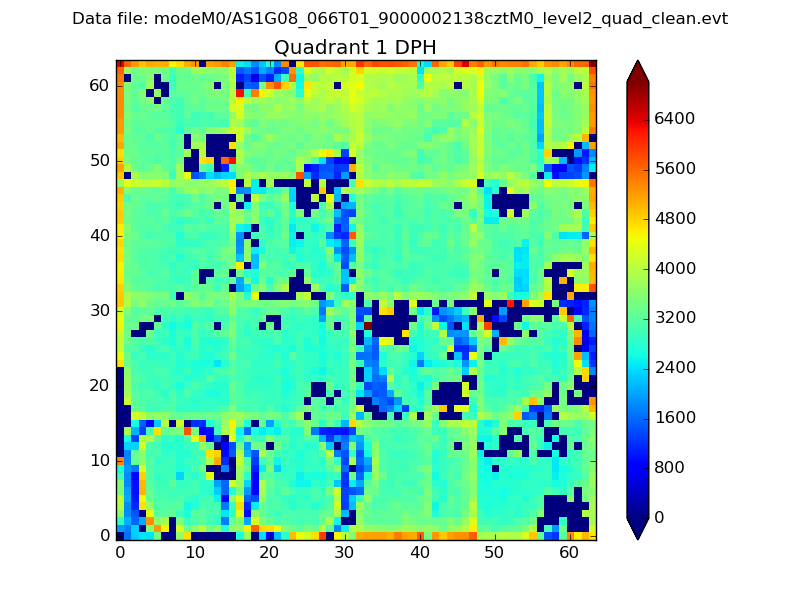
Histogram calculated using DETX and DETY for each event in the final _common_clean file
| Quadrant A |  |
 |
Quadrant B |
|---|---|---|---|
| Quadrant D |  |
 |
Quadrant C |
| Plot type | Count rate plots | Images |
|---|---|---|
| Comparison with Poisson distribution Blue bars denote a histogram of data divided into 1 sec bins. Red curve is a Poisson curve with rate = median count rate of data. |
 |
 |
| Quadrant-wise count rates Data is divided into 100 sec bins |
 |
|
| Module-wise count rates for Quadrant A Data is divided into 100 sec bins |
 |
 |
| Module-wise count rates for Quadrant B Data is divided into 100 sec bins |
 |
 |
| Module-wise count rates for Quadrant C Data is divided into 100 sec bins |
 |
 |
| Module-wise count rates for Quadrant D Data is divided into 100 sec bins |
 |
 |
| Parameter | Plot |
|---|---|
| CZT HV Monitor |  |
| D_VDD | 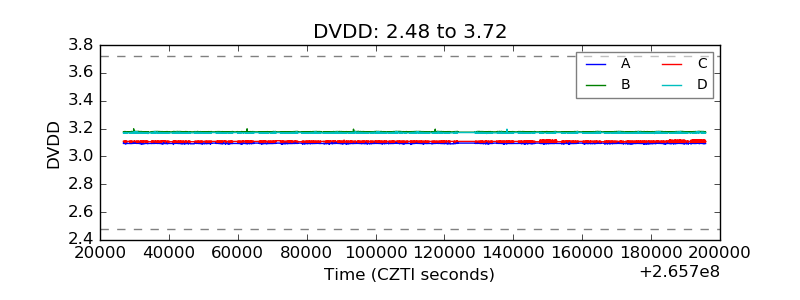 |
| Temperature 1 | 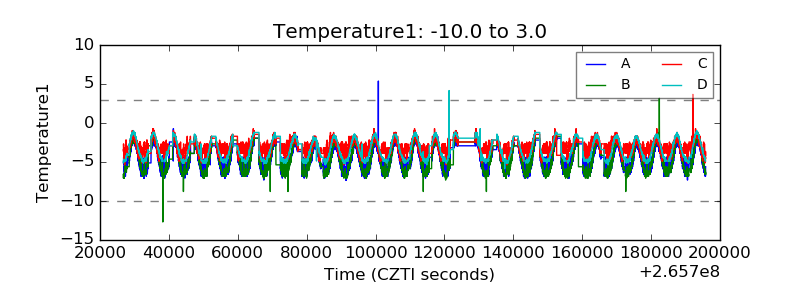 |
| Veto HV Monitor |  |
| Veto LLD |  |
| Alpha Counter |  |
| _CPM_Rate |  |
| CZT Counter | 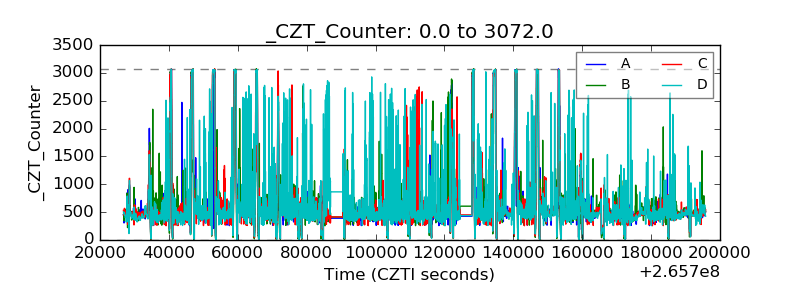 |
| +2.5 Volts monitor | 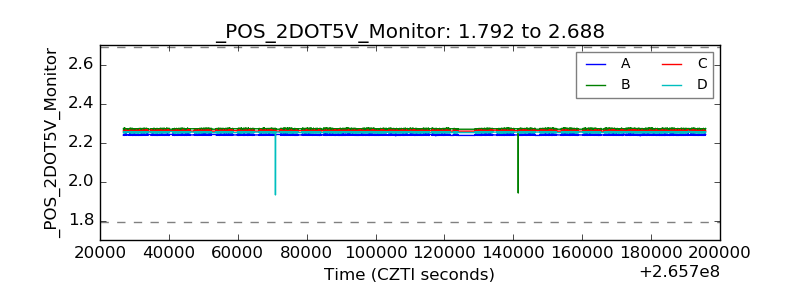 |
| +5 Volts monitor |  |
| _ROLL_ROT |  |
| _Roll_DEC |  |
| _Roll_RA | 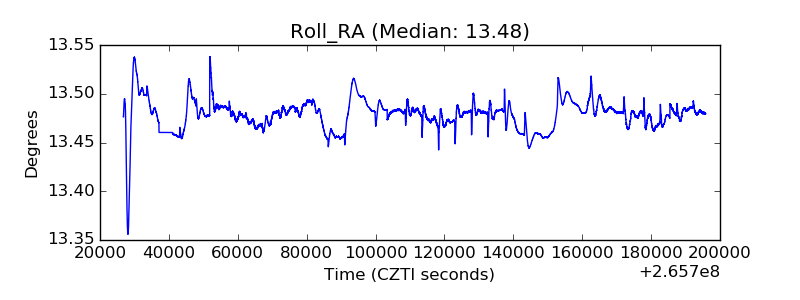 |
| Veto Counter | 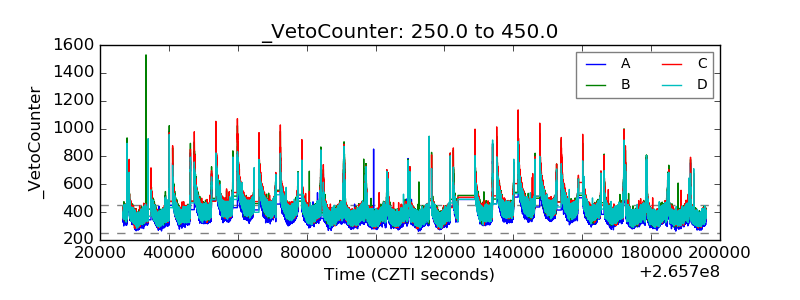 |