| Param | Original file | Final file |
|---|---|---|
| Filename | modeM0/AS1G08_066T01_9000002138_14497cztM0_level2.evt | modeM0/AS1G08_066T01_9000002138_14497cztM0_level2_quad_clean.evt |
| Size (bytes) | 535,219,200 | 96,960,960 |
| Size | 510.4 MB | 92.5 MB |
| Events in quadrant A | 3,806,492 | 600,630 |
| Events in quadrant B | 4,089,241 | 603,213 |
| Events in quadrant C | 3,932,844 | 599,573 |
| Events in quadrant D | 3,842,983 | 582,417 |
| Mode M9 | |||
|---|---|---|---|
| Quadrant | BADHDUFLAG | Total packets | Discarded packets |
| A | 0 | 15 | 0 |
| B | 0 | 15 | 0 |
| C | 0 | 15 | 0 |
| D | 0 | 15 | 0 |
| Mode SS | |||
|---|---|---|---|
| Quadrant | BADHDUFLAG | Total packets | Discarded packets |
| A | 0 | 160 | 0 |
| B | 0 | 160 | 0 |
| C | 0 | 160 | 0 |
| D | 0 | 160 | 0 |
| Mode M0 | |||
|---|---|---|---|
| Quadrant | BADHDUFLAG | Total packets | Discarded packets |
| A | 0 | 16363 | 3 |
| B | 0 | 17155 | 2 |
| C | 0 | 16346 | 2 |
| D | 0 | 16947 | 2 |
| Quadrant | Total seconds | Saturated seconds | Saturation percentage |
|---|---|---|---|
| A | 7925 | 130 | 1.640379% |
| B | 7925 | 176 | 2.220820% |
| C | 7925 | 92 | 1.160883% |
| D | 7925 | 121 | 1.526814% |
Noise dominated data is calculated using 1-second bins in cleaned event files. If a bin has >2000 counts, and if more than 50% of those come from <1% of pixels, then it is considered to be noise-dominated and hence unusable.
| Quadrant | # 1 sec bins | Bins with >0 counts | Bins with >2000 counts | High rate bins dominated by noise | Noise dominated (total time) | Noise dominated (detector-on time) | Marked lightcurve |
|---|---|---|---|---|---|---|---|
| A | 9336 | 7928 | 3 | 3 | 0.03% | 0.04% | 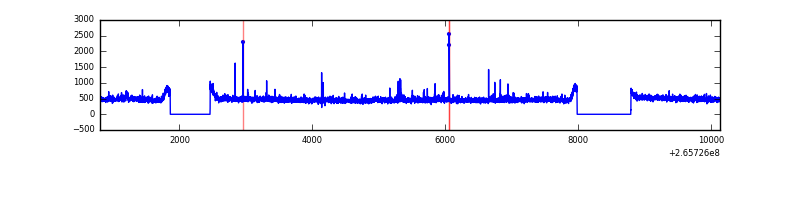 |
| B | 9336 | 7928 | 11 | 11 | 0.12% | 0.14% | 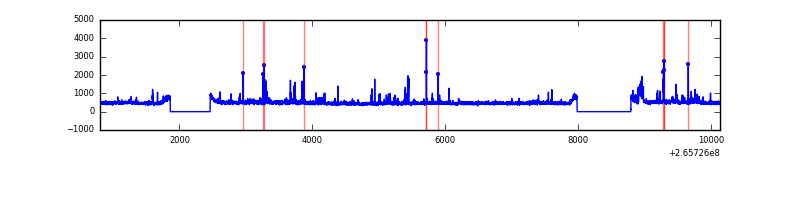 |
| C | 9336 | 7928 | 0 | 0 | 0.00% | 0.00% | 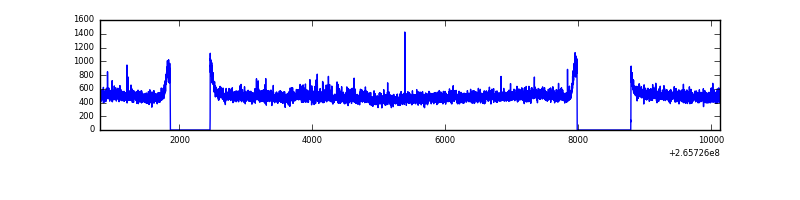 |
| D | 9336 | 7928 | 14 | 14 | 0.15% | 0.18% | 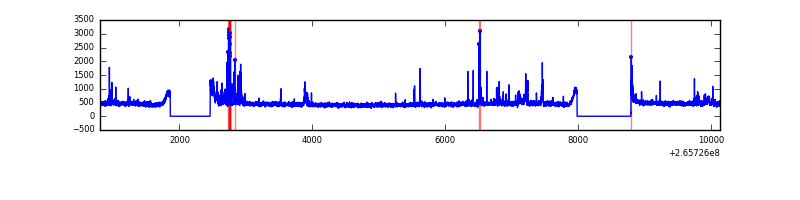 |
Top three noisy pixels from each quadrant. If the there are fewer than three noisy pixels in the level2.evt file, extra rows are filled as -1
| Pixel properties | Quadrant properties | ||||||
|---|---|---|---|---|---|---|---|
| Quadrant | DetID | PixID | Counts | Sigma | Mean | Median | Sigma |
| A | 12 | 189 | 67830 | 340.98 | 960 | 936 | 196.2 |
| A | 4 | 2 | 27067 | 133.2 | 960 | 936 | 196.2 |
| A | 8 | 15 | 15443 | 73.95 | 960 | 936 | 196.2 |
| B | 0 | 189 | 78763 | 422.48 | 953 | 927 | 184.2 |
| B | 0 | 219 | 67178 | 359.6 | 953 | 927 | 184.2 |
| B | 0 | 229 | 54051 | 288.35 | 953 | 927 | 184.2 |
| C | 3 | 233 | 288533 | 1325.1 | 930 | 934 | 217.0 |
| C | 0 | 207 | 15231 | 65.87 | 930 | 934 | 217.0 |
| C | 13 | 61 | 6609 | 26.15 | 930 | 934 | 217.0 |
| D | 10 | 199 | 144489 | 613.96 | 931 | 904 | 233.9 |
| D | 2 | 234 | 34797 | 144.92 | 931 | 904 | 233.9 |
| D | 13 | 169 | 27717 | 114.65 | 931 | 904 | 233.9 |
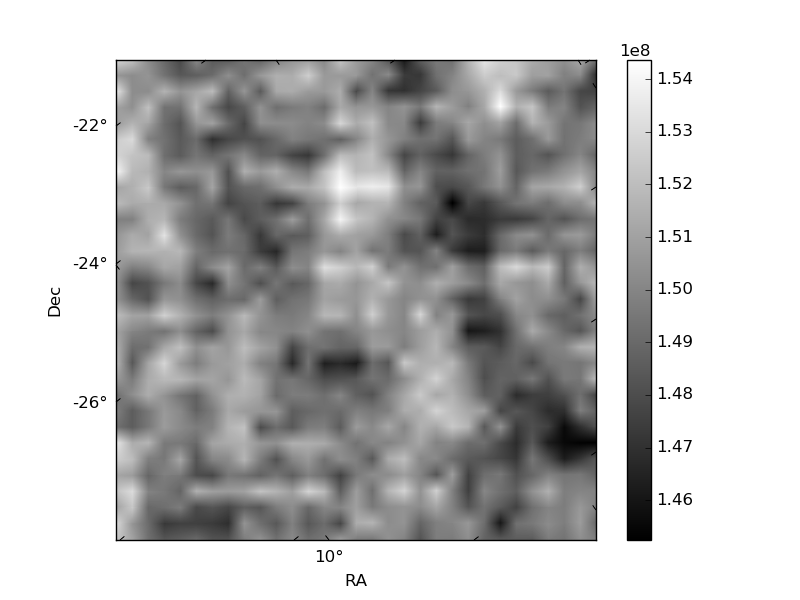
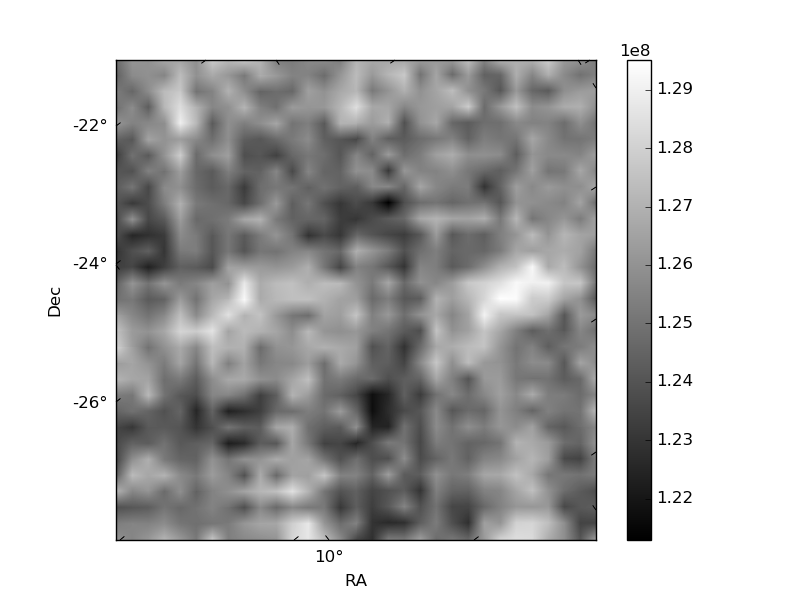
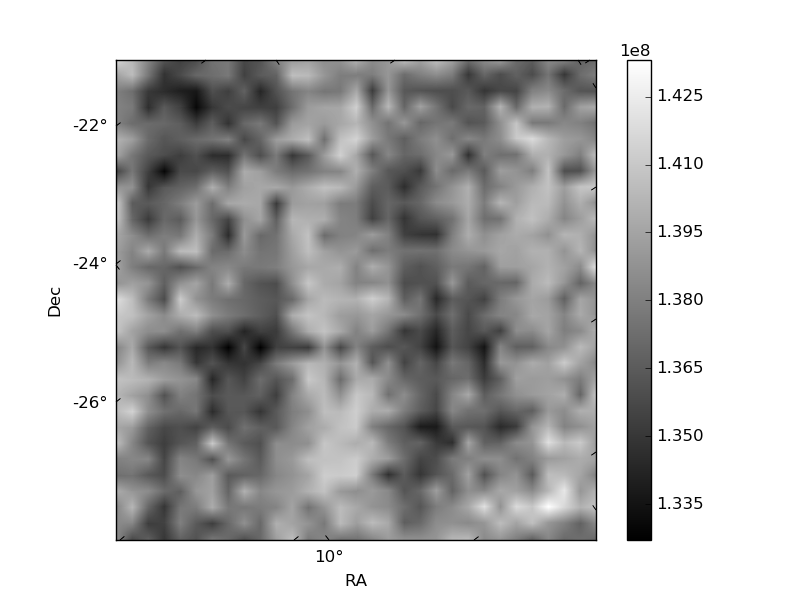
Histogram calculated using DETX and DETY for each event in the final _common_clean file
| Quadrant A | 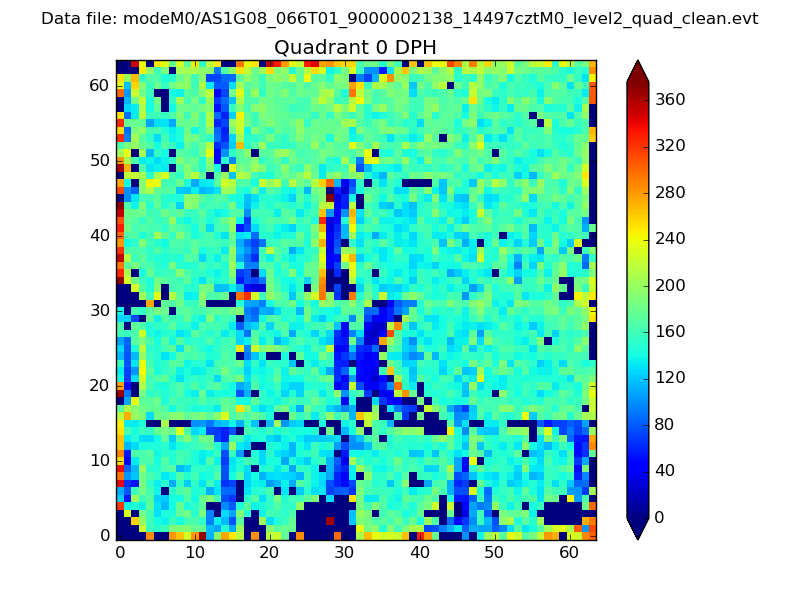 |
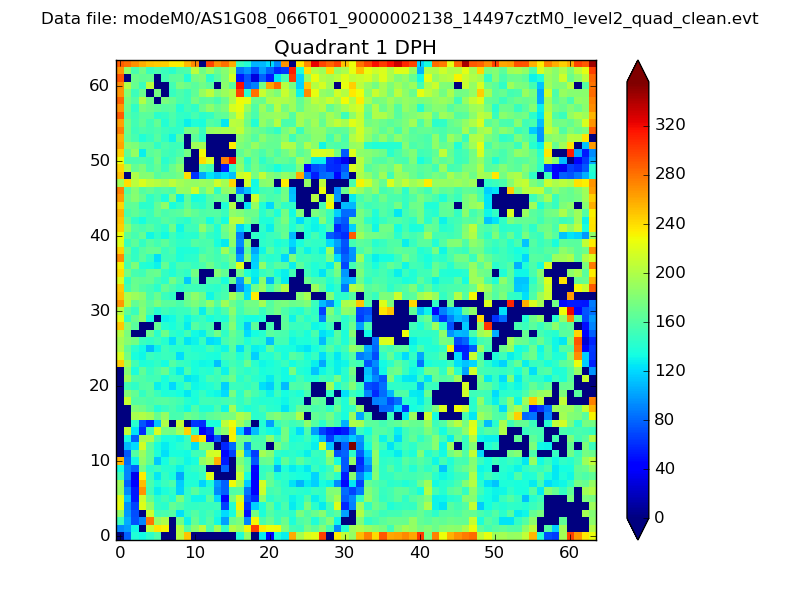 |
Quadrant B |
|---|---|---|---|
| Quadrant D | 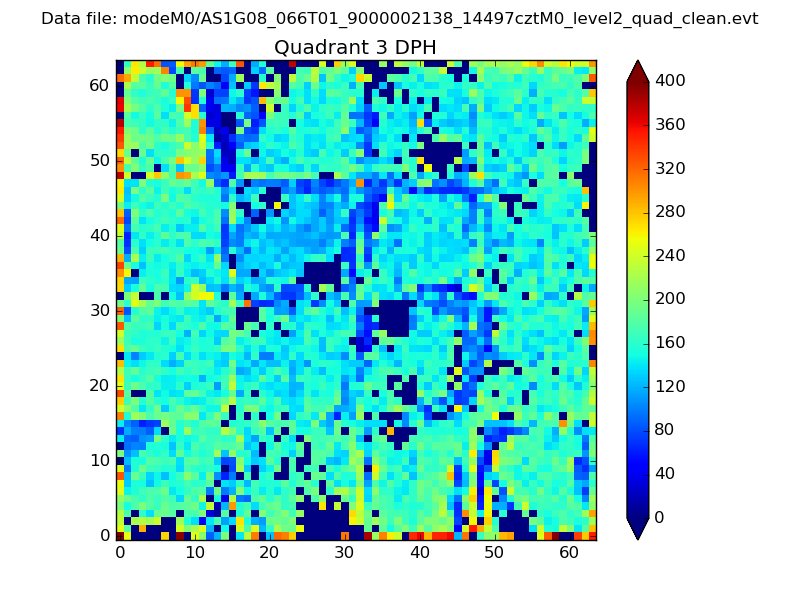 |
 |
Quadrant C |
| Plot type | Count rate plots | Images |
|---|---|---|
| Comparison with Poisson distribution Blue bars denote a histogram of data divided into 1 sec bins. Red curve is a Poisson curve with rate = median count rate of data. |
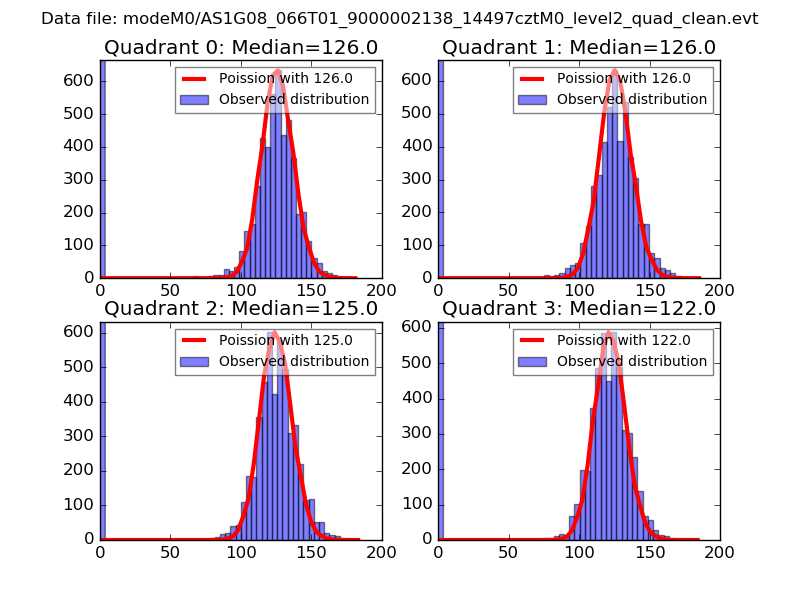 |
 |
| Quadrant-wise count rates Data is divided into 100 sec bins |
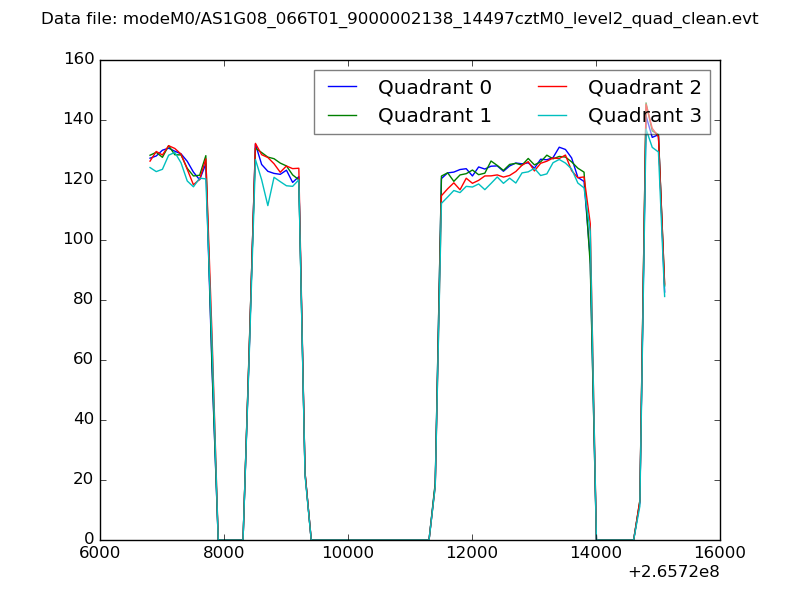 |
|
| Module-wise count rates for Quadrant A Data is divided into 100 sec bins |
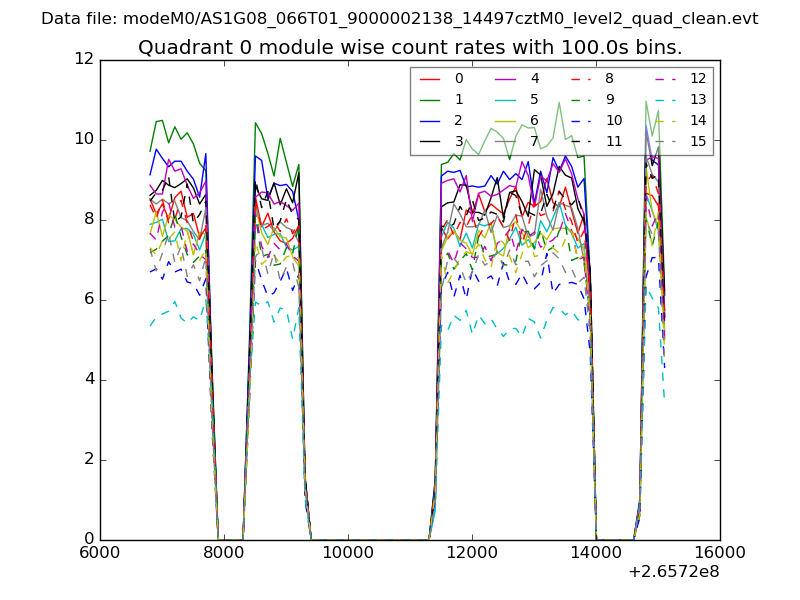 |
 |
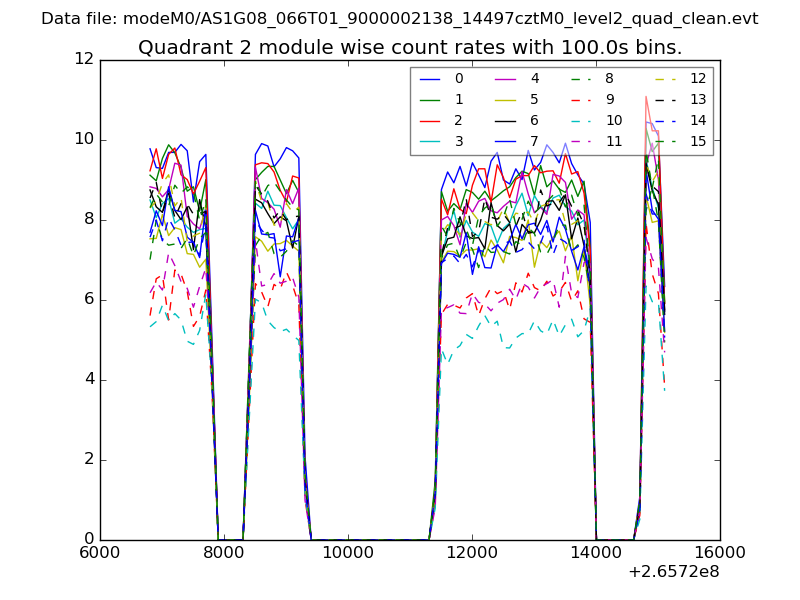
| Module-wise count rates for Quadrant B Data is divided into 100 sec bins |
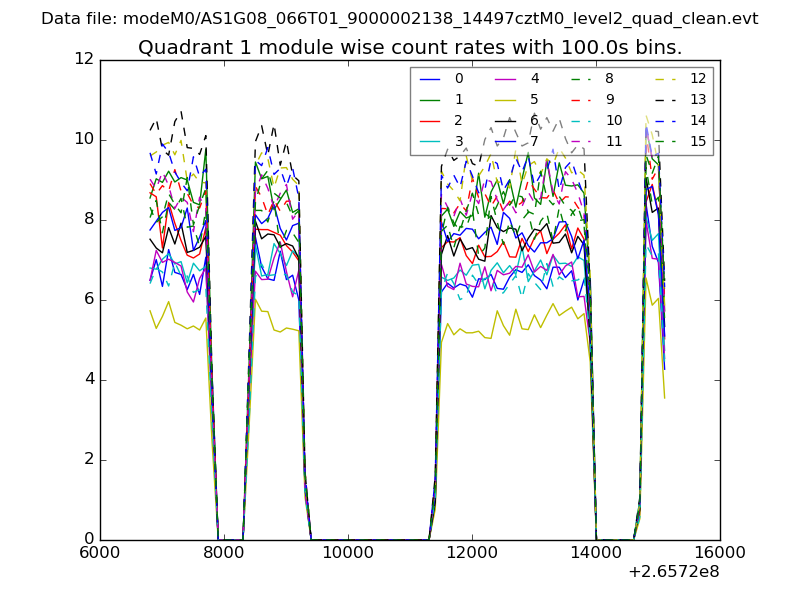 |
 |
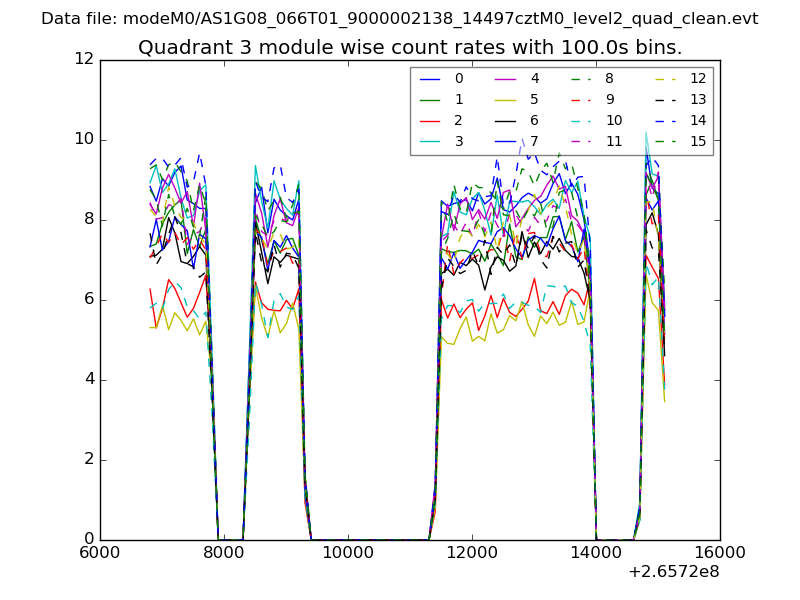
| Module-wise count rates for Quadrant C Data is divided into 100 sec bins |
 |
 |
| Module-wise count rates for Quadrant D Data is divided into 100 sec bins |
 |
 |
| Parameter | Plot |
|---|---|
| CZT HV Monitor | 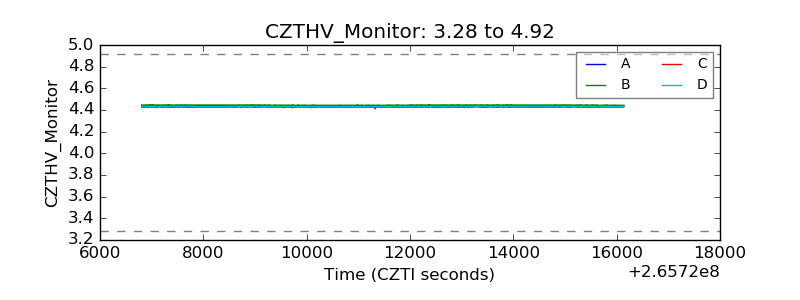 |
| D_VDD | 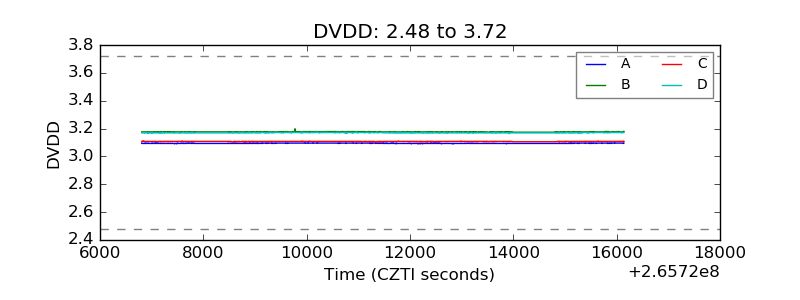 |
| Temperature 1 |  |
| Veto HV Monitor | 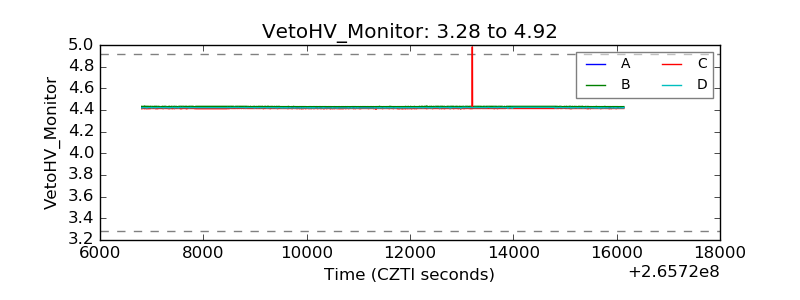 |
| Veto LLD | 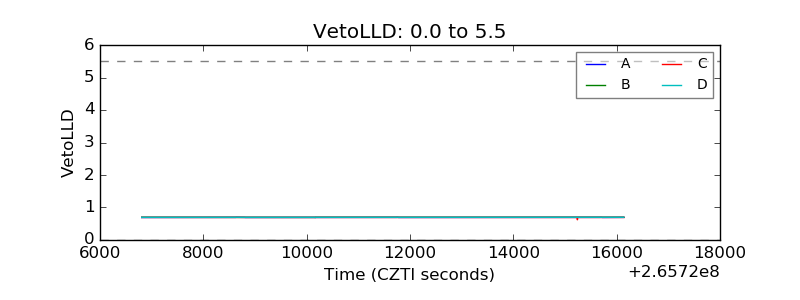 |
| Alpha Counter | 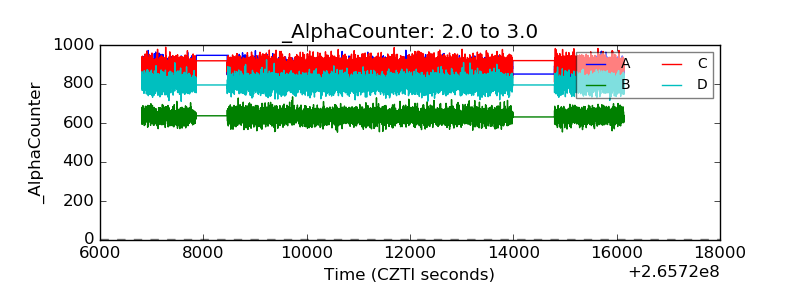 |
| _CPM_Rate | 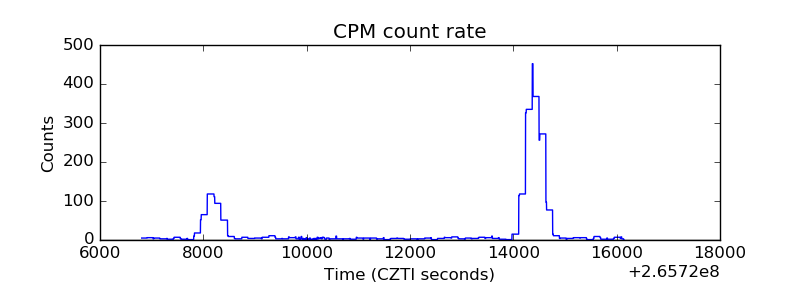 |
| CZT Counter |  |
| +2.5 Volts monitor |  |
| +5 Volts monitor |  |
| _ROLL_ROT | 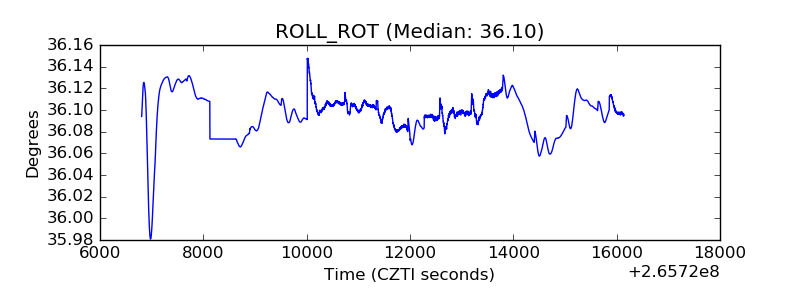 |
| _Roll_DEC | 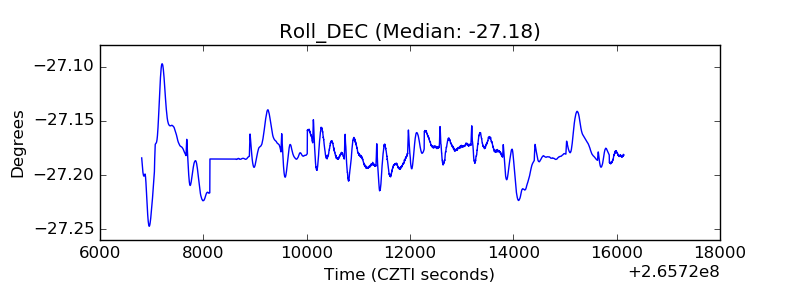 |
| _Roll_RA |  |
| Veto Counter | 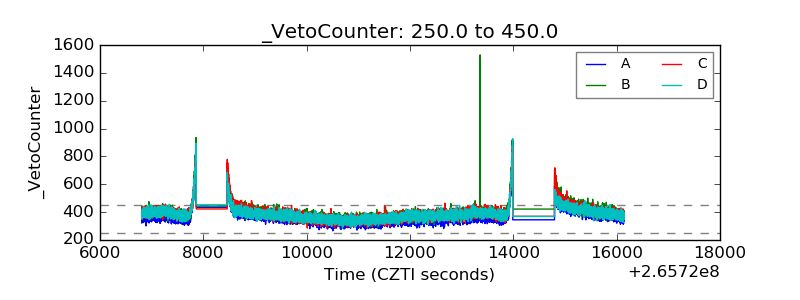 |