| Param | Original file | Final file |
|---|---|---|
| Filename | modeM0/AS1G08_066T01_9000002138_14499cztM0_level2.evt | modeM0/AS1G08_066T01_9000002138_14499cztM0_level2_quad_clean.evt |
| Size (bytes) | 453,772,800 | 65,309,760 |
| Size | 432.8 MB | 62.3 MB |
| Events in quadrant A | 3,271,471 | 386,611 |
| Events in quadrant B | 3,596,521 | 386,463 |
| Events in quadrant C | 3,258,703 | 378,421 |
| Events in quadrant D | 3,175,422 | 373,789 |
| Mode M9 | |||
|---|---|---|---|
| Quadrant | BADHDUFLAG | Total packets | Discarded packets |
| A | 0 | 17 | 0 |
| B | 0 | 17 | 0 |
| C | 0 | 17 | 0 |
| D | 0 | 18 | 0 |
| Mode SS | |||
|---|---|---|---|
| Quadrant | BADHDUFLAG | Total packets | Discarded packets |
| A | 0 | 132 | 0 |
| B | 0 | 132 | 0 |
| C | 0 | 132 | 0 |
| D | 0 | 132 | 0 |
| Mode M0 | |||
|---|---|---|---|
| Quadrant | BADHDUFLAG | Total packets | Discarded packets |
| A | 0 | 13834 | 3 |
| B | 0 | 14910 | 2 |
| C | 0 | 13618 | 2 |
| D | 0 | 13851 | 2 |
| Quadrant | Total seconds | Saturated seconds | Saturation percentage |
|---|---|---|---|
| A | 6479 | 63 | 0.972372% |
| B | 6479 | 91 | 1.404538% |
| C | 6479 | 26 | 0.401296% |
| D | 6479 | 54 | 0.833462% |
Noise dominated data is calculated using 1-second bins in cleaned event files. If a bin has >2000 counts, and if more than 50% of those come from <1% of pixels, then it is considered to be noise-dominated and hence unusable.
| Quadrant | # 1 sec bins | Bins with >0 counts | Bins with >2000 counts | High rate bins dominated by noise | Noise dominated (total time) | Noise dominated (detector-on time) | Marked lightcurve |
|---|---|---|---|---|---|---|---|
| A | 7605 | 6481 | 8 | 8 | 0.11% | 0.12% | 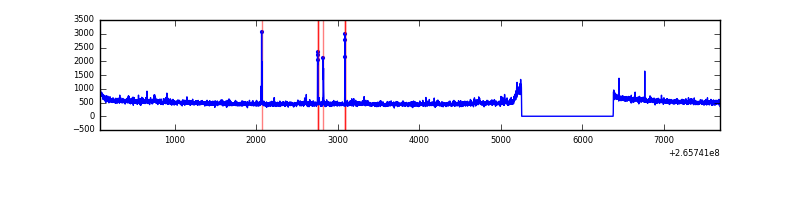 |
| B | 7605 | 6481 | 17 | 17 | 0.22% | 0.26% | 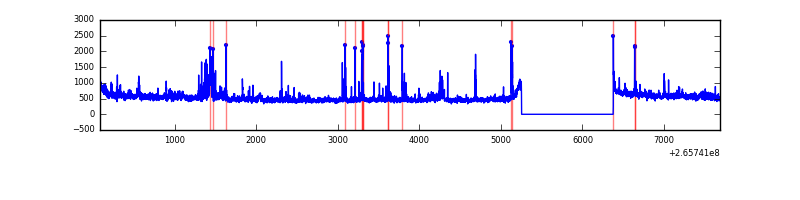 |
| C | 7605 | 6481 | 0 | 0 | 0.00% | 0.00% | 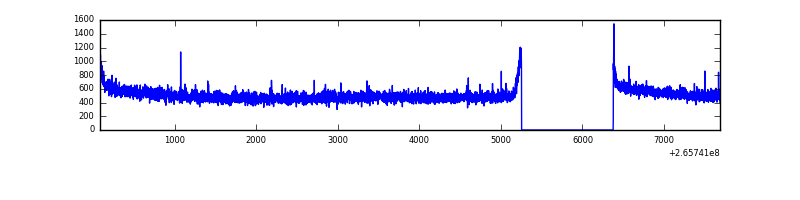 |
| D | 7605 | 6481 | 12 | 12 | 0.16% | 0.19% | 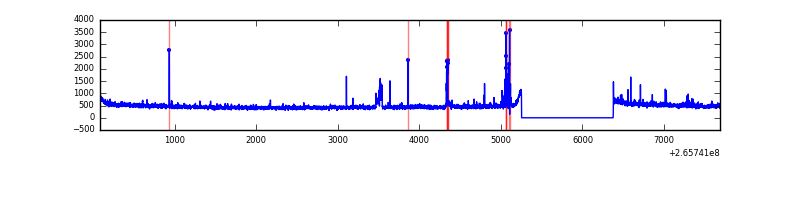 |
Top three noisy pixels from each quadrant. If the there are fewer than three noisy pixels in the level2.evt file, extra rows are filled as -1
| Pixel properties | Quadrant properties | ||||||
|---|---|---|---|---|---|---|---|
| Quadrant | DetID | PixID | Counts | Sigma | Mean | Median | Sigma |
| A | 12 | 189 | 66898 | 402.28 | 816 | 800 | 164.3 |
| A | 4 | 2 | 39781 | 237.24 | 816 | 800 | 164.3 |
| A | 8 | 15 | 16141 | 93.37 | 816 | 800 | 164.3 |
| B | 3 | 209 | 109770 | 705.17 | 814 | 795 | 154.5 |
| B | 10 | 245 | 76565 | 490.3 | 814 | 795 | 154.5 |
| B | 0 | 219 | 47183 | 300.17 | 814 | 795 | 154.5 |
| C | 3 | 233 | 175007 | 965.2 | 784 | 788 | 180.5 |
| C | 0 | 207 | 23746 | 127.19 | 784 | 788 | 180.5 |
| C | 13 | 61 | 5678 | 27.09 | 784 | 788 | 180.5 |
| D | 10 | 199 | 74989 | 374.77 | 786 | 767 | 198.0 |
| D | 12 | 110 | 39014 | 193.12 | 786 | 767 | 198.0 |
| D | 7 | 223 | 32250 | 158.97 | 786 | 767 | 198.0 |
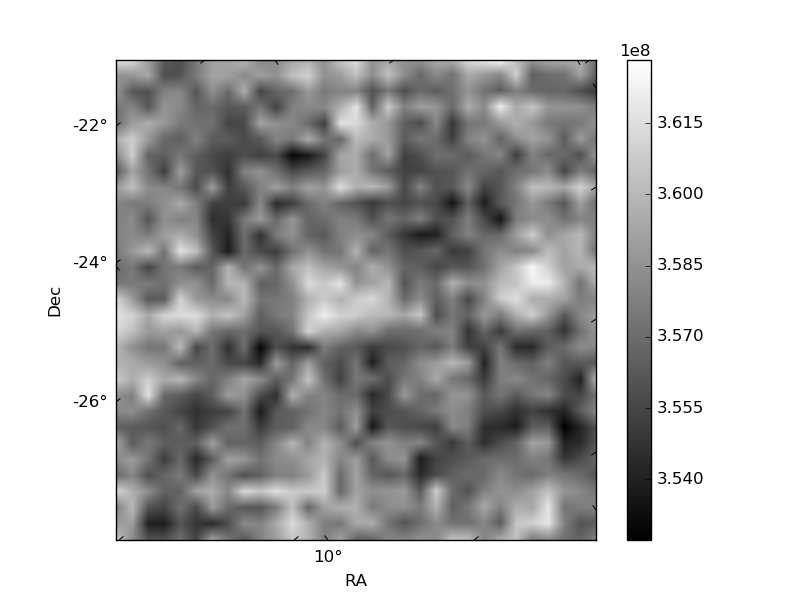
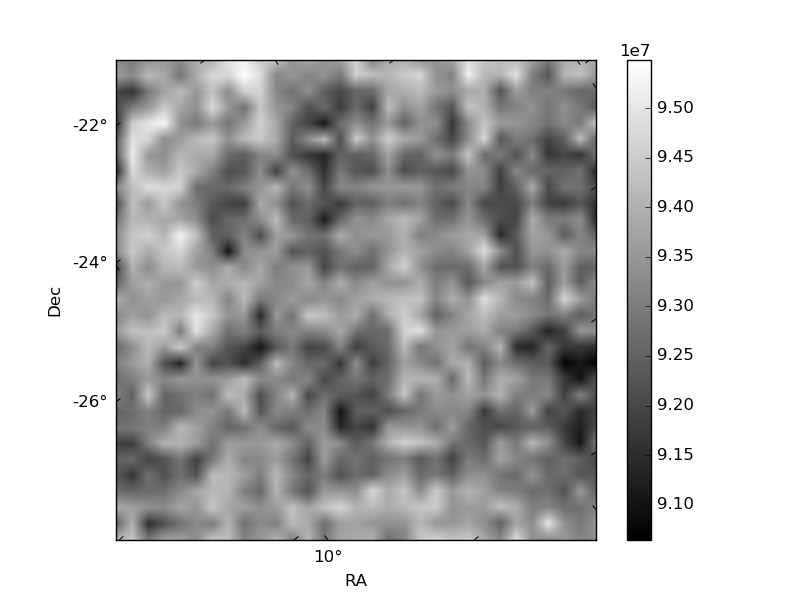
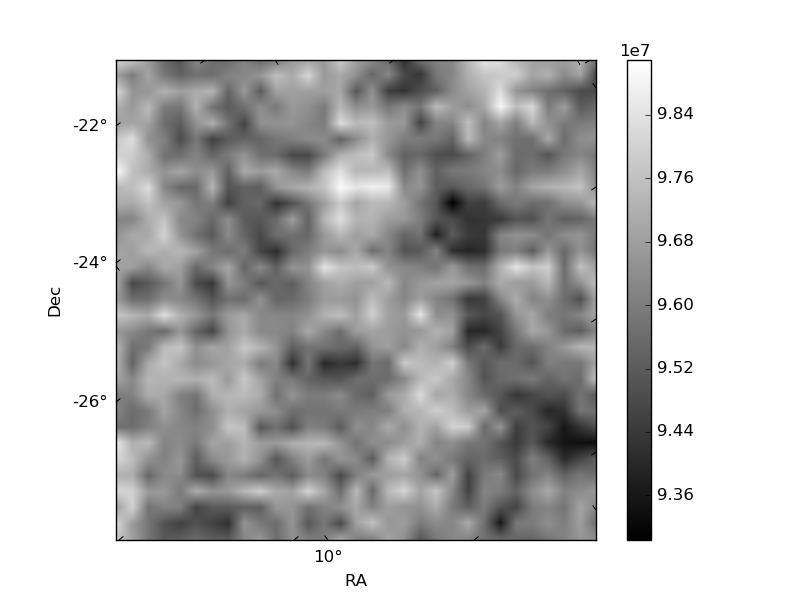
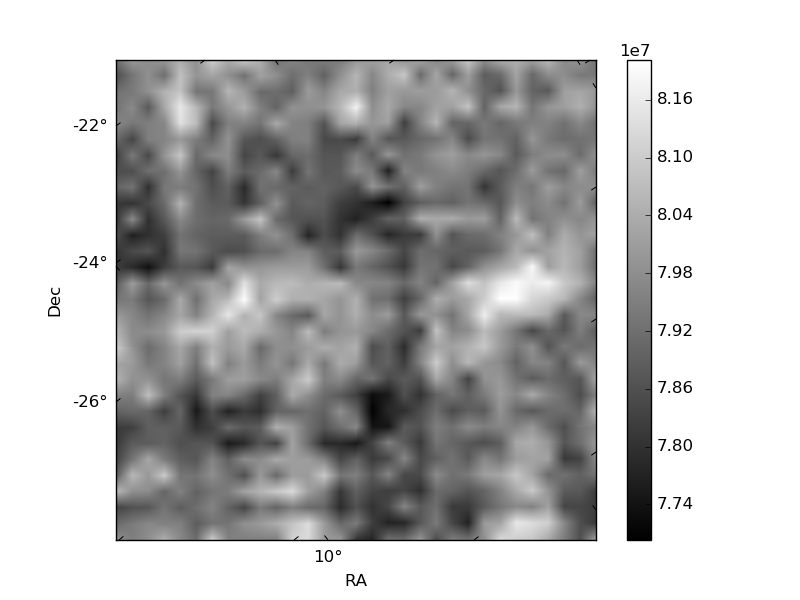
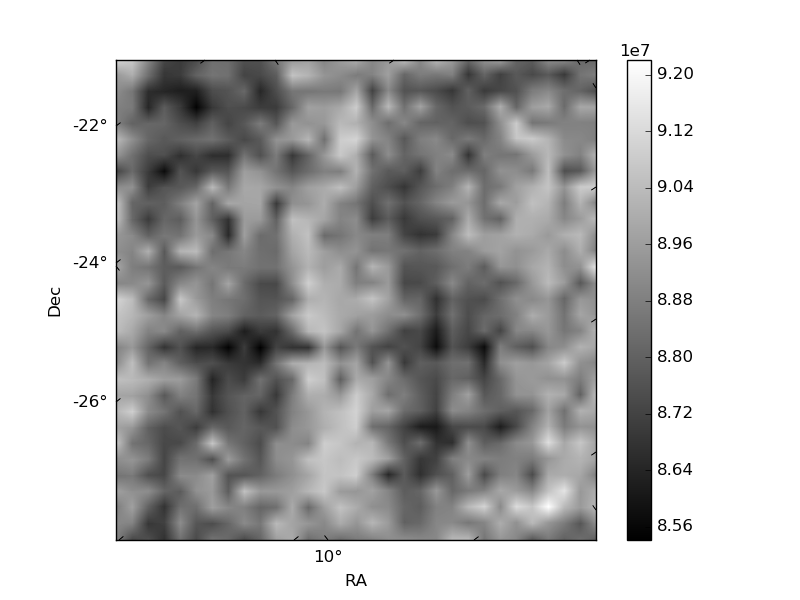
Histogram calculated using DETX and DETY for each event in the final _common_clean file
| Quadrant A | 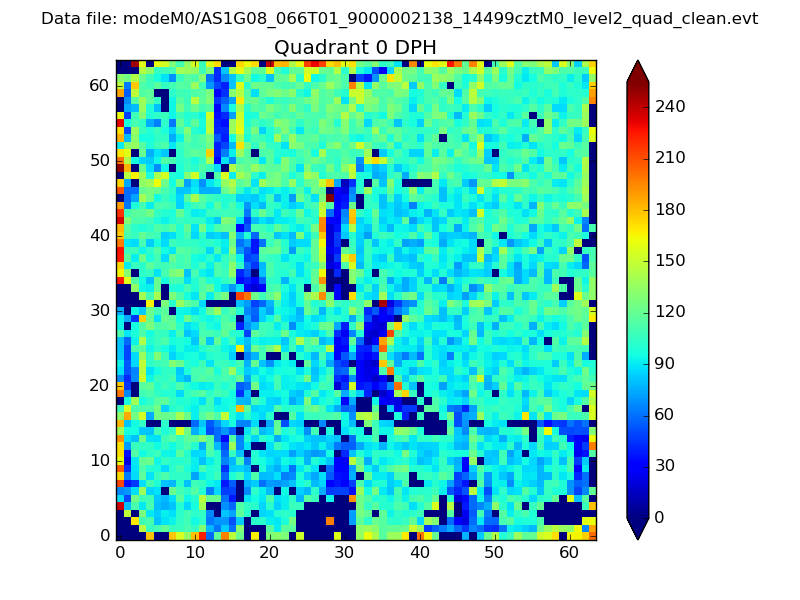 |
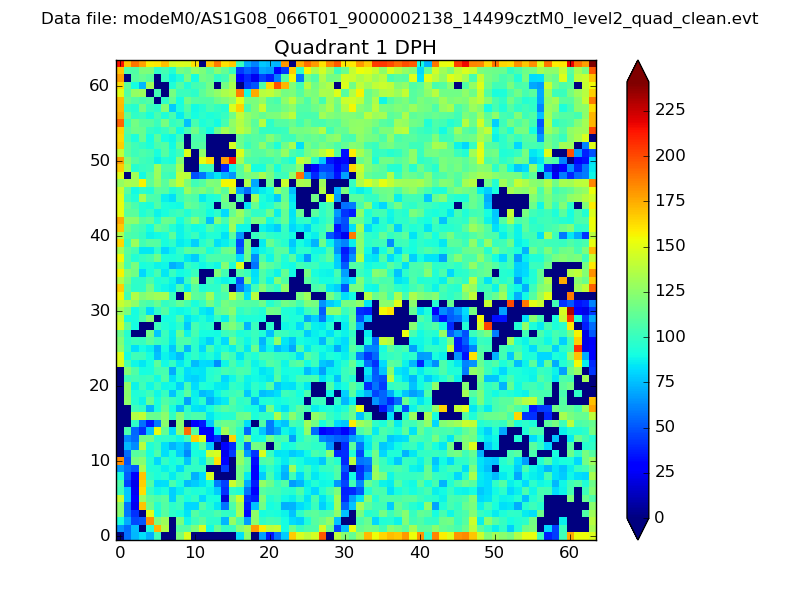 |
Quadrant B |
|---|---|---|---|
| Quadrant D |  |
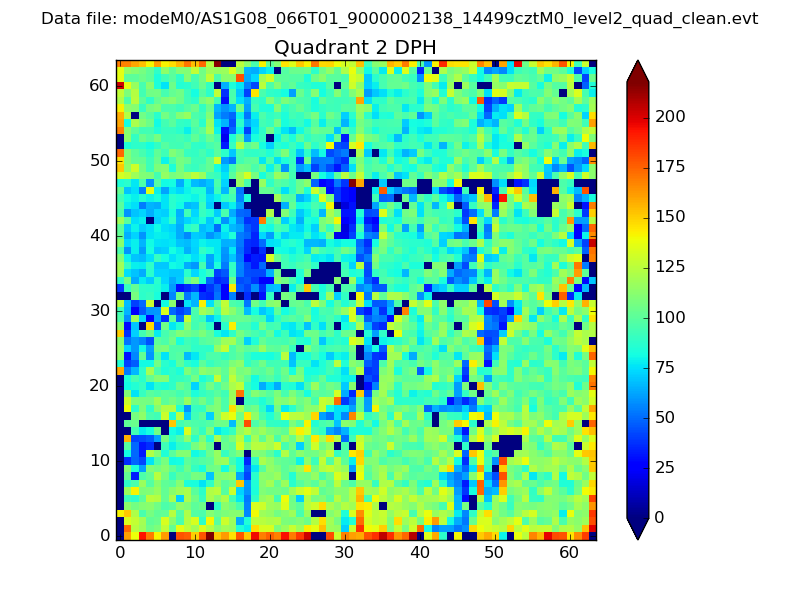 |
Quadrant C |
| Plot type | Count rate plots | Images |
|---|---|---|
| Comparison with Poisson distribution Blue bars denote a histogram of data divided into 1 sec bins. Red curve is a Poisson curve with rate = median count rate of data. |
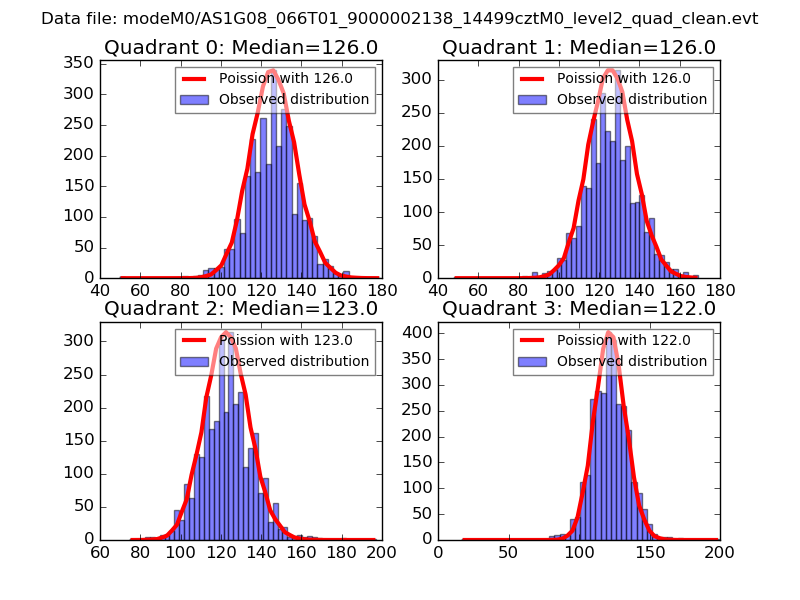 |
 |
| Quadrant-wise count rates Data is divided into 100 sec bins |
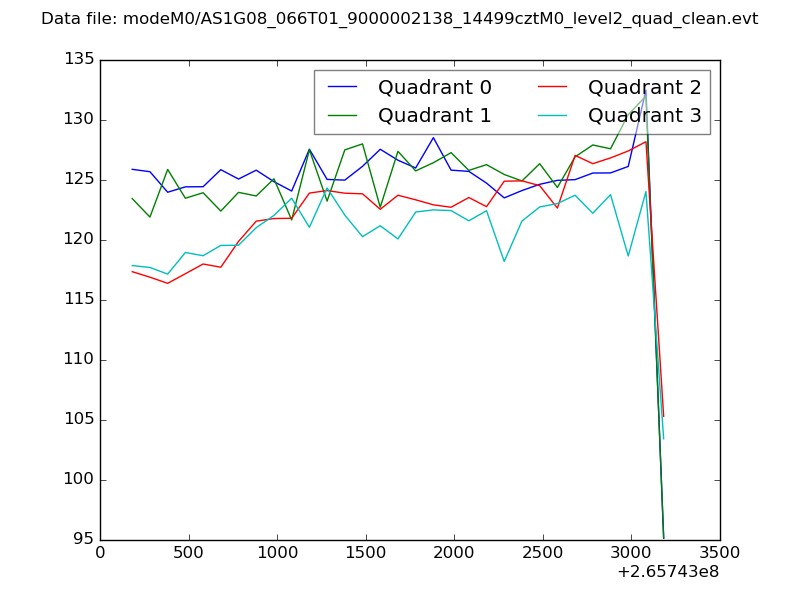 |
|
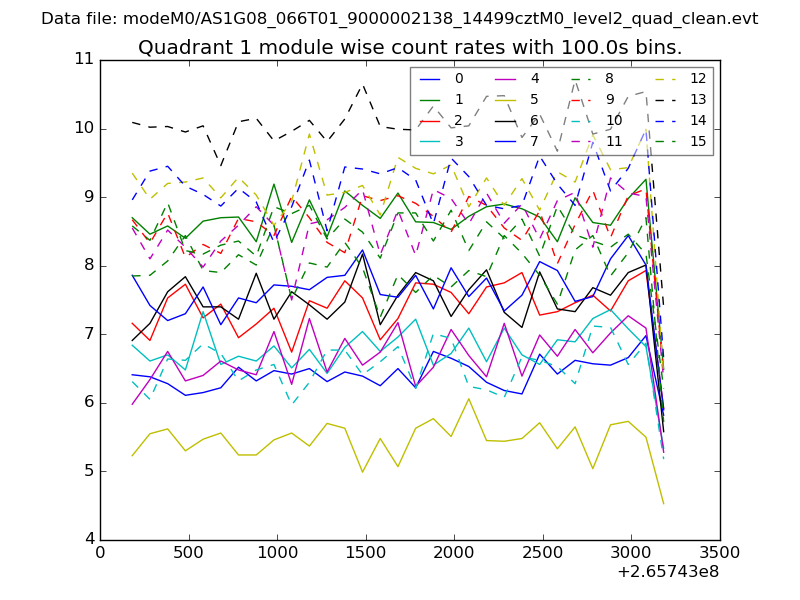
| Module-wise count rates for Quadrant A Data is divided into 100 sec bins |
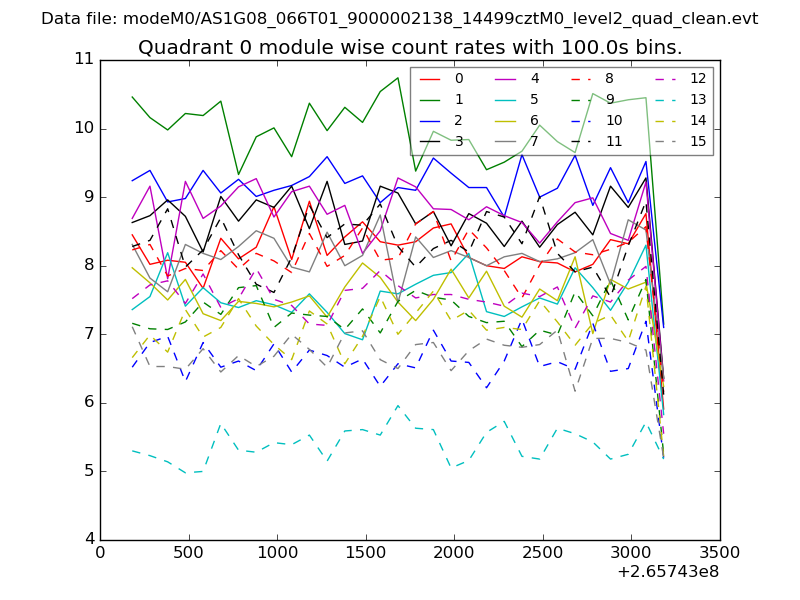 |
 |
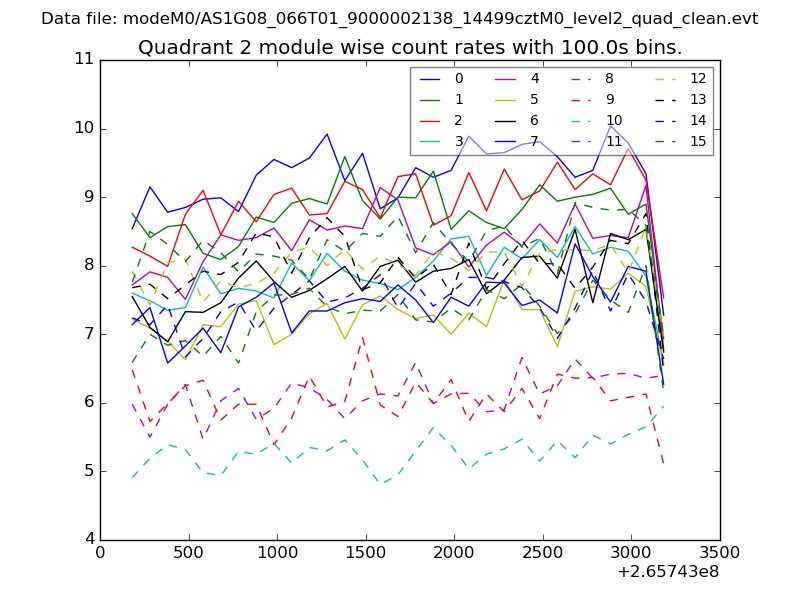
| Module-wise count rates for Quadrant B Data is divided into 100 sec bins |
 |
 |
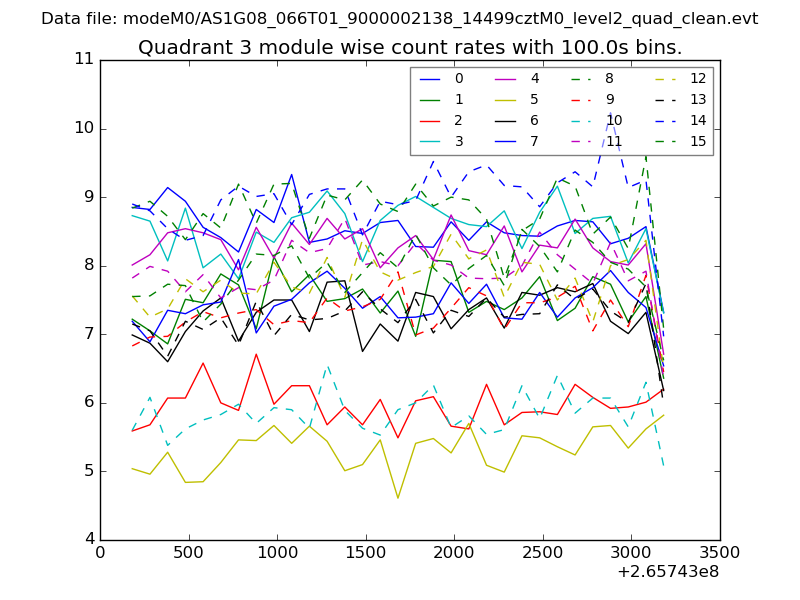
| Module-wise count rates for Quadrant C Data is divided into 100 sec bins |
 |
 |
| Module-wise count rates for Quadrant D Data is divided into 100 sec bins |
 |
 |
| Parameter | Plot |
|---|---|
| CZT HV Monitor | 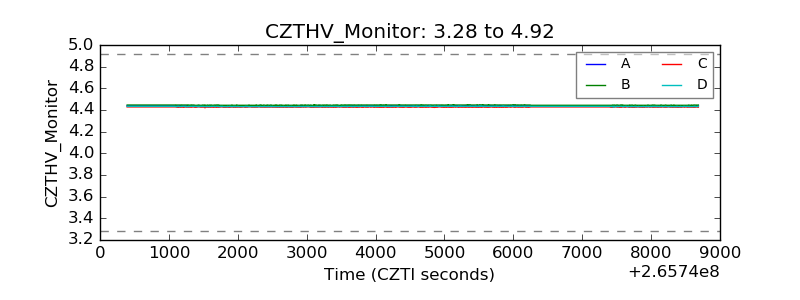 |
| D_VDD | 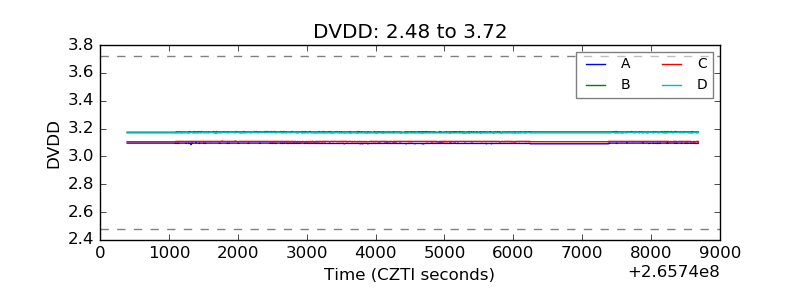 |
| Temperature 1 | 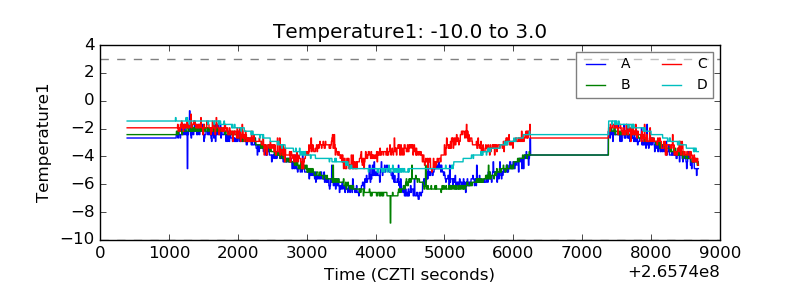 |
| Veto HV Monitor |  |
| Veto LLD | 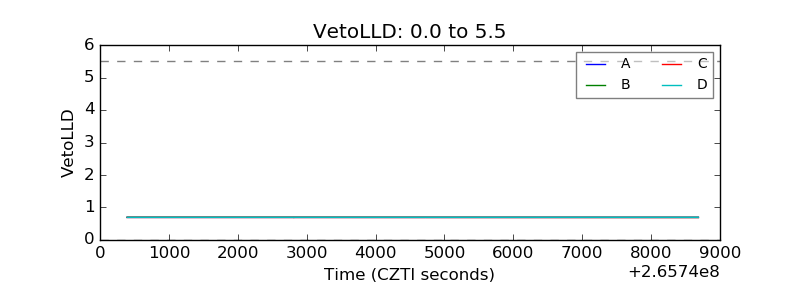 |
| Alpha Counter | 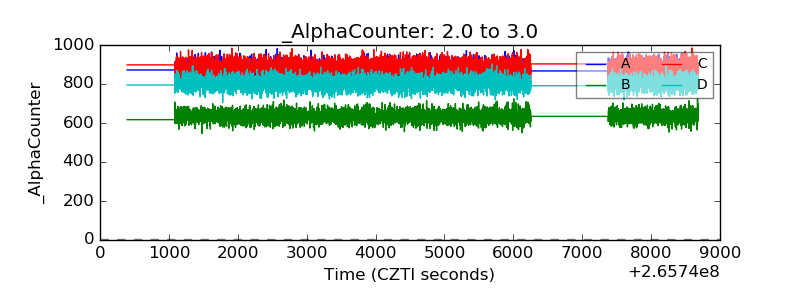 |
| _CPM_Rate | 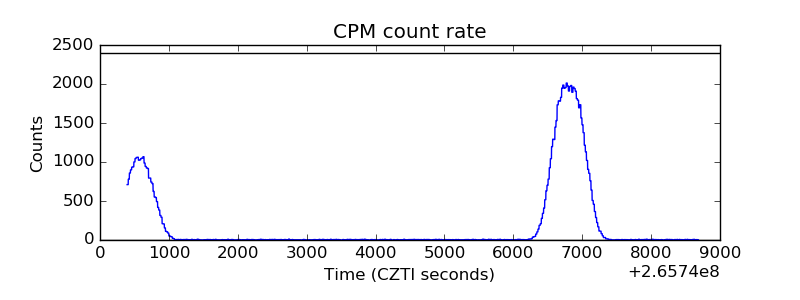 |
| CZT Counter | 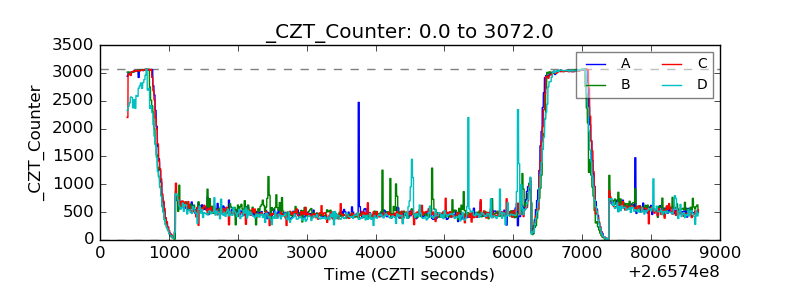 |
| +2.5 Volts monitor | 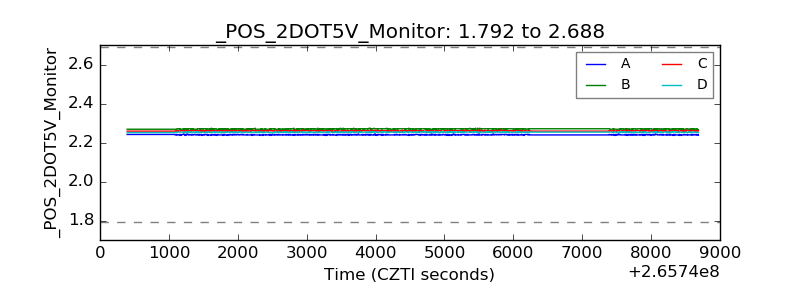 |
| +5 Volts monitor |  |
| _ROLL_ROT | 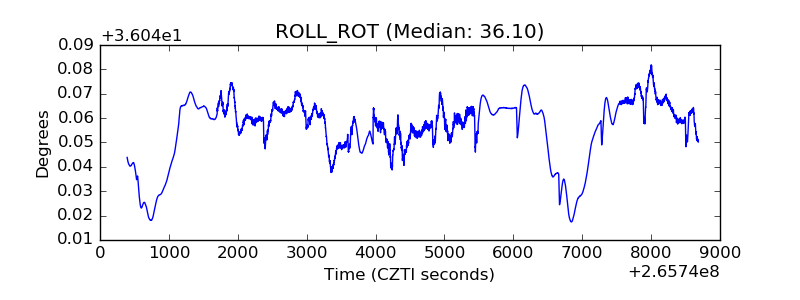 |
| _Roll_DEC | 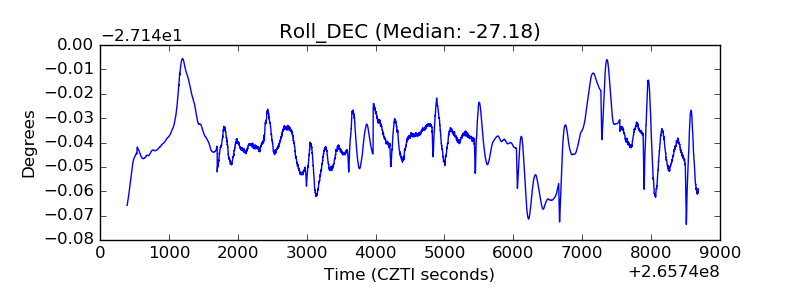 |
| _Roll_RA | 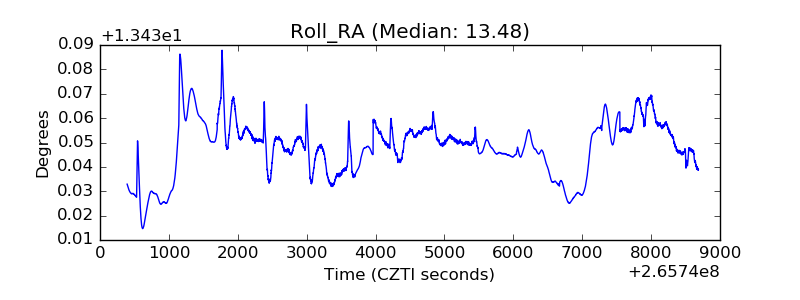 |
| Veto Counter | 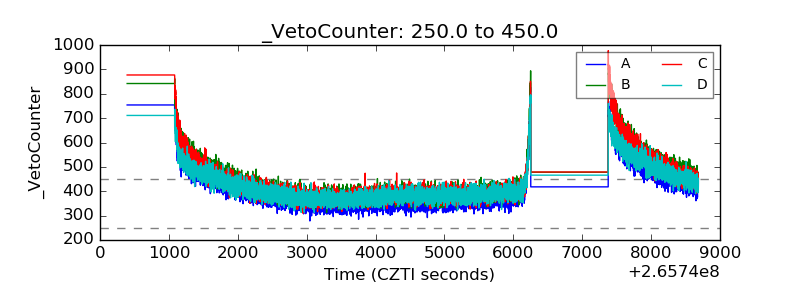 |