| Param | Original file | Final file |
|---|---|---|
| Filename | modeM0/AS1G08_066T01_9000002138_14501cztM0_level2.evt | modeM0/AS1G08_066T01_9000002138_14501cztM0_level2_quad_clean.evt |
| Size (bytes) | 460,788,480 | 70,617,600 |
| Size | 439.4 MB | 67.3 MB |
| Events in quadrant A | 3,231,150 | 438,690 |
| Events in quadrant B | 3,474,146 | 443,553 |
| Events in quadrant C | 3,198,839 | 433,273 |
| Events in quadrant D | 3,632,734 | 392,787 |
| Mode M9 | |||
|---|---|---|---|
| Quadrant | BADHDUFLAG | Total packets | Discarded packets |
| A | 0 | 20 | 0 |
| B | 0 | 20 | 0 |
| C | 0 | 20 | 0 |
| D | 0 | 21 | 0 |
| Mode SS | |||
|---|---|---|---|
| Quadrant | BADHDUFLAG | Total packets | Discarded packets |
| A | 0 | 124 | 0 |
| B | 0 | 124 | 0 |
| C | 0 | 124 | 0 |
| D | 0 | 124 | 0 |
| Mode M0 | |||
|---|---|---|---|
| Quadrant | BADHDUFLAG | Total packets | Discarded packets |
| A | 0 | 13499 | 3 |
| B | 0 | 14414 | 2 |
| C | 0 | 13290 | 2 |
| D | 0 | 14876 | 2 |
| Quadrant | Total seconds | Saturated seconds | Saturation percentage |
|---|---|---|---|
| A | 6160 | 39 | 0.633117% |
| B | 6160 | 79 | 1.282468% |
| C | 6160 | 27 | 0.438312% |
| D | 6160 | 360 | 5.844156% |
Noise dominated data is calculated using 1-second bins in cleaned event files. If a bin has >2000 counts, and if more than 50% of those come from <1% of pixels, then it is considered to be noise-dominated and hence unusable.
| Quadrant | # 1 sec bins | Bins with >0 counts | Bins with >2000 counts | High rate bins dominated by noise | Noise dominated (total time) | Noise dominated (detector-on time) | Marked lightcurve |
|---|---|---|---|---|---|---|---|
| A | 7411 | 6162 | 0 | 0 | 0.00% | 0.00% |  |
| B | 7411 | 6162 | 8 | 8 | 0.11% | 0.13% |  |
| C | 7411 | 6162 | 2 | 2 | 0.03% | 0.03% |  |
| D | 7411 | 6162 | 174 | 174 | 2.35% | 2.82% |  |
Top three noisy pixels from each quadrant. If the there are fewer than three noisy pixels in the level2.evt file, extra rows are filled as -1
| Pixel properties | Quadrant properties | ||||||
|---|---|---|---|---|---|---|---|
| Quadrant | DetID | PixID | Counts | Sigma | Mean | Median | Sigma |
| A | 12 | 189 | 118663 | 732.93 | 802 | 785 | 160.8 |
| A | 8 | 15 | 10133 | 58.12 | 802 | 785 | 160.8 |
| A | 3 | 1 | 10112 | 57.99 | 802 | 785 | 160.8 |
| B | 5 | 29 | 116695 | 771.6 | 802 | 783 | 150.2 |
| B | 0 | 189 | 51842 | 339.89 | 802 | 783 | 150.2 |
| B | 0 | 219 | 32339 | 210.06 | 802 | 783 | 150.2 |
| C | 3 | 233 | 137098 | 772.54 | 776 | 783 | 176.4 |
| C | 0 | 207 | 21271 | 116.11 | 776 | 783 | 176.4 |
| C | 5 | 37 | 14371 | 77.01 | 776 | 783 | 176.4 |
| D | 10 | 199 | 729444 | 4092.37 | 746 | 728 | 178.1 |
| D | 2 | 234 | 22543 | 122.51 | 746 | 728 | 178.1 |
| D | 15 | 0 | 18584 | 100.28 | 746 | 728 | 178.1 |
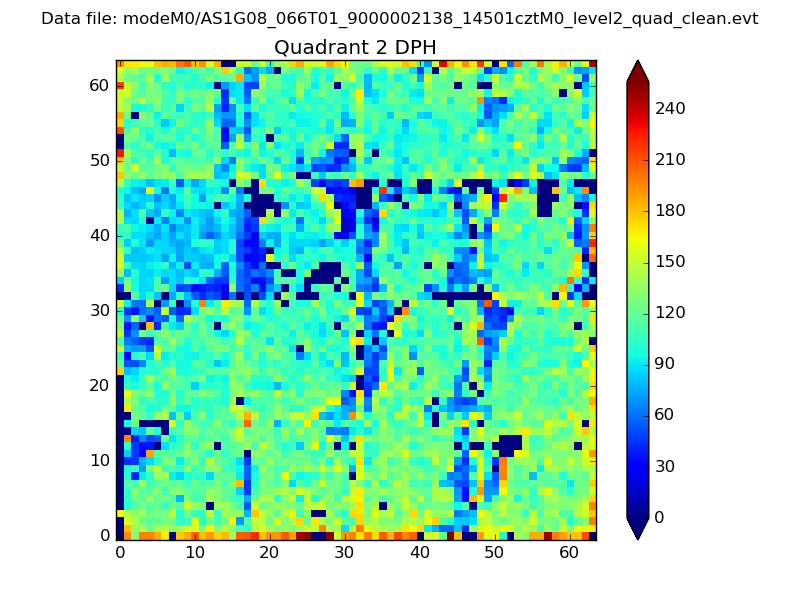
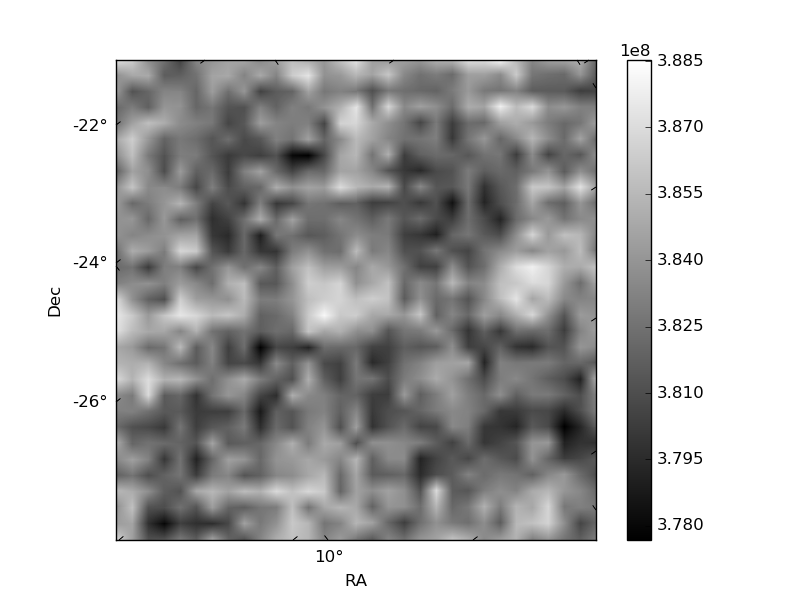
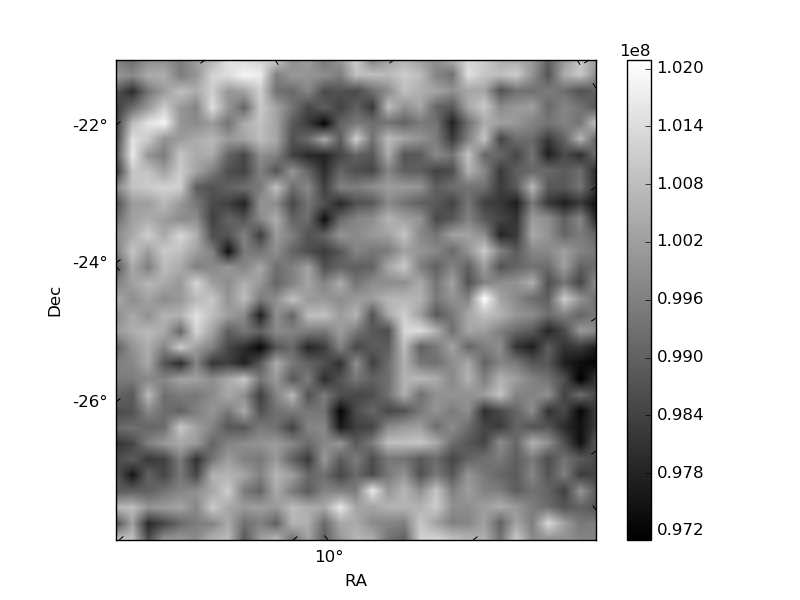
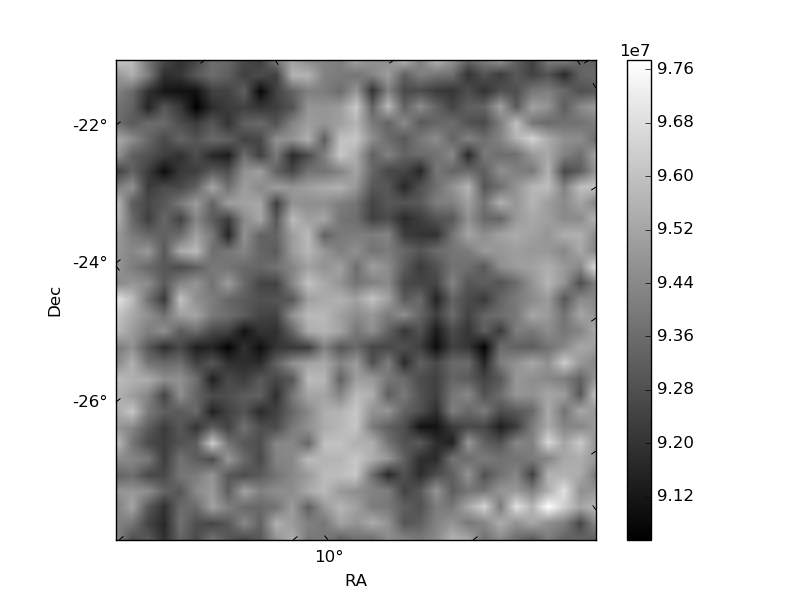
Histogram calculated using DETX and DETY for each event in the final _common_clean file
| Quadrant A |  |
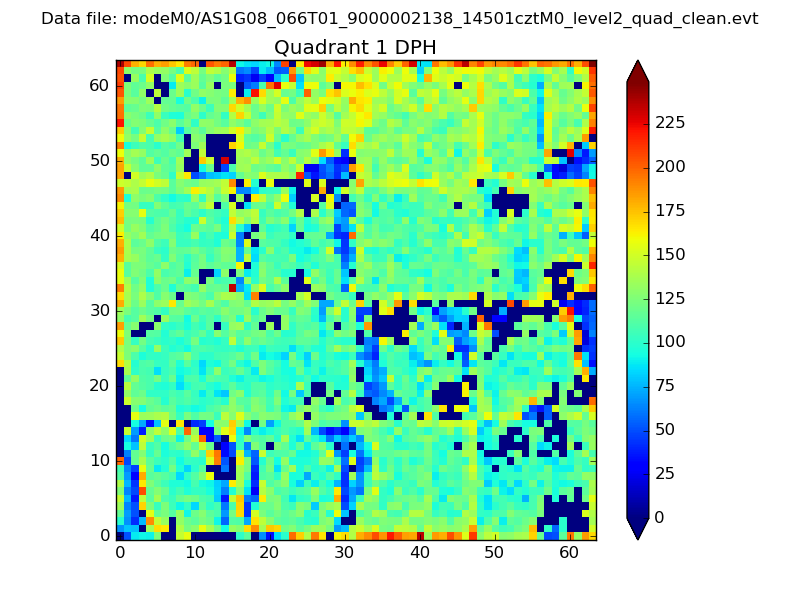 |
Quadrant B |
|---|---|---|---|
| Quadrant D | 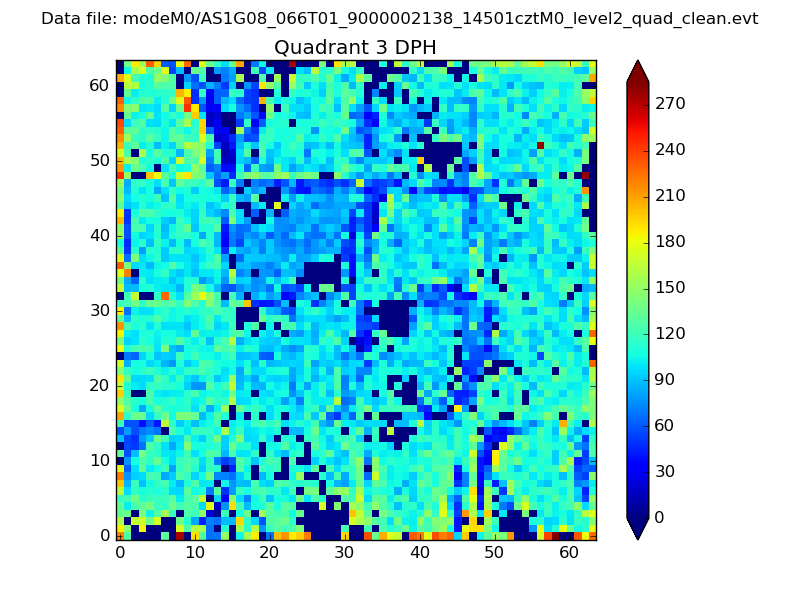 |
 |
Quadrant C |
| Plot type | Count rate plots | Images |
|---|---|---|
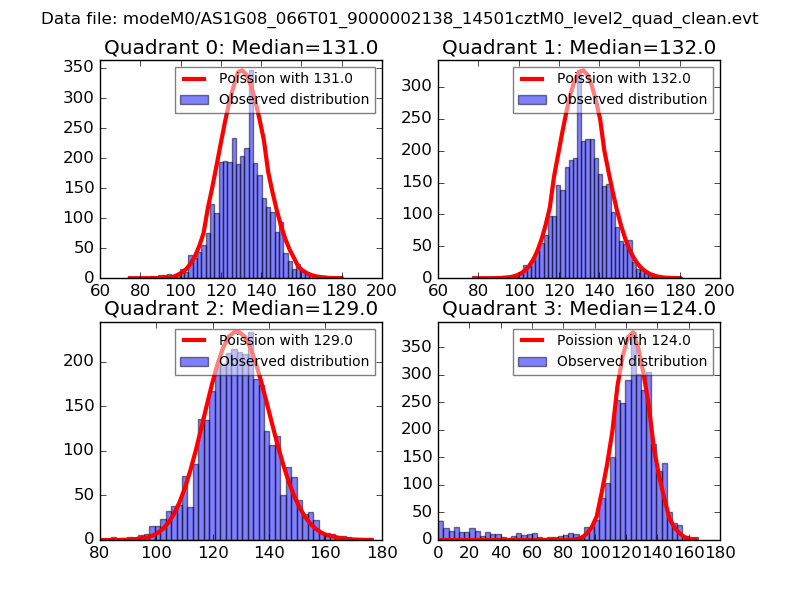
| Comparison with Poisson distribution Blue bars denote a histogram of data divided into 1 sec bins. Red curve is a Poisson curve with rate = median count rate of data. |
 |
 |
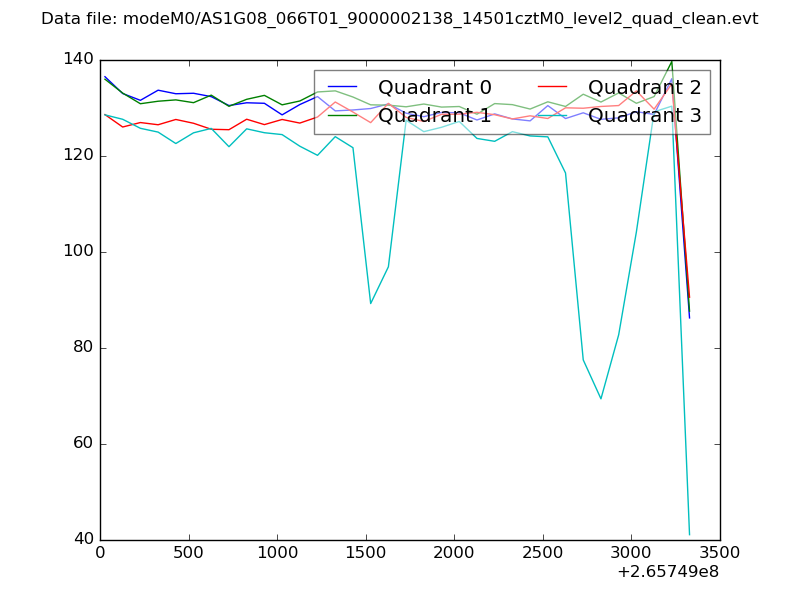
| Quadrant-wise count rates Data is divided into 100 sec bins |
 |
|
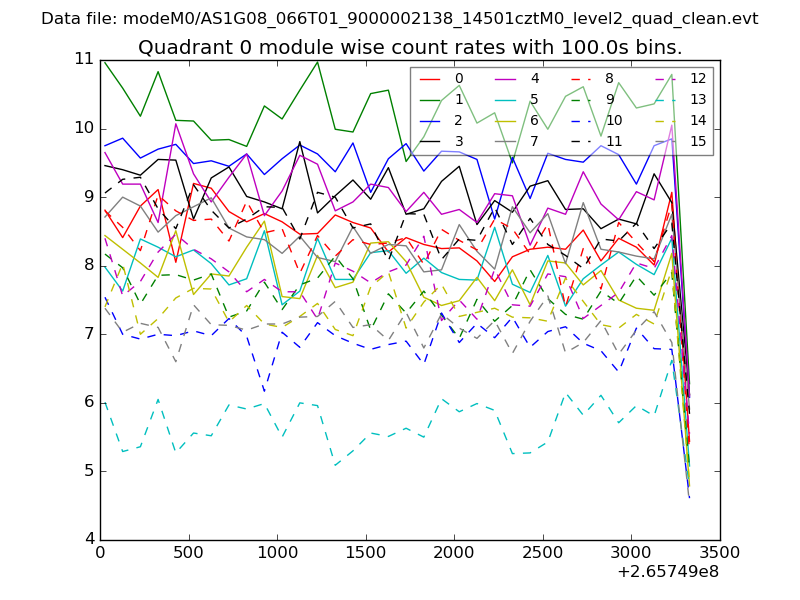
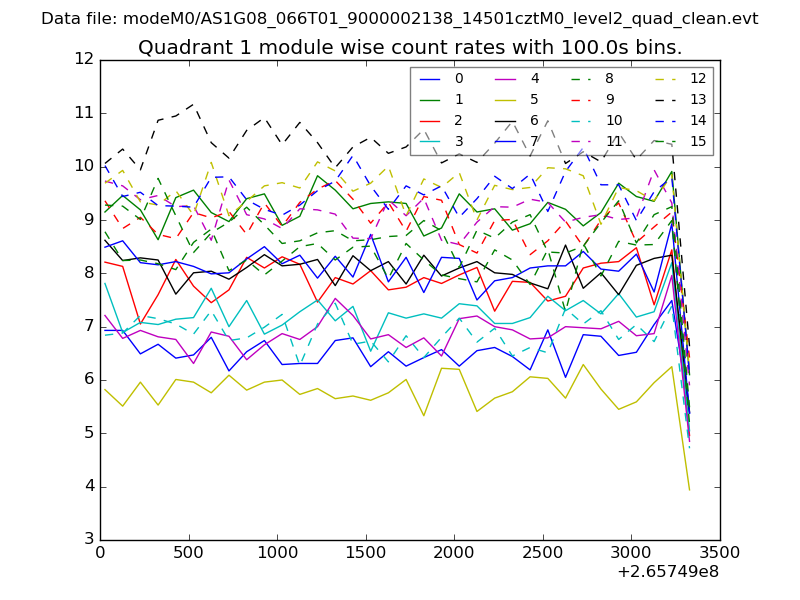
| Module-wise count rates for Quadrant A Data is divided into 100 sec bins |
 |
 |
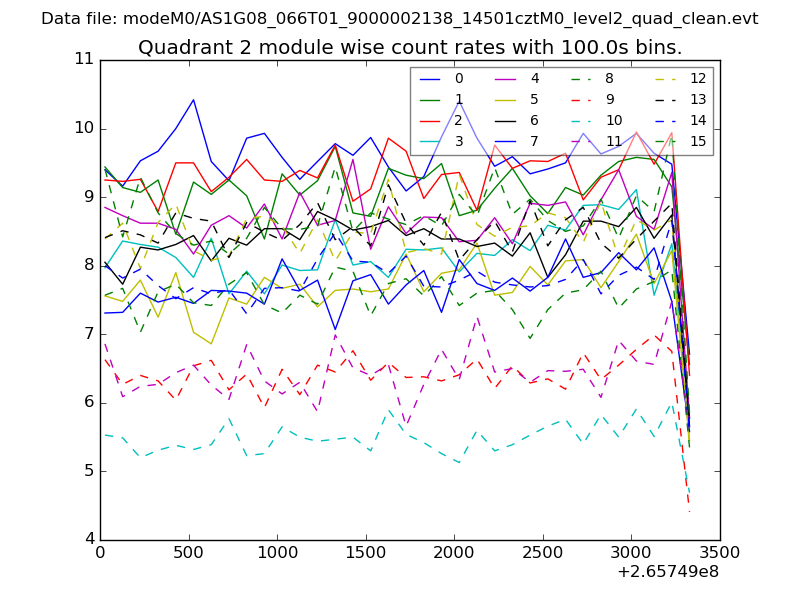
| Module-wise count rates for Quadrant B Data is divided into 100 sec bins |
 |
 |
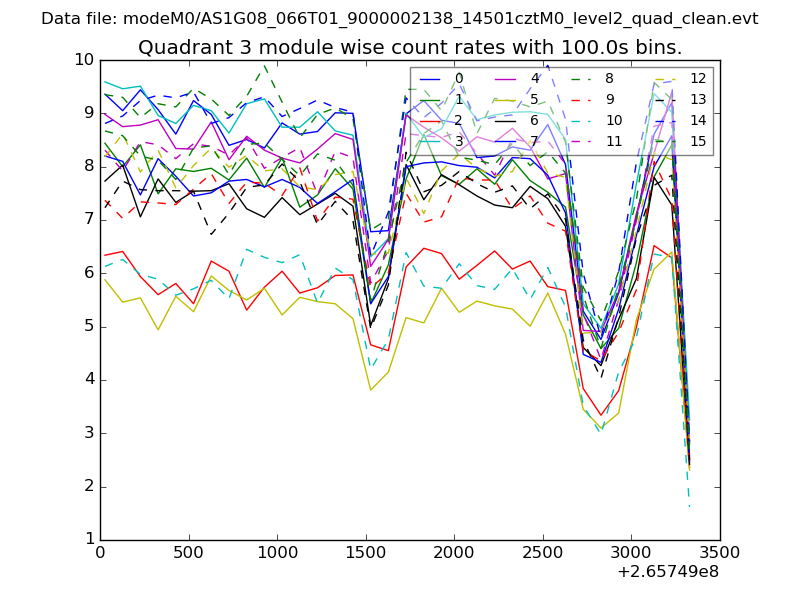
| Module-wise count rates for Quadrant C Data is divided into 100 sec bins |
 |
 |
| Module-wise count rates for Quadrant D Data is divided into 100 sec bins |
 |
 |
| Parameter | Plot |
|---|---|
| CZT HV Monitor | 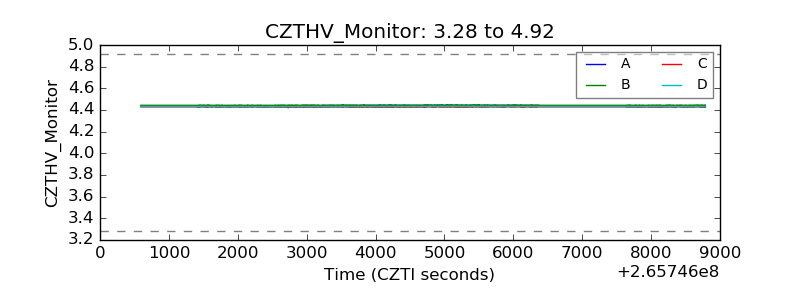 |
| D_VDD | 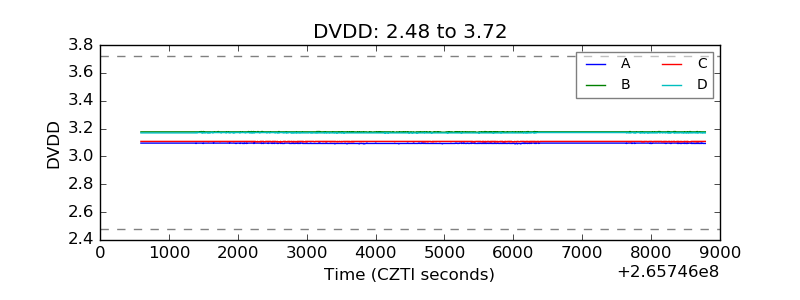 |
| Temperature 1 | 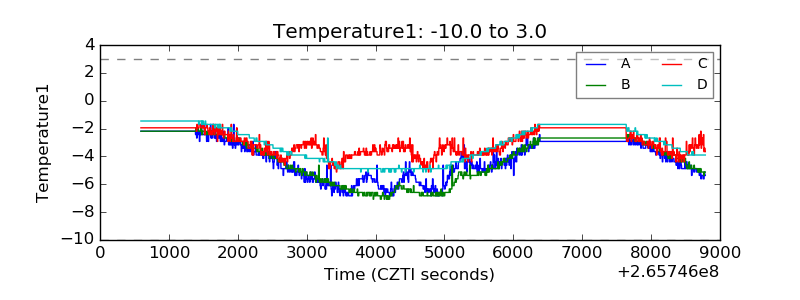 |
| Veto HV Monitor | 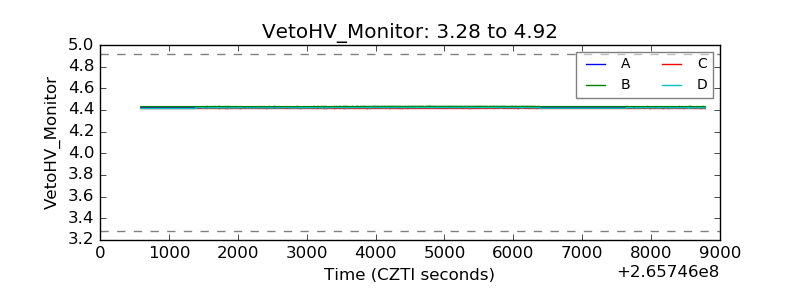 |
| Veto LLD |  |
| Alpha Counter |  |
| _CPM_Rate | 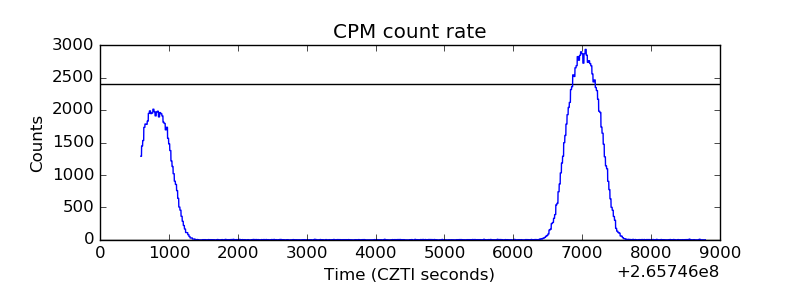 |
| CZT Counter | 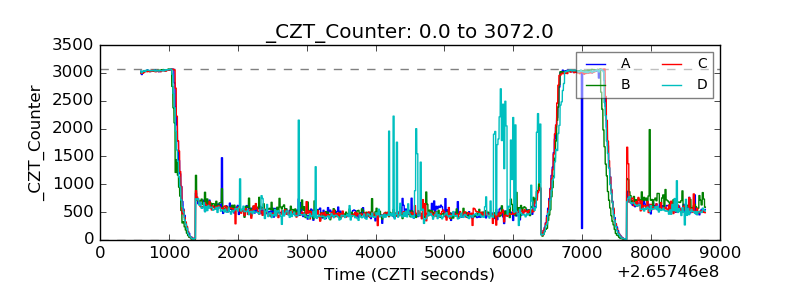 |
| +2.5 Volts monitor |  |
| +5 Volts monitor |  |
| _ROLL_ROT | 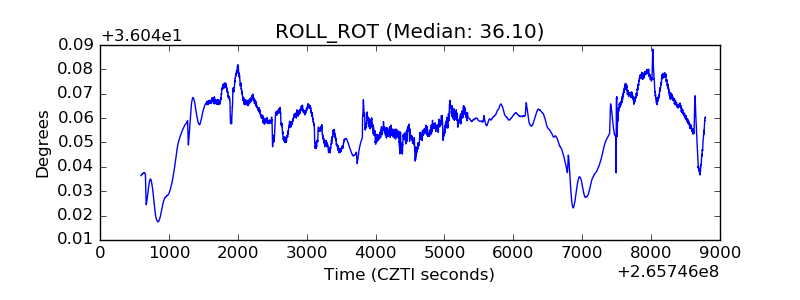 |
| _Roll_DEC | 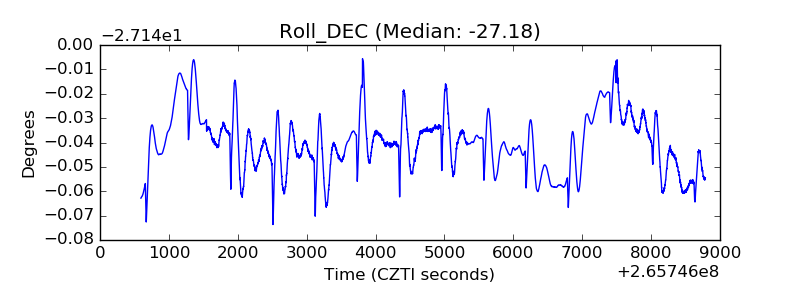 |
| _Roll_RA | 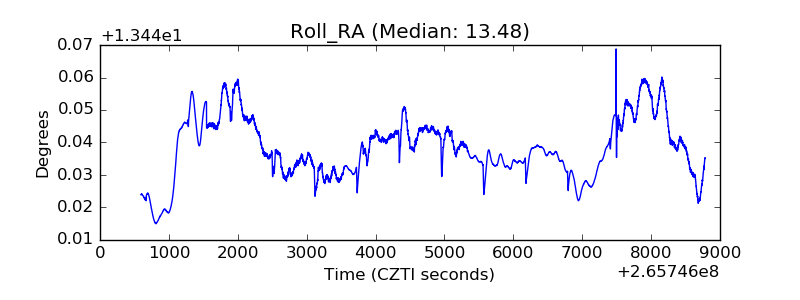 |
| Veto Counter | 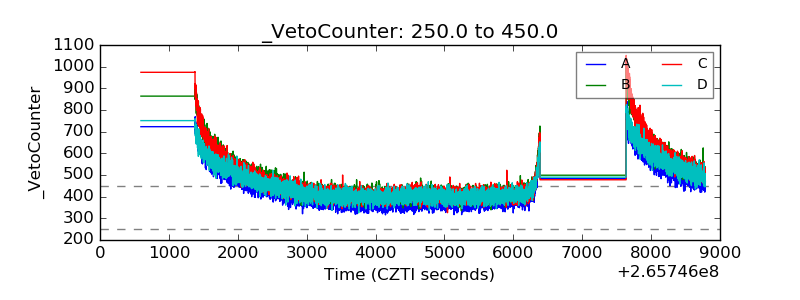 |