| Param | Original file | Final file |
|---|---|---|
| Filename | modeM0/AS1G08_066T01_9000002138_14502cztM0_level2.evt | modeM0/AS1G08_066T01_9000002138_14502cztM0_level2_quad_clean.evt |
| Size (bytes) | 466,464,960 | 88,326,720 |
| Size | 444.9 MB | 84.2 MB |
| Events in quadrant A | 3,255,954 | 564,477 |
| Events in quadrant B | 3,726,014 | 575,144 |
| Events in quadrant C | 3,467,176 | 562,944 |
| Events in quadrant D | 3,258,894 | 541,444 |
| Mode M9 | |||
|---|---|---|---|
| Quadrant | BADHDUFLAG | Total packets | Discarded packets |
| A | 0 | 21 | 0 |
| B | 0 | 21 | 0 |
| C | 0 | 21 | 0 |
| D | 0 | 22 | 0 |
| Mode SS | |||
|---|---|---|---|
| Quadrant | BADHDUFLAG | Total packets | Discarded packets |
| A | 0 | 126 | 0 |
| B | 0 | 126 | 0 |
| C | 0 | 126 | 0 |
| D | 0 | 126 | 0 |
| Mode M0 | |||
|---|---|---|---|
| Quadrant | BADHDUFLAG | Total packets | Discarded packets |
| A | 0 | 13566 | 3 |
| B | 0 | 15283 | 2 |
| C | 0 | 14036 | 2 |
| D | 0 | 13595 | 2 |
| Quadrant | Total seconds | Saturated seconds | Saturation percentage |
|---|---|---|---|
| A | 6169 | 68 | 1.102286% |
| B | 6169 | 131 | 2.123521% |
| C | 6169 | 58 | 0.940185% |
| D | 6169 | 93 | 1.507538% |
Noise dominated data is calculated using 1-second bins in cleaned event files. If a bin has >2000 counts, and if more than 50% of those come from <1% of pixels, then it is considered to be noise-dominated and hence unusable.
| Quadrant | # 1 sec bins | Bins with >0 counts | Bins with >2000 counts | High rate bins dominated by noise | Noise dominated (total time) | Noise dominated (detector-on time) | Marked lightcurve |
|---|---|---|---|---|---|---|---|
| A | 7480 | 6171 | 0 | 0 | 0.00% | 0.00% | 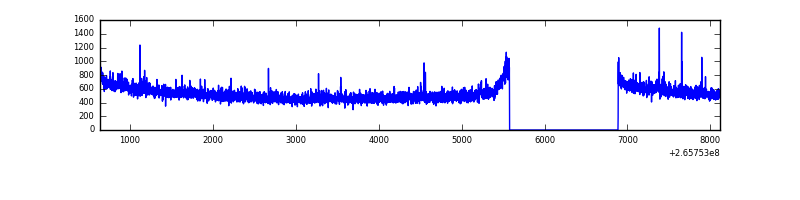 |
| B | 7480 | 6171 | 29 | 29 | 0.39% | 0.47% | 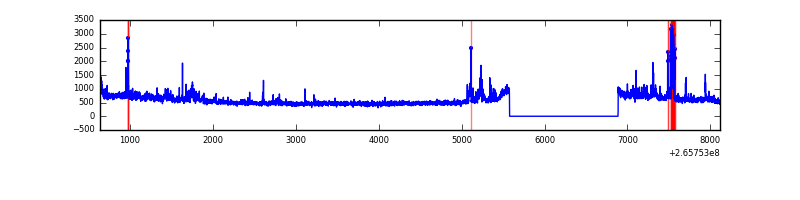 |
| C | 7480 | 6171 | 8 | 8 | 0.11% | 0.13% | 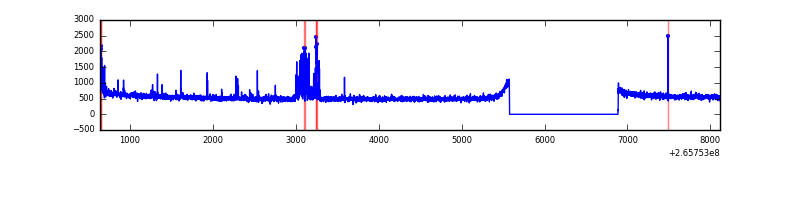 |
| D | 7480 | 6171 | 30 | 30 | 0.40% | 0.49% | 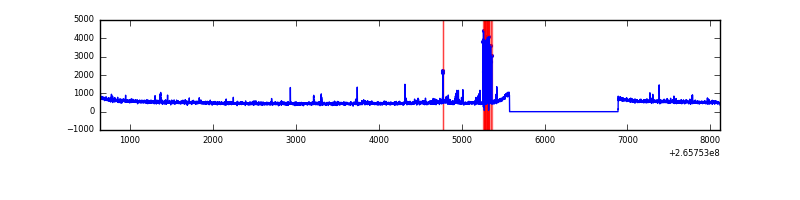 |
Top three noisy pixels from each quadrant. If the there are fewer than three noisy pixels in the level2.evt file, extra rows are filled as -1
| Pixel properties | Quadrant properties | ||||||
|---|---|---|---|---|---|---|---|
| Quadrant | DetID | PixID | Counts | Sigma | Mean | Median | Sigma |
| A | 12 | 189 | 53511 | 320.39 | 824 | 810 | 164.5 |
| A | 8 | 15 | 11177 | 63.02 | 824 | 810 | 164.5 |
| A | 0 | 226 | 7550 | 40.97 | 824 | 810 | 164.5 |
| B | 5 | 29 | 201490 | 1317.23 | 825 | 808 | 152.4 |
| B | 4 | 142 | 92929 | 604.66 | 825 | 808 | 152.4 |
| B | 10 | 249 | 54143 | 350.08 | 825 | 808 | 152.4 |
| C | 0 | 207 | 156424 | 848.12 | 807 | 815 | 183.5 |
| C | 3 | 233 | 139862 | 757.85 | 807 | 815 | 183.5 |
| C | 5 | 37 | 21873 | 114.77 | 807 | 815 | 183.5 |
| D | 10 | 199 | 173189 | 919.59 | 797 | 780 | 187.5 |
| D | 2 | 234 | 20125 | 103.18 | 797 | 780 | 187.5 |
| D | 2 | 152 | 18517 | 94.6 | 797 | 780 | 187.5 |
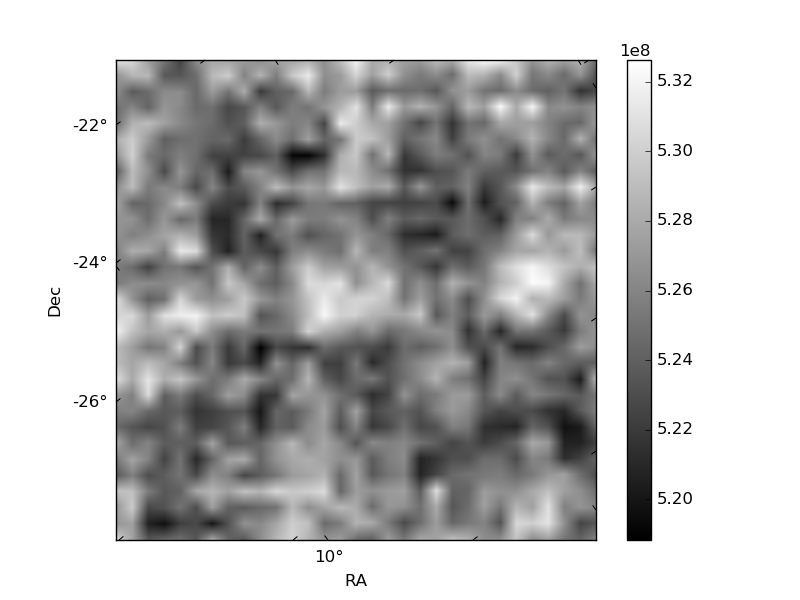
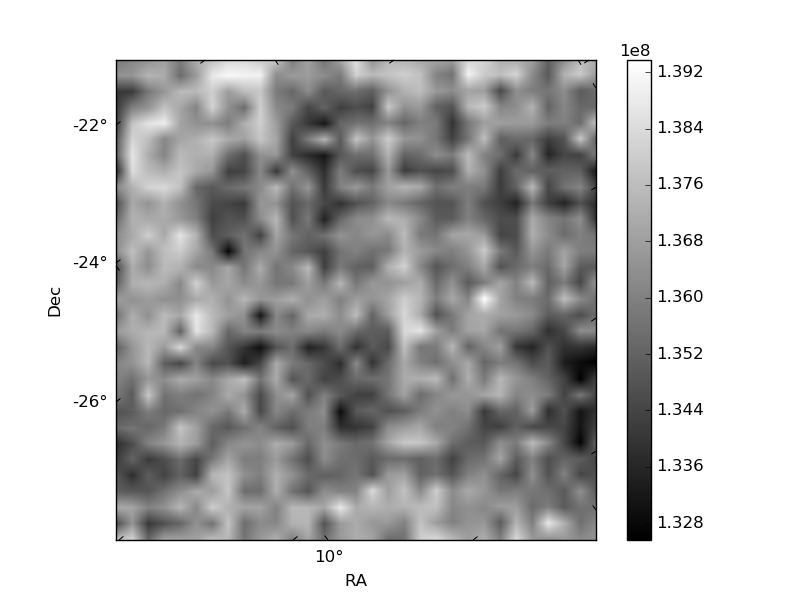
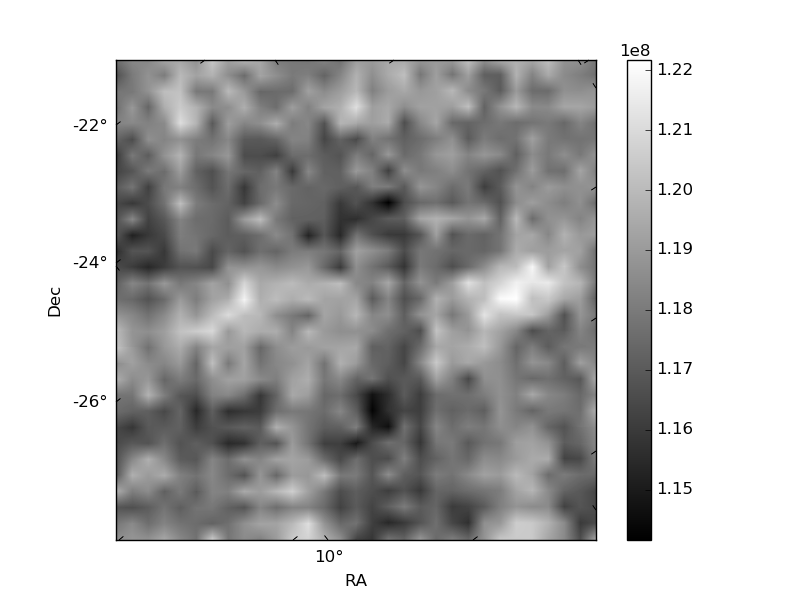
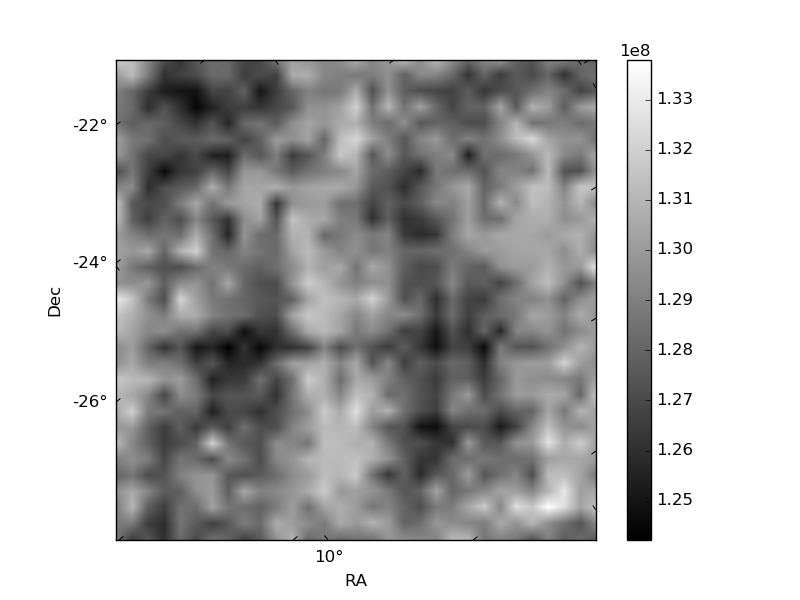
Histogram calculated using DETX and DETY for each event in the final _common_clean file
| Quadrant A | 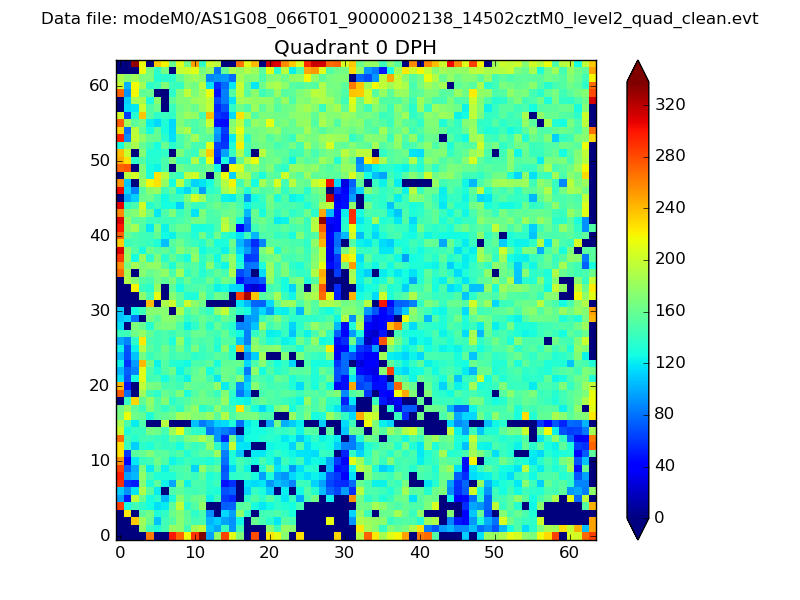 |
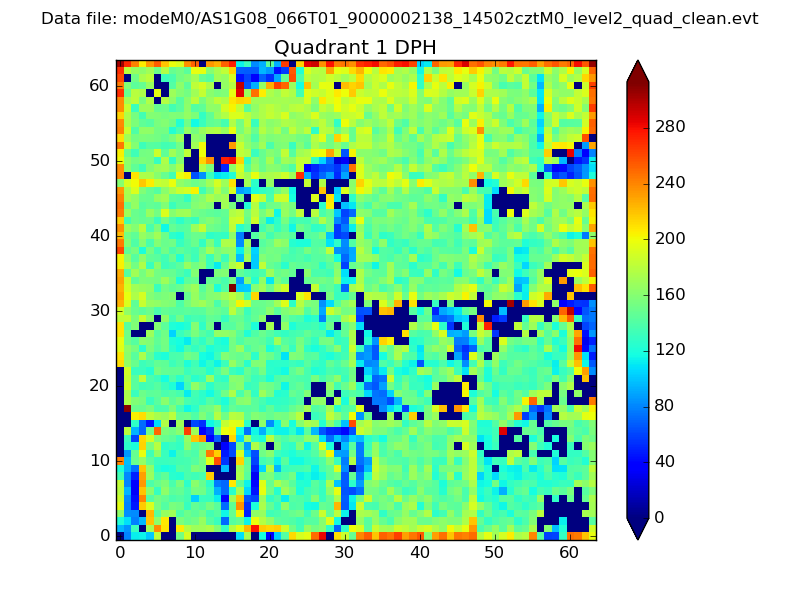 |
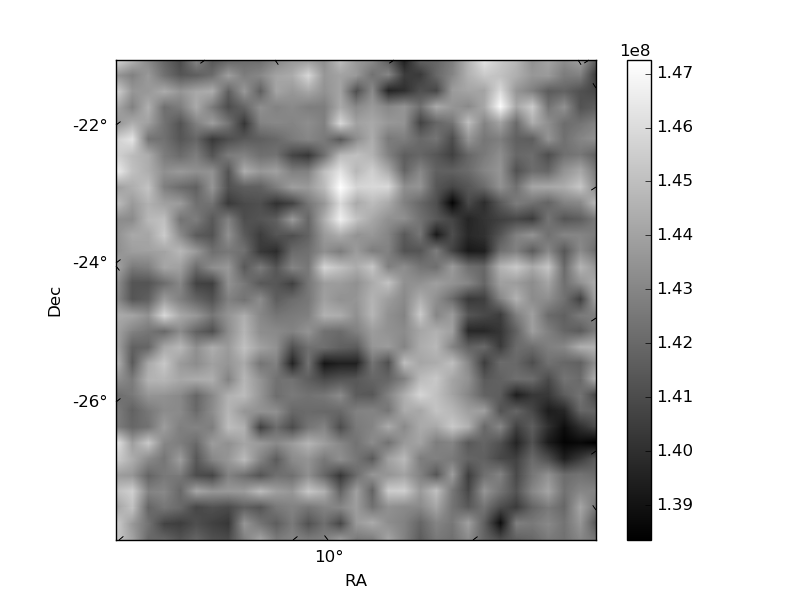
Quadrant B |
|---|---|---|---|
| Quadrant D | 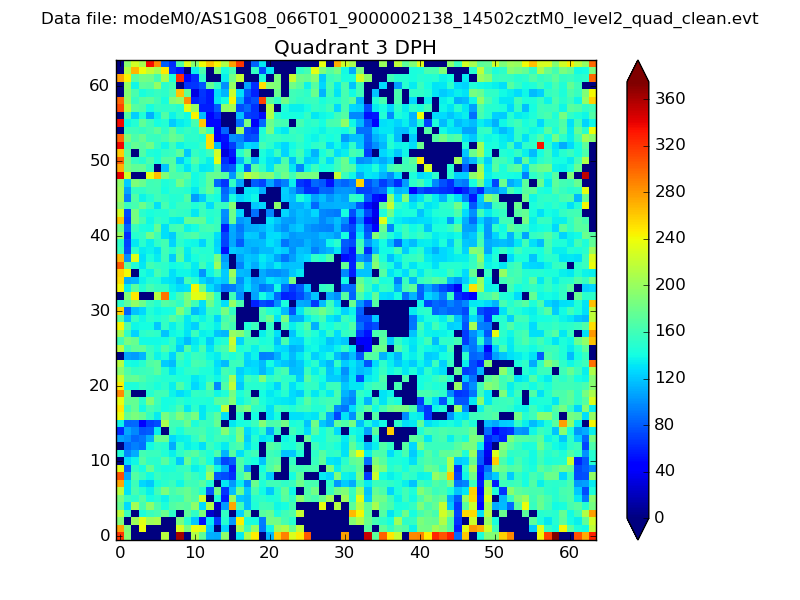 |
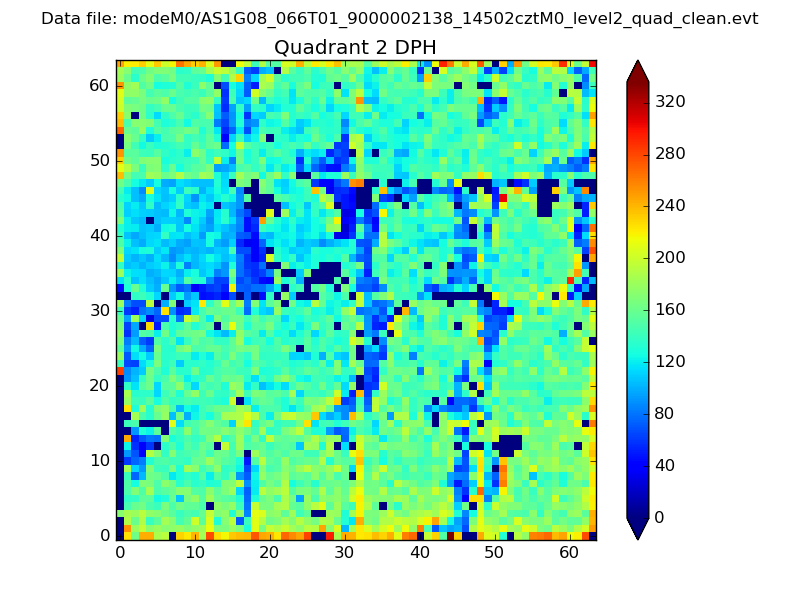 |
Quadrant C |
| Plot type | Count rate plots | Images |
|---|---|---|
| Comparison with Poisson distribution Blue bars denote a histogram of data divided into 1 sec bins. Red curve is a Poisson curve with rate = median count rate of data. |
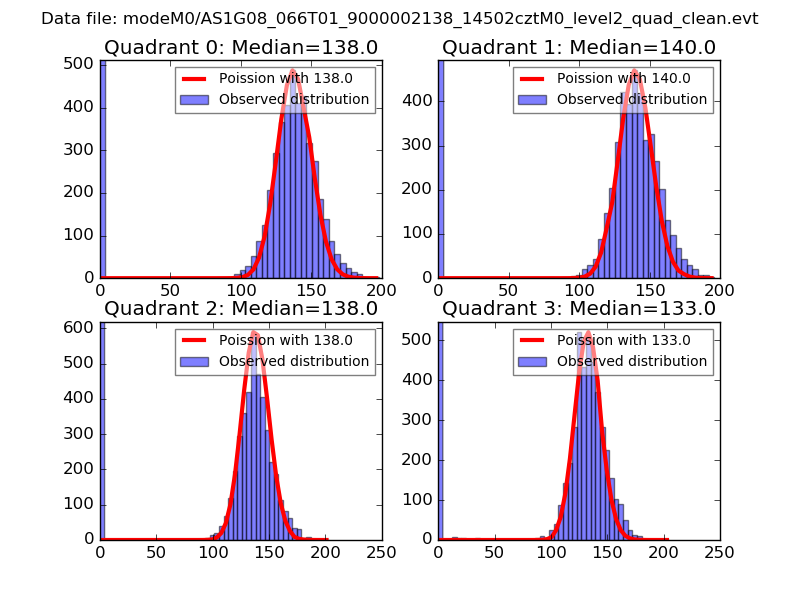 |
 |
| Quadrant-wise count rates Data is divided into 100 sec bins |
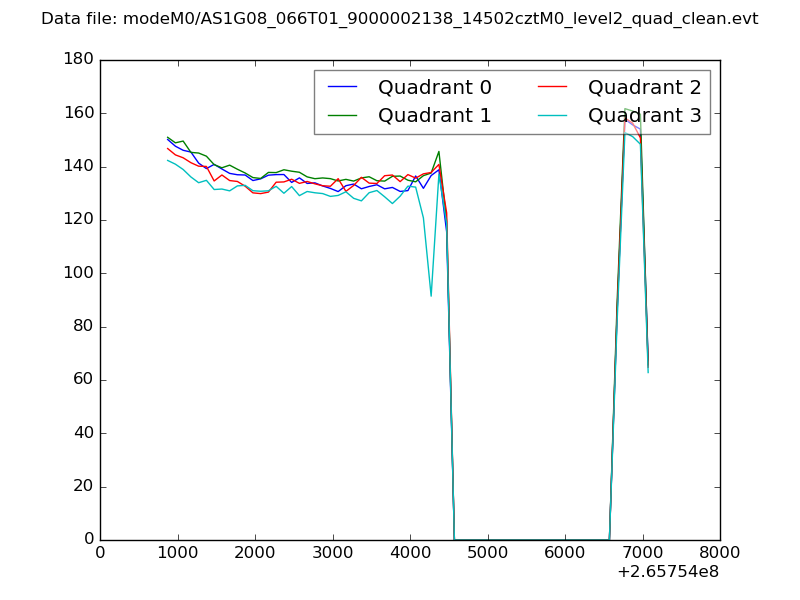 |
|
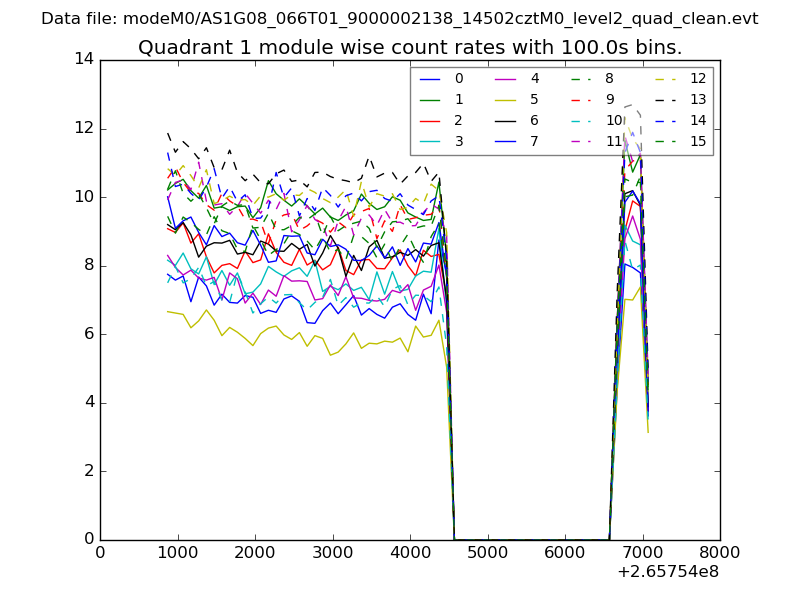
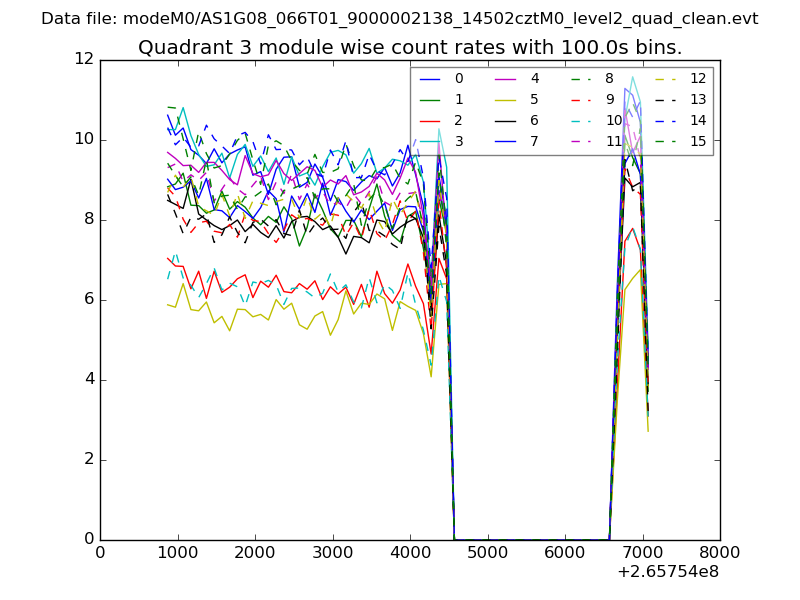
| Module-wise count rates for Quadrant A Data is divided into 100 sec bins |
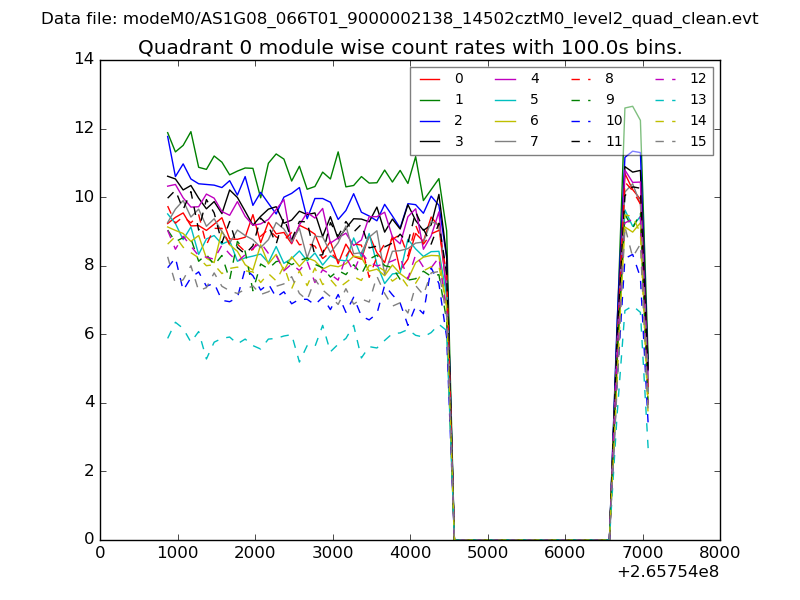 |
 |
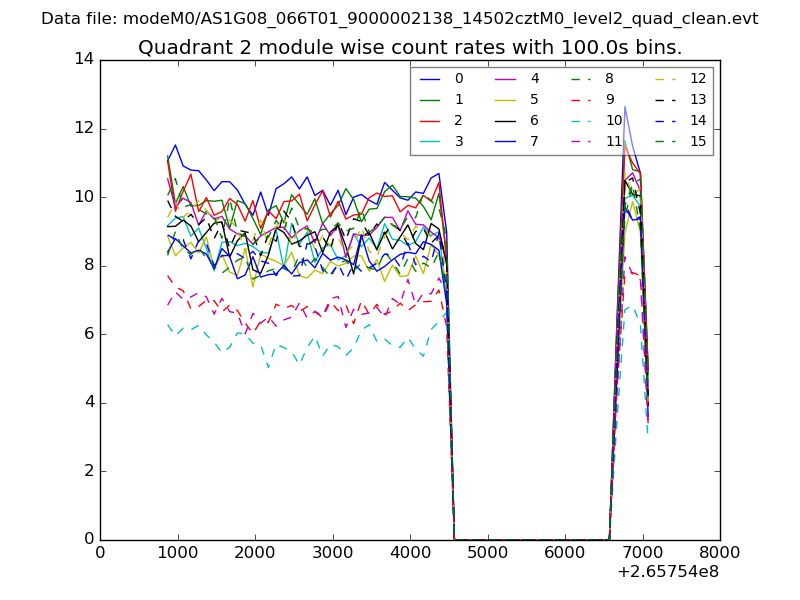
| Module-wise count rates for Quadrant B Data is divided into 100 sec bins |
 |
 |
| Module-wise count rates for Quadrant C Data is divided into 100 sec bins |
 |
 |
| Module-wise count rates for Quadrant D Data is divided into 100 sec bins |
 |
 |
| Parameter | Plot |
|---|---|
| CZT HV Monitor | 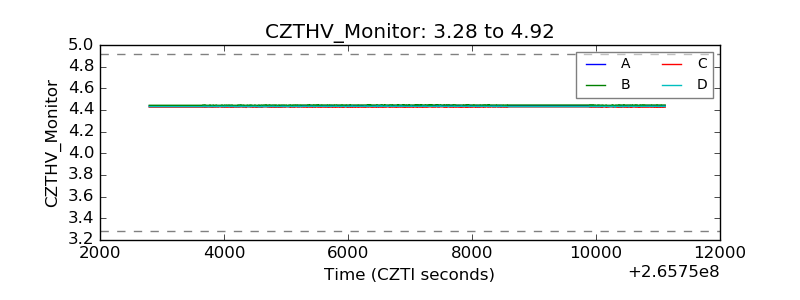 |
| D_VDD | 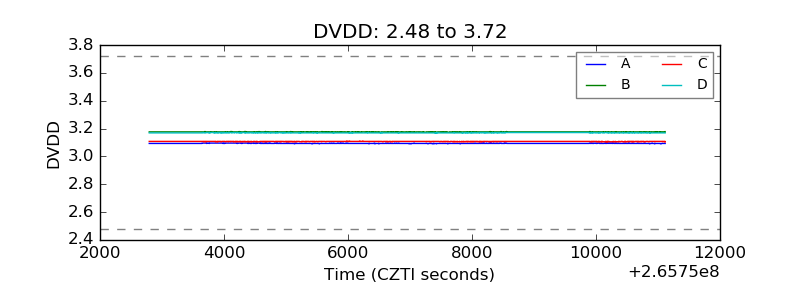 |
| Temperature 1 | 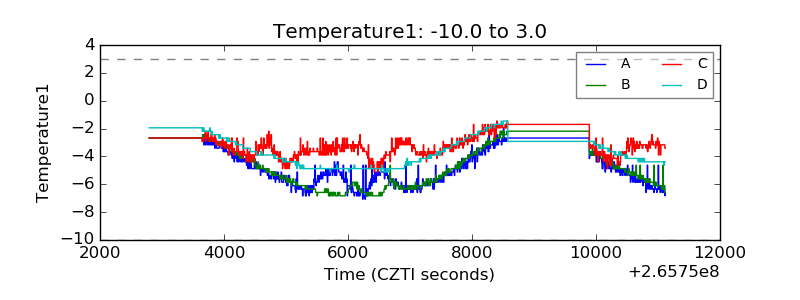 |
| Veto HV Monitor | 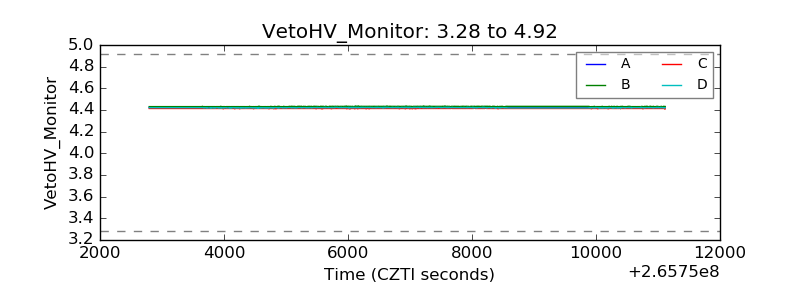 |
| Veto LLD | 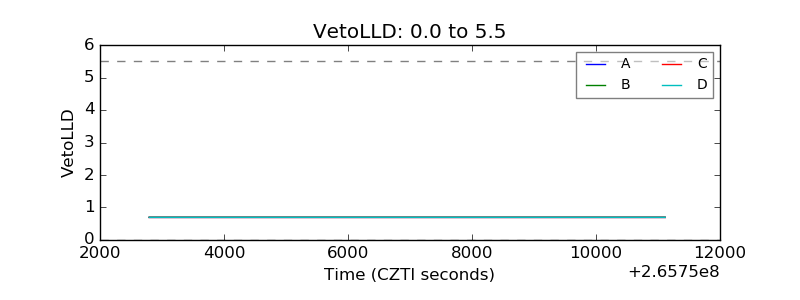 |
| Alpha Counter | 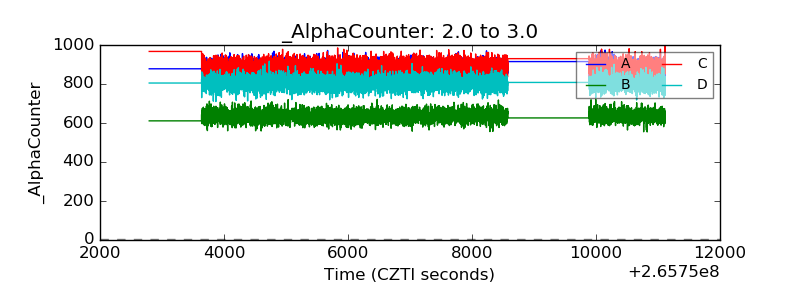 |
| _CPM_Rate | 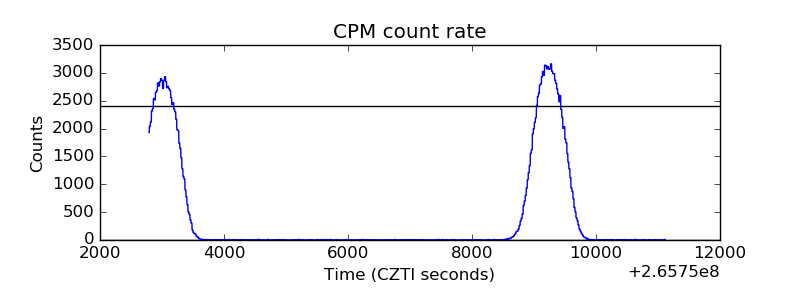 |
| CZT Counter | 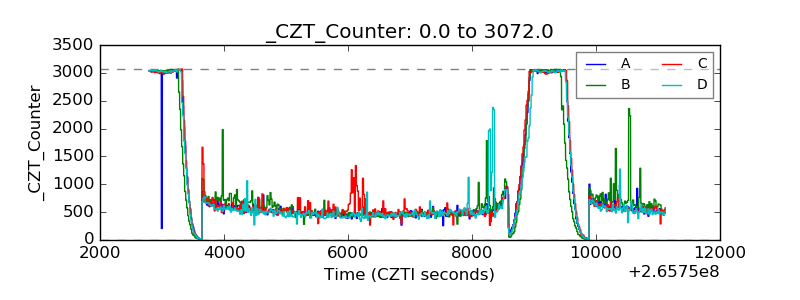 |
| +2.5 Volts monitor | 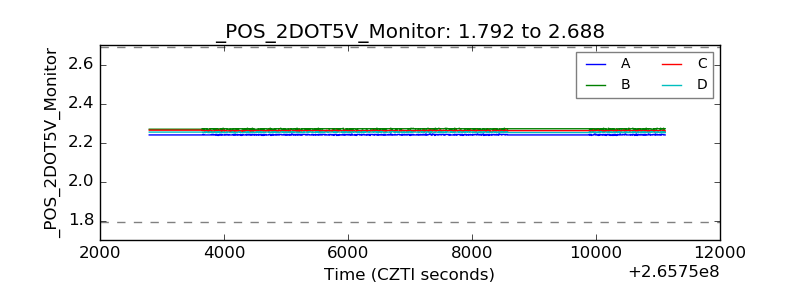 |
| +5 Volts monitor |  |
| _ROLL_ROT | 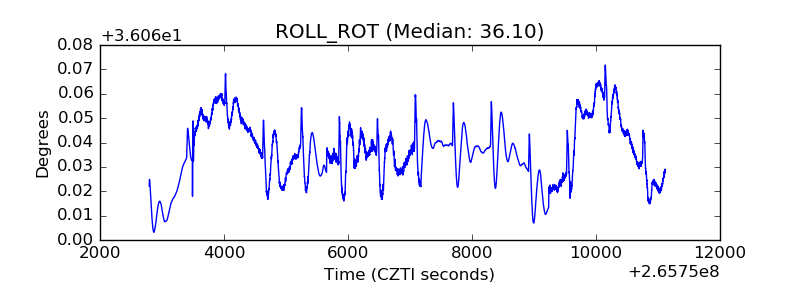 |
| _Roll_DEC | 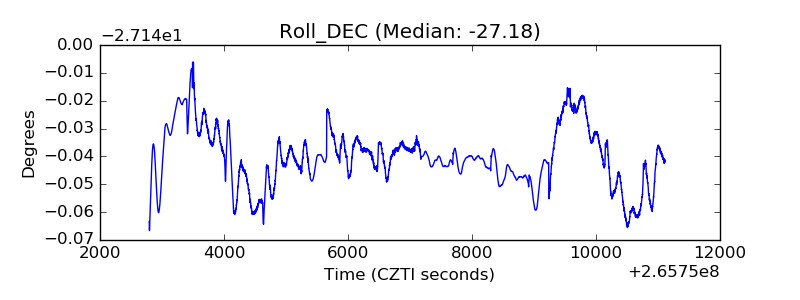 |
| _Roll_RA | 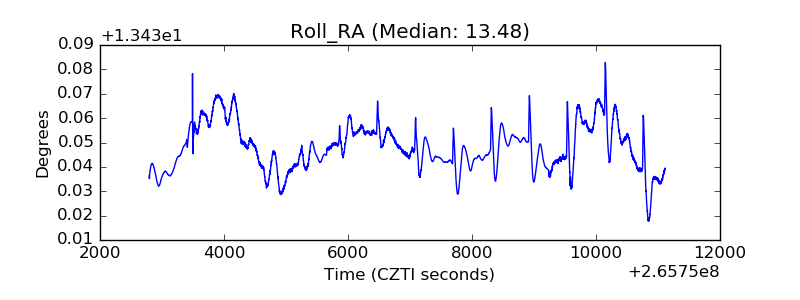 |
| Veto Counter | 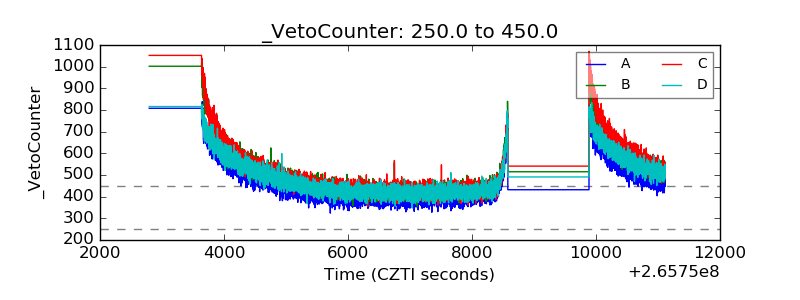 |