| Param | Original file | Final file |
|---|---|---|
| Filename | modeM0/AS1G08_066T01_9000002138_14503cztM0_level2.evt | modeM0/AS1G08_066T01_9000002138_14503cztM0_level2_quad_clean.evt |
| Size (bytes) | 509,005,440 | 97,856,640 |
| Size | 485.4 MB | 93.3 MB |
| Events in quadrant A | 3,202,444 | 649,271 |
| Events in quadrant B | 3,610,344 | 664,223 |
| Events in quadrant C | 3,323,692 | 654,841 |
| Events in quadrant D | 4,859,369 | 563,510 |
| Mode M9 | |||
|---|---|---|---|
| Quadrant | BADHDUFLAG | Total packets | Discarded packets |
| A | 0 | 19 | 0 |
| B | 0 | 19 | 0 |
| C | 0 | 19 | 0 |
| D | 0 | 20 | 0 |
| Mode SS | |||
|---|---|---|---|
| Quadrant | BADHDUFLAG | Total packets | Discarded packets |
| A | 0 | 126 | 0 |
| B | 0 | 126 | 0 |
| C | 0 | 126 | 0 |
| D | 0 | 126 | 0 |
| Mode M0 | |||
|---|---|---|---|
| Quadrant | BADHDUFLAG | Total packets | Discarded packets |
| A | 0 | 13364 | 3 |
| B | 0 | 14653 | 2 |
| C | 0 | 13471 | 2 |
| D | 0 | 18295 | 2 |
| Quadrant | Total seconds | Saturated seconds | Saturation percentage |
|---|---|---|---|
| A | 6180 | 39 | 0.631068% |
| B | 6180 | 107 | 1.731392% |
| C | 6180 | 30 | 0.485437% |
| D | 6180 | 787 | 12.734628% |
Noise dominated data is calculated using 1-second bins in cleaned event files. If a bin has >2000 counts, and if more than 50% of those come from <1% of pixels, then it is considered to be noise-dominated and hence unusable.
| Quadrant | # 1 sec bins | Bins with >0 counts | Bins with >2000 counts | High rate bins dominated by noise | Noise dominated (total time) | Noise dominated (detector-on time) | Marked lightcurve |
|---|---|---|---|---|---|---|---|
| A | 7566 | 6182 | 1 | 1 | 0.01% | 0.02% | 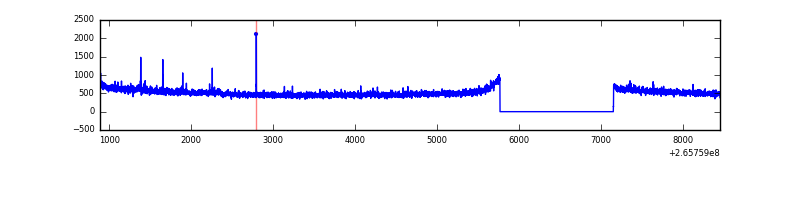 |
| B | 7566 | 6182 | 26 | 26 | 0.34% | 0.42% | 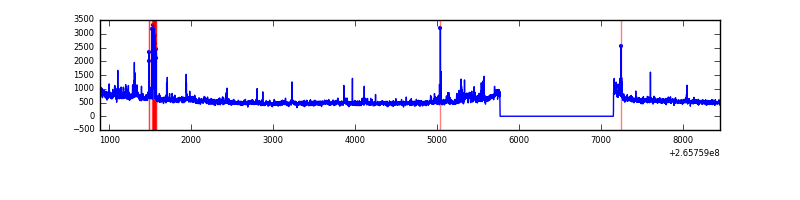 |
| C | 7566 | 6182 | 1 | 1 | 0.01% | 0.02% | 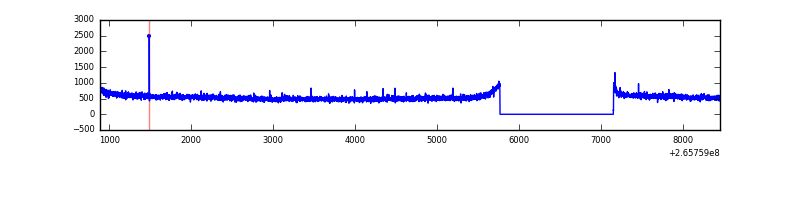 |
| D | 7566 | 6181 | 489 | 489 | 6.46% | 7.91% | 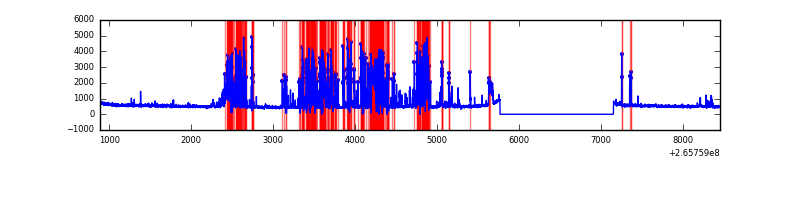 |
Top three noisy pixels from each quadrant. If the there are fewer than three noisy pixels in the level2.evt file, extra rows are filled as -1
| Pixel properties | Quadrant properties | ||||||
|---|---|---|---|---|---|---|---|
| Quadrant | DetID | PixID | Counts | Sigma | Mean | Median | Sigma |
| A | 12 | 189 | 26272 | 154.33 | 818 | 801 | 165.0 |
| A | 8 | 15 | 10507 | 58.81 | 818 | 801 | 165.0 |
| A | 4 | 2 | 9525 | 52.86 | 818 | 801 | 165.0 |
| B | 5 | 29 | 129850 | 848.04 | 821 | 804 | 152.2 |
| B | 4 | 142 | 82524 | 537.03 | 821 | 804 | 152.2 |
| B | 10 | 245 | 47736 | 308.42 | 821 | 804 | 152.2 |
| C | 3 | 233 | 118587 | 631.85 | 811 | 816 | 186.4 |
| C | 5 | 37 | 22360 | 115.58 | 811 | 816 | 186.4 |
| C | 0 | 207 | 15993 | 81.42 | 811 | 816 | 186.4 |
| D | 10 | 199 | 1754734 | 9829.42 | 745 | 729 | 178.4 |
| D | 12 | 110 | 148253 | 826.72 | 745 | 729 | 178.4 |
| D | 13 | 122 | 88107 | 489.66 | 745 | 729 | 178.4 |
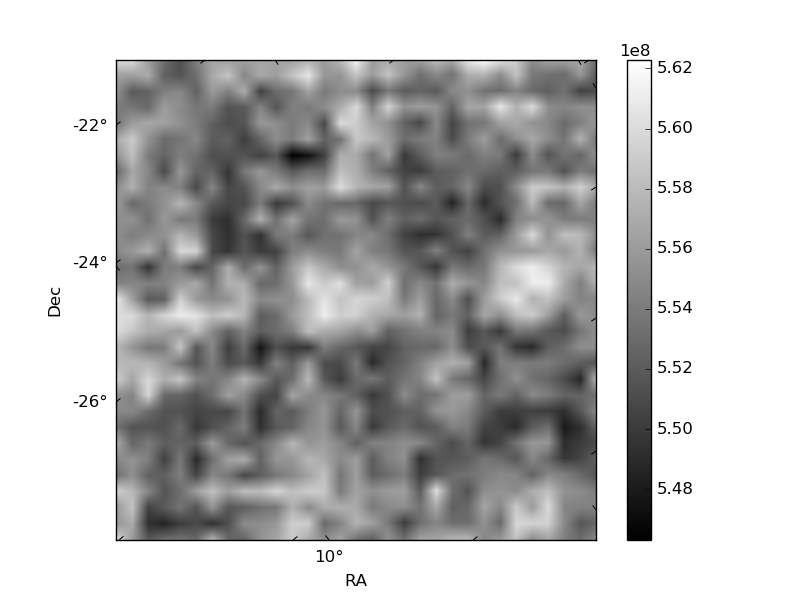
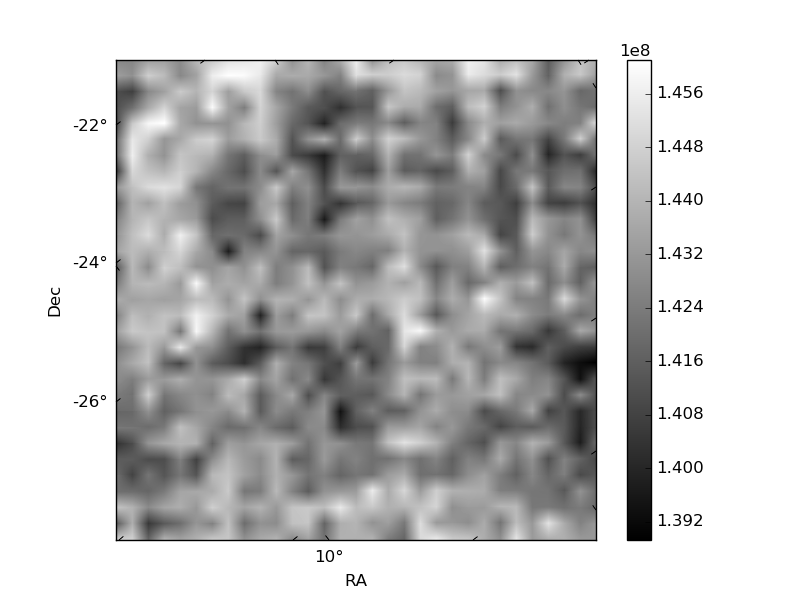
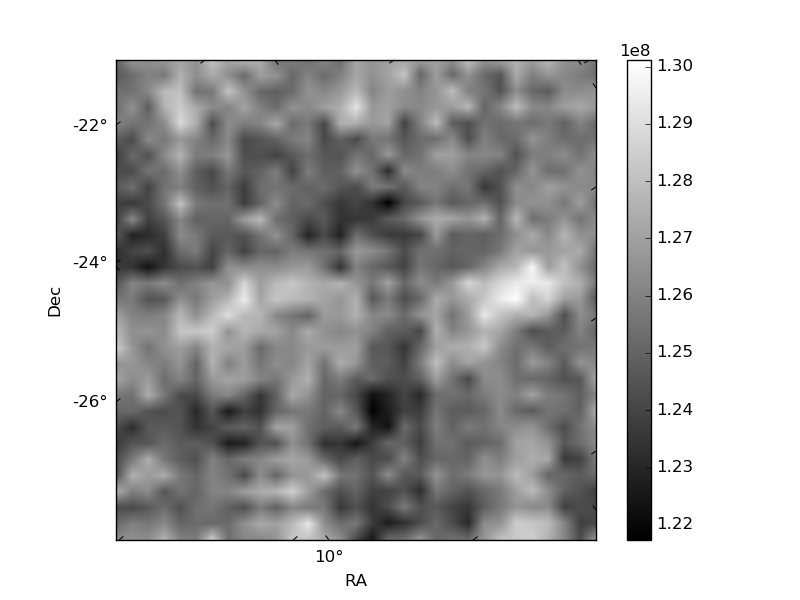
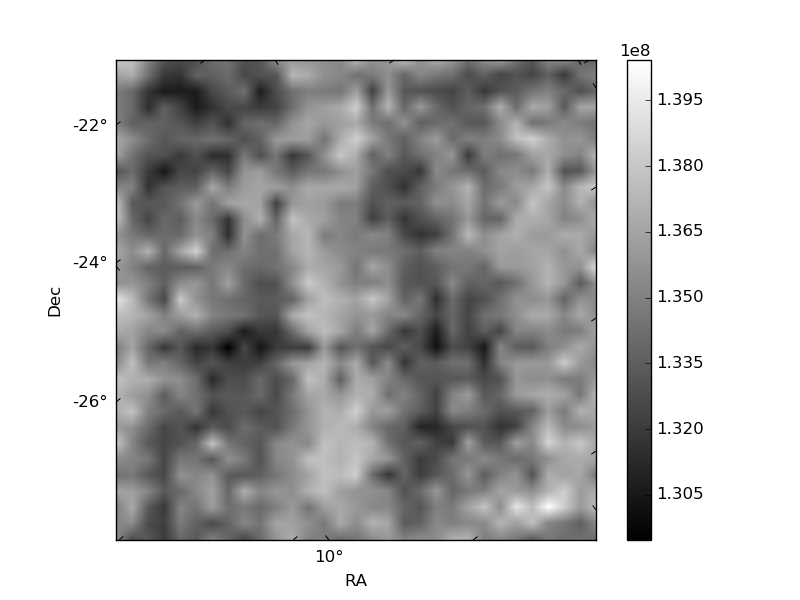
Histogram calculated using DETX and DETY for each event in the final _common_clean file
| Quadrant A | 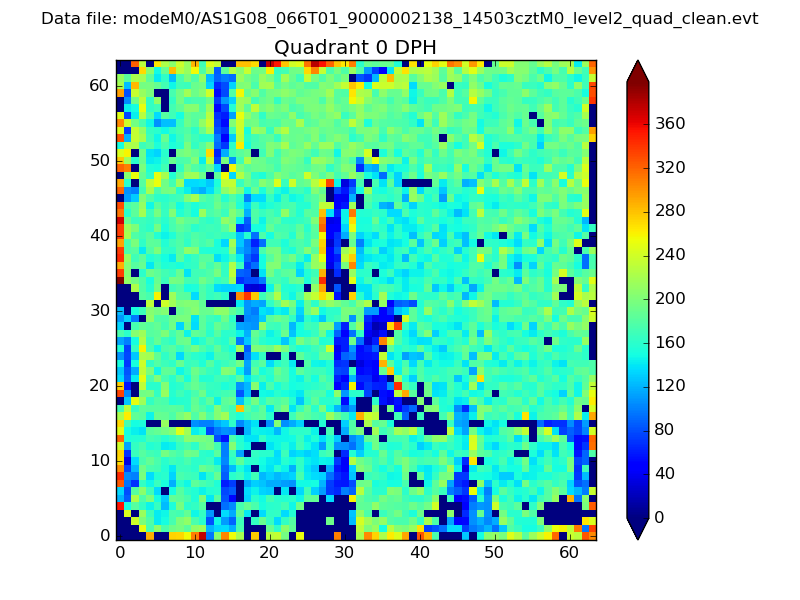 |
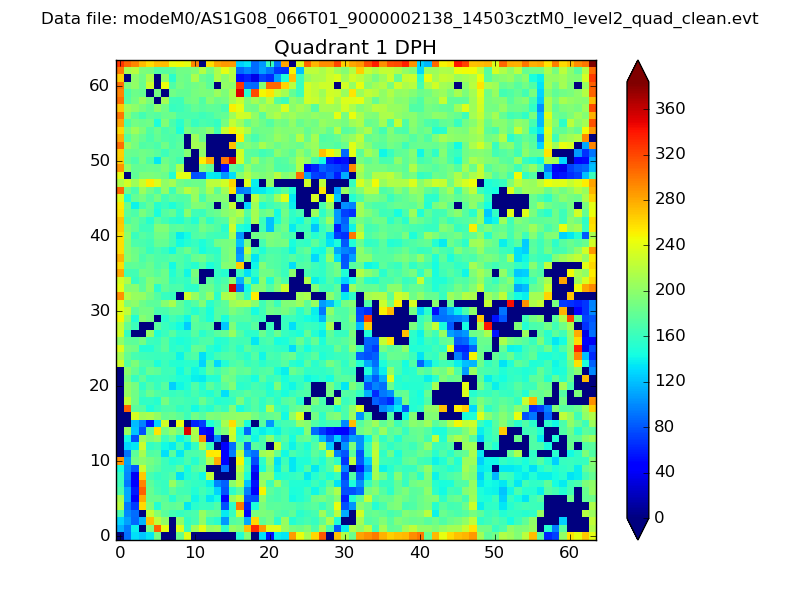 |
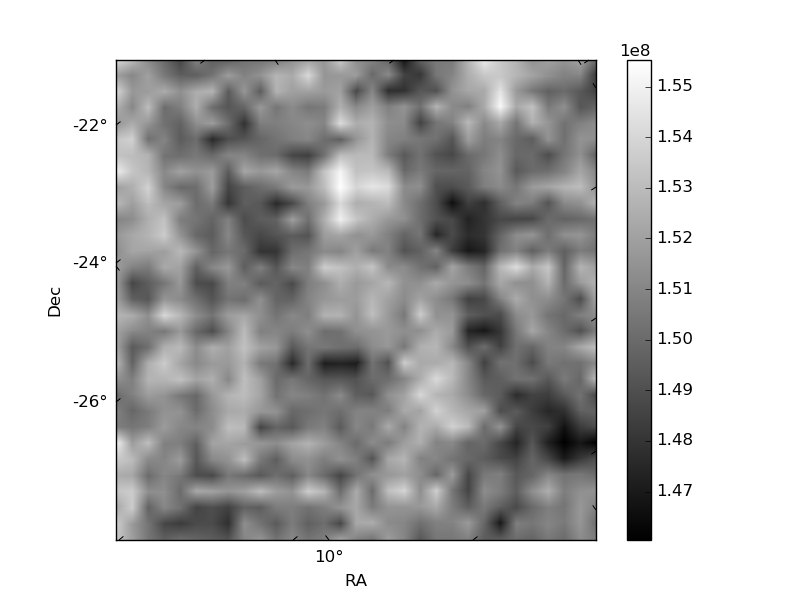
Quadrant B |
|---|---|---|---|
| Quadrant D | 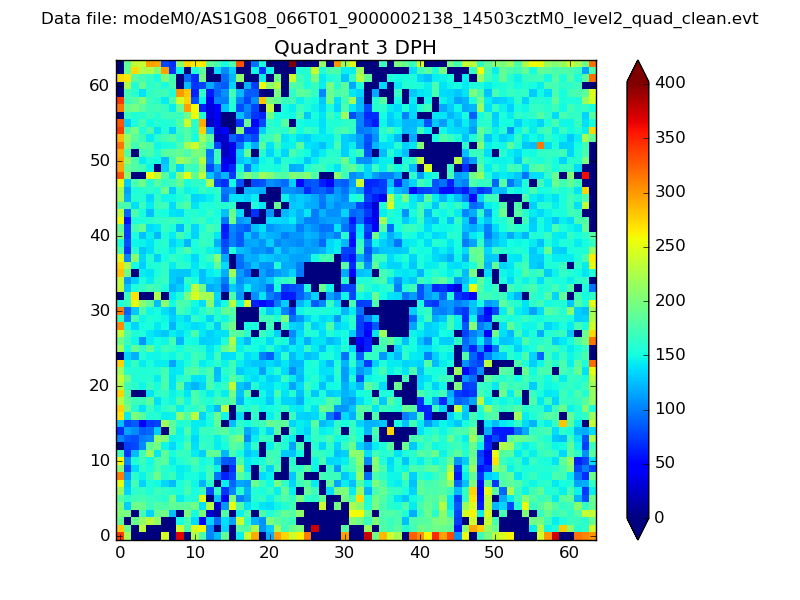 |
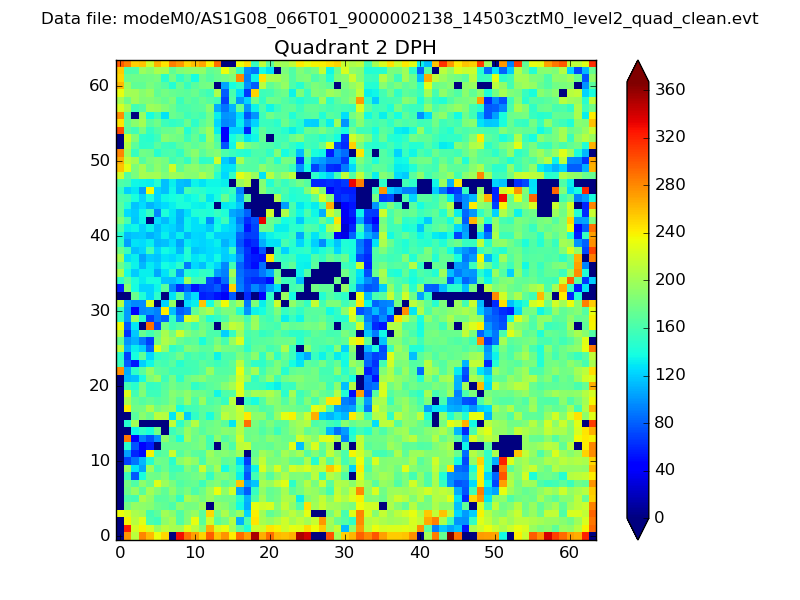 |
Quadrant C |
| Plot type | Count rate plots | Images |
|---|---|---|
| Comparison with Poisson distribution Blue bars denote a histogram of data divided into 1 sec bins. Red curve is a Poisson curve with rate = median count rate of data. |
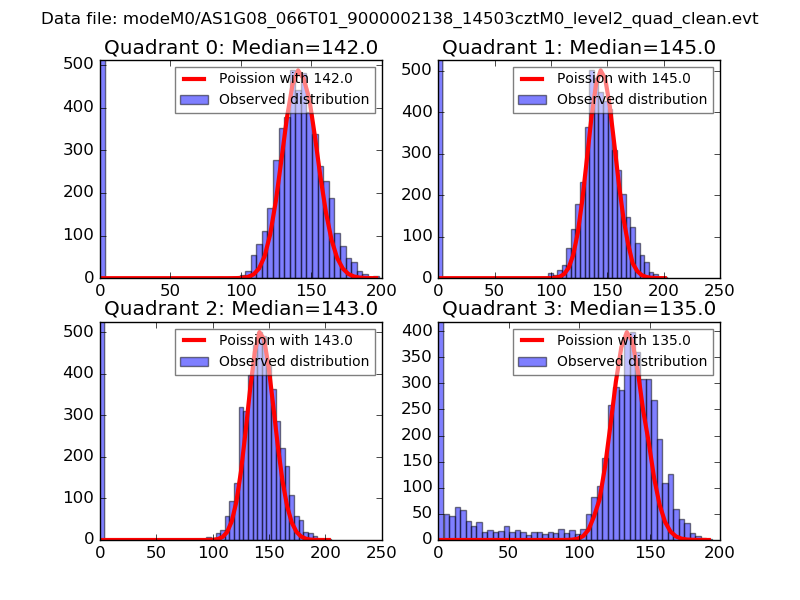 |
 |
| Quadrant-wise count rates Data is divided into 100 sec bins |
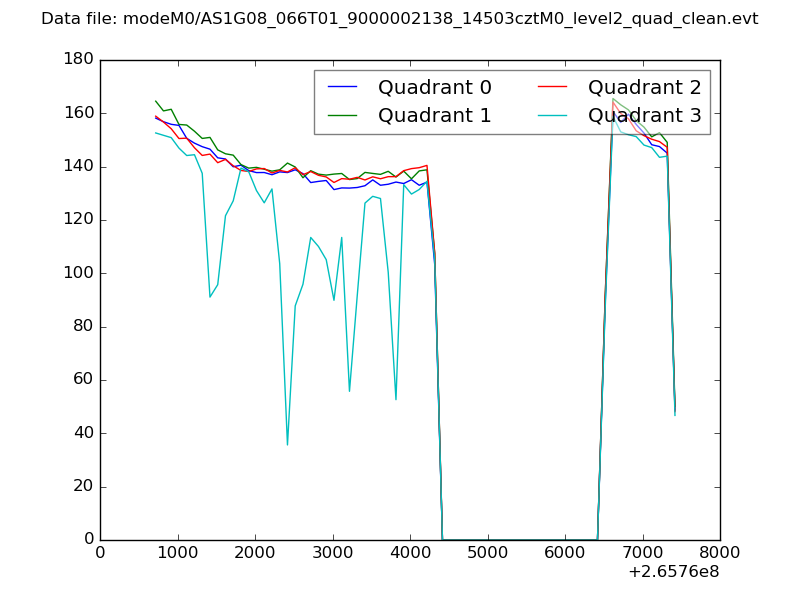 |
|
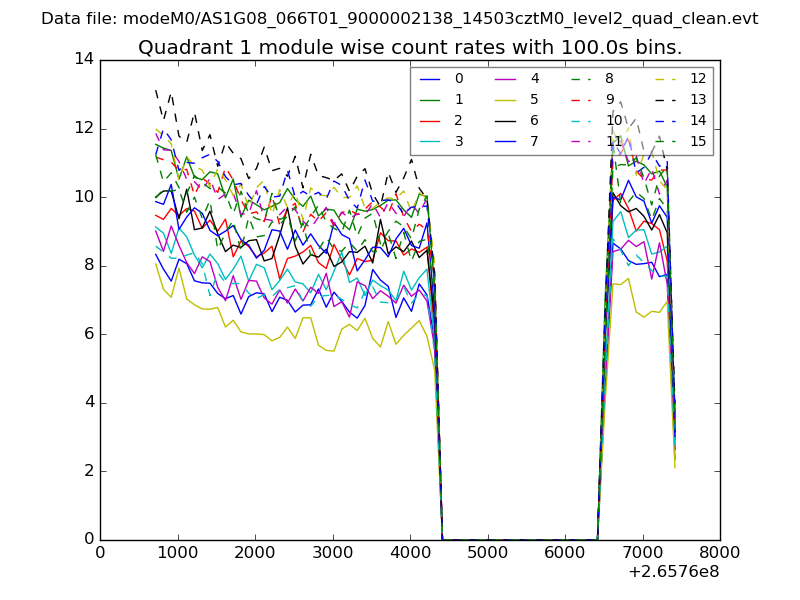
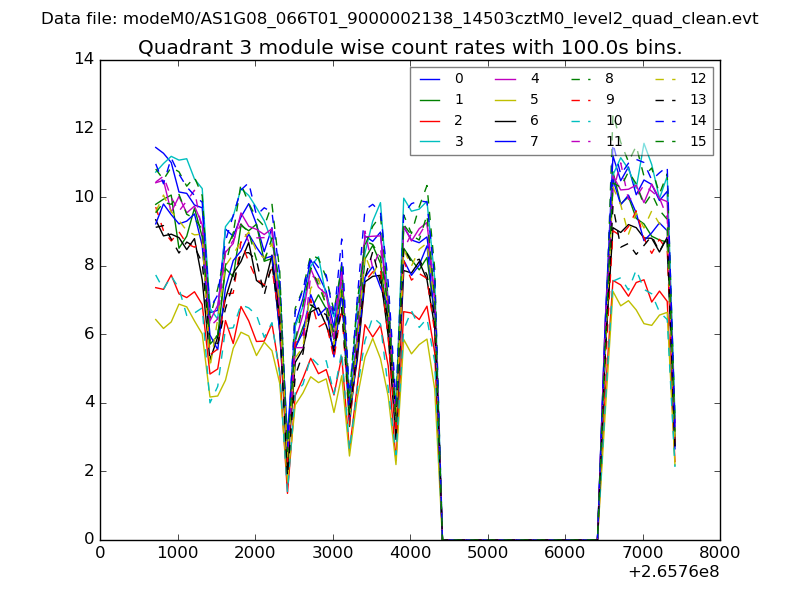
| Module-wise count rates for Quadrant A Data is divided into 100 sec bins |
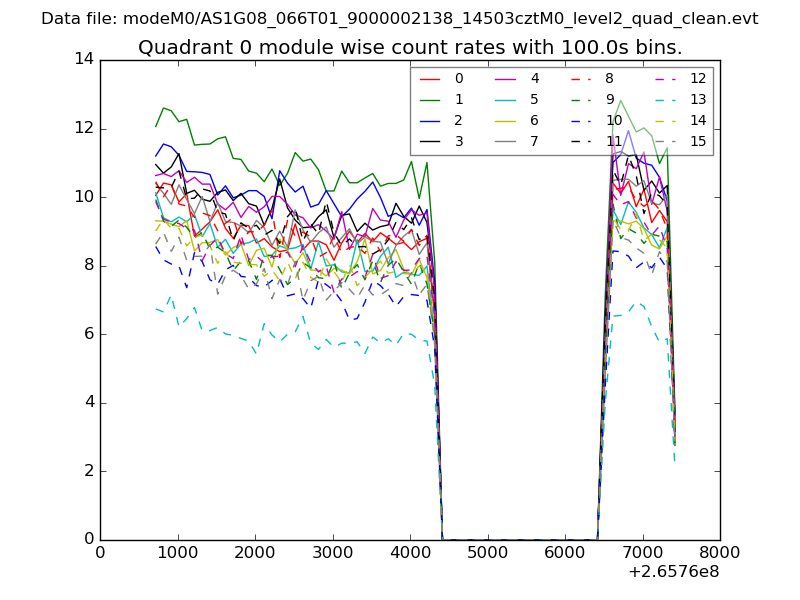 |
 |
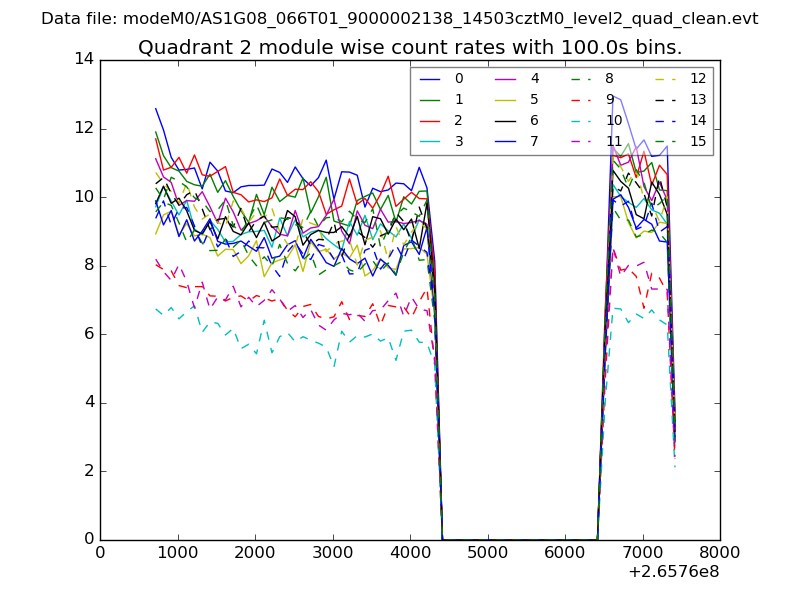
| Module-wise count rates for Quadrant B Data is divided into 100 sec bins |
 |
 |
| Module-wise count rates for Quadrant C Data is divided into 100 sec bins |
 |
 |
| Module-wise count rates for Quadrant D Data is divided into 100 sec bins |
 |
 |
| Parameter | Plot |
|---|---|
| CZT HV Monitor | 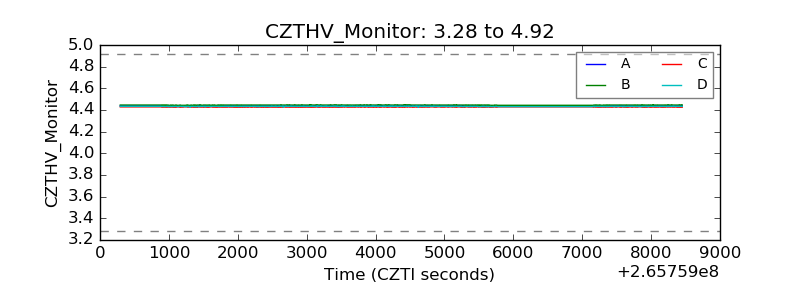 |
| D_VDD | 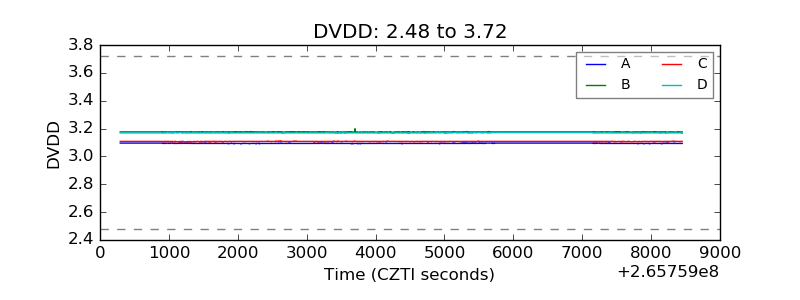 |
| Temperature 1 | 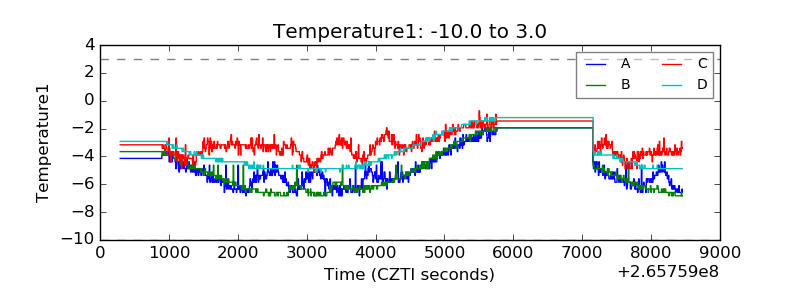 |
| Veto HV Monitor | 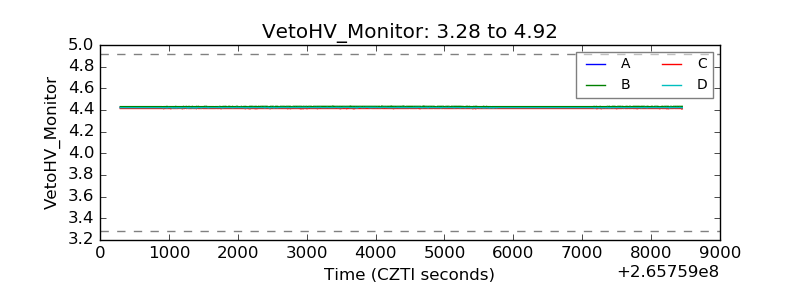 |
| Veto LLD | 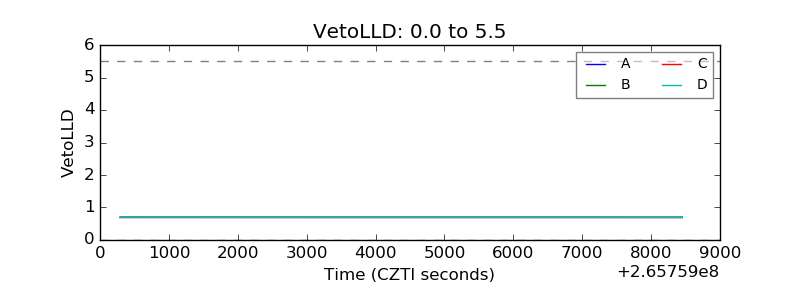 |
| Alpha Counter | 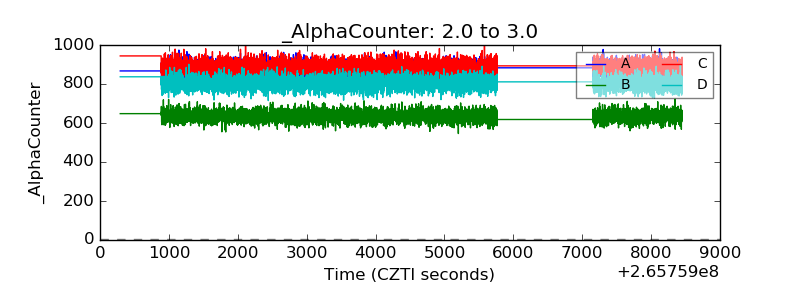 |
| _CPM_Rate | 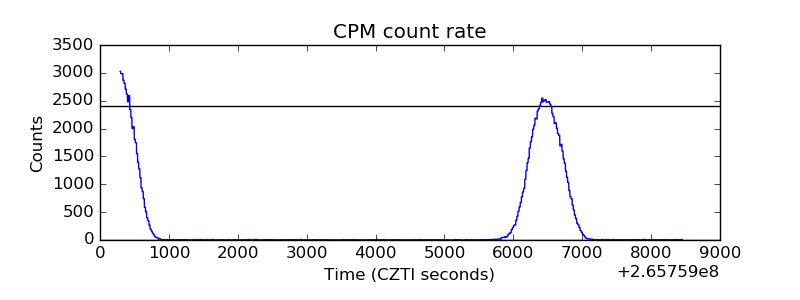 |
| CZT Counter | 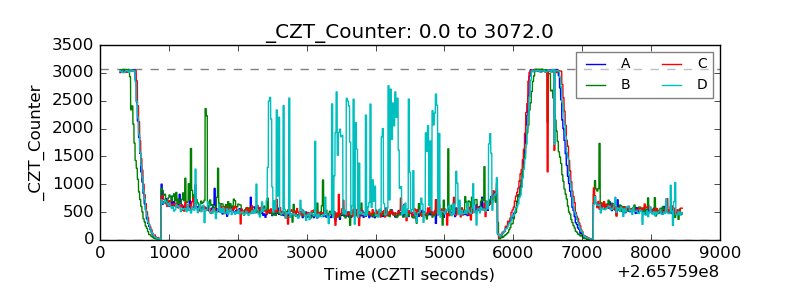 |
| +2.5 Volts monitor |  |
| +5 Volts monitor | 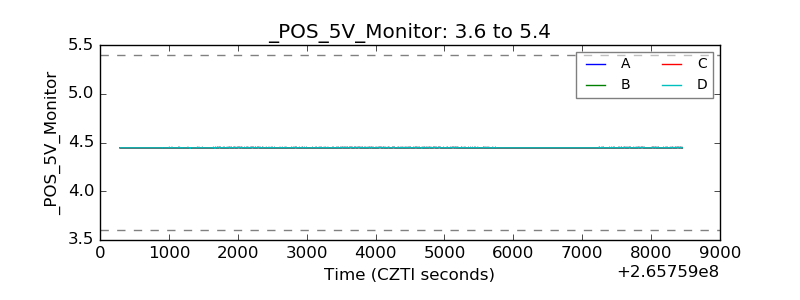 |
| _ROLL_ROT | 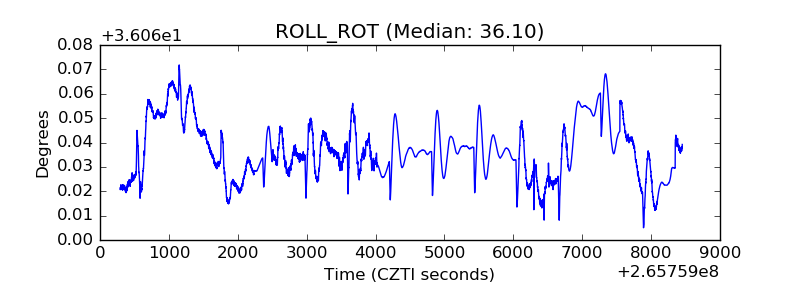 |
| _Roll_DEC | 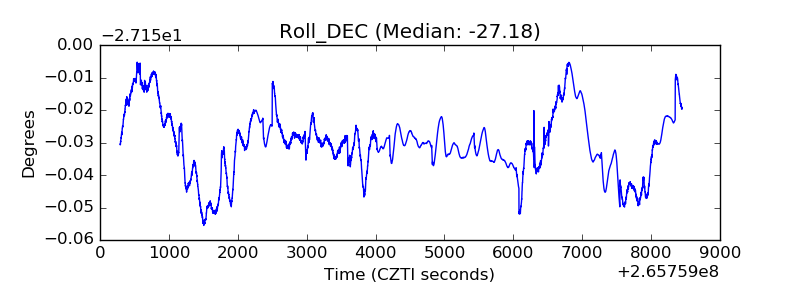 |
| _Roll_RA | 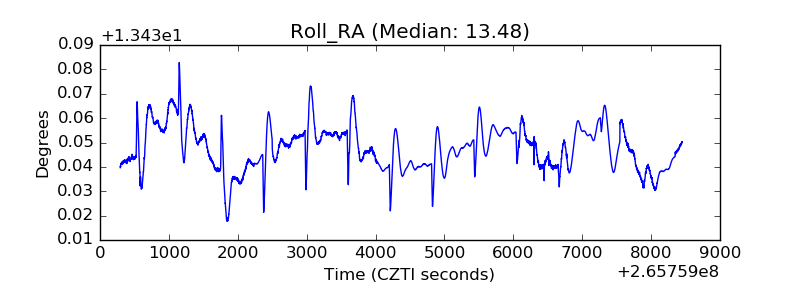 |
| Veto Counter | 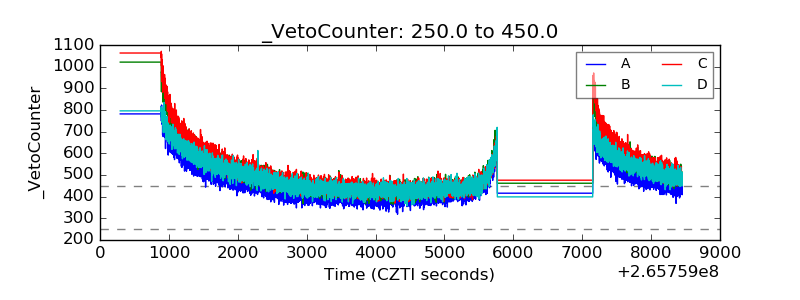 |