| Param | Original file | Final file |
|---|---|---|
| Filename | modeM0/AS1G08_066T01_9000002138_14505cztM0_level2.evt | modeM0/AS1G08_066T01_9000002138_14505cztM0_level2_quad_clean.evt |
| Size (bytes) | 512,170,560 | 102,960,000 |
| Size | 488.4 MB | 98.2 MB |
| Events in quadrant A | 3,237,675 | 676,723 |
| Events in quadrant B | 3,820,457 | 683,126 |
| Events in quadrant C | 3,448,665 | 688,884 |
| Events in quadrant D | 4,559,872 | 612,524 |
| Mode M9 | |||
|---|---|---|---|
| Quadrant | BADHDUFLAG | Total packets | Discarded packets |
| A | 0 | 21 | 0 |
| B | 0 | 21 | 0 |
| C | 0 | 21 | 0 |
| D | 0 | 22 | 0 |
| Mode SS | |||
|---|---|---|---|
| Quadrant | BADHDUFLAG | Total packets | Discarded packets |
| A | 0 | 134 | 0 |
| B | 0 | 134 | 0 |
| C | 0 | 134 | 0 |
| D | 0 | 134 | 0 |
| Mode M0 | |||
|---|---|---|---|
| Quadrant | BADHDUFLAG | Total packets | Discarded packets |
| A | 0 | 13847 | 2 |
| B | 0 | 15557 | 1 |
| C | 0 | 14081 | 1 |
| D | 0 | 17821 | 1 |
| Quadrant | Total seconds | Saturated seconds | Saturation percentage |
|---|---|---|---|
| A | 6543 | 36 | 0.550206% |
| B | 6543 | 235 | 3.591625% |
| C | 6543 | 44 | 0.672474% |
| D | 6543 | 615 | 9.399358% |
Noise dominated data is calculated using 1-second bins in cleaned event files. If a bin has >2000 counts, and if more than 50% of those come from <1% of pixels, then it is considered to be noise-dominated and hence unusable.
| Quadrant | # 1 sec bins | Bins with >0 counts | Bins with >2000 counts | High rate bins dominated by noise | Noise dominated (total time) | Noise dominated (detector-on time) | Marked lightcurve |
|---|---|---|---|---|---|---|---|
| A | 7639 | 6545 | 0 | 0 | 0.00% | 0.00% | 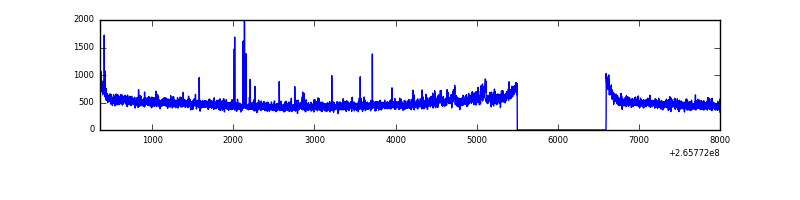 |
| B | 7639 | 6545 | 119 | 119 | 1.56% | 1.82% | 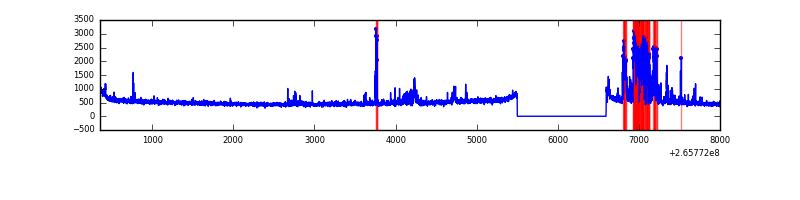 |
| C | 7639 | 6545 | 2 | 2 | 0.03% | 0.03% |  |
| D | 7639 | 6545 | 377 | 377 | 4.94% | 5.76% | 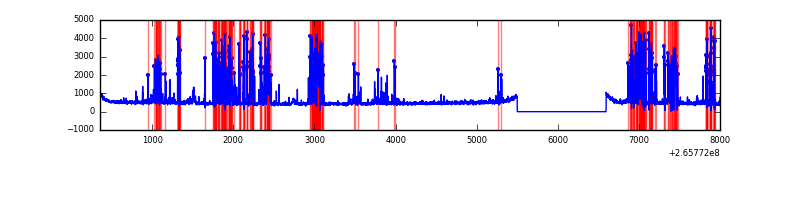 |
Top three noisy pixels from each quadrant. If the there are fewer than three noisy pixels in the level2.evt file, extra rows are filled as -1
| Pixel properties | Quadrant properties | ||||||
|---|---|---|---|---|---|---|---|
| Quadrant | DetID | PixID | Counts | Sigma | Mean | Median | Sigma |
| A | 12 | 189 | 68262 | 408.22 | 814 | 795 | 165.3 |
| A | 4 | 2 | 30726 | 181.1 | 814 | 795 | 165.3 |
| A | 0 | 226 | 7264 | 39.14 | 814 | 795 | 165.3 |
| B | 10 | 245 | 460458 | 2994.0 | 810 | 791 | 153.5 |
| B | 0 | 189 | 69133 | 445.14 | 810 | 791 | 153.5 |
| B | 0 | 85 | 23058 | 145.03 | 810 | 791 | 153.5 |
| C | 3 | 233 | 227363 | 1211.62 | 809 | 815 | 187.0 |
| C | 0 | 207 | 33544 | 175.04 | 809 | 815 | 187.0 |
| C | 5 | 37 | 33170 | 173.04 | 809 | 815 | 187.0 |
| D | 10 | 199 | 1637244 | 8010.38 | 757 | 744 | 204.3 |
| D | 2 | 234 | 23969 | 113.68 | 757 | 744 | 204.3 |
| D | 12 | 110 | 14073 | 65.24 | 757 | 744 | 204.3 |
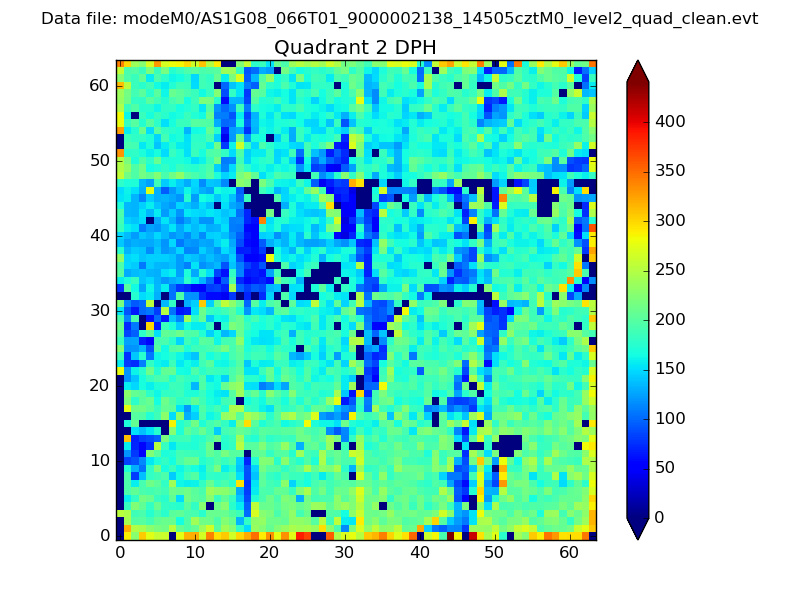
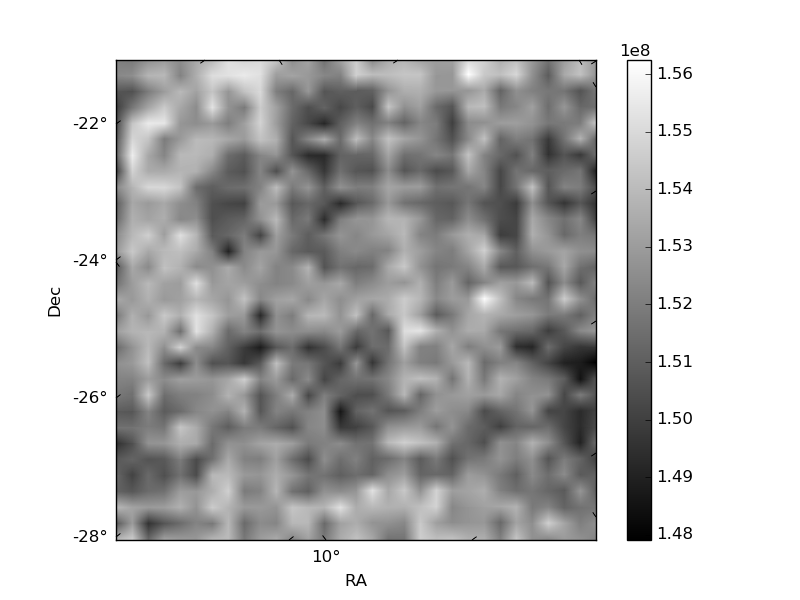
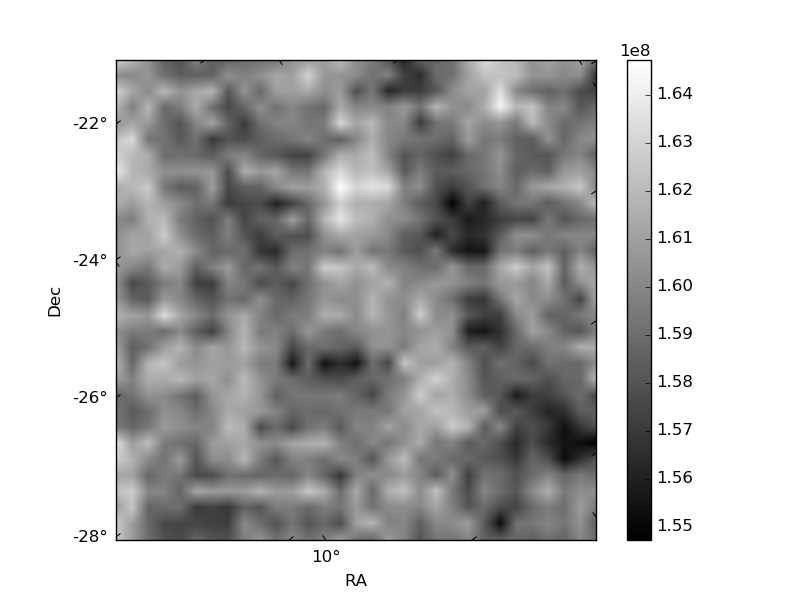
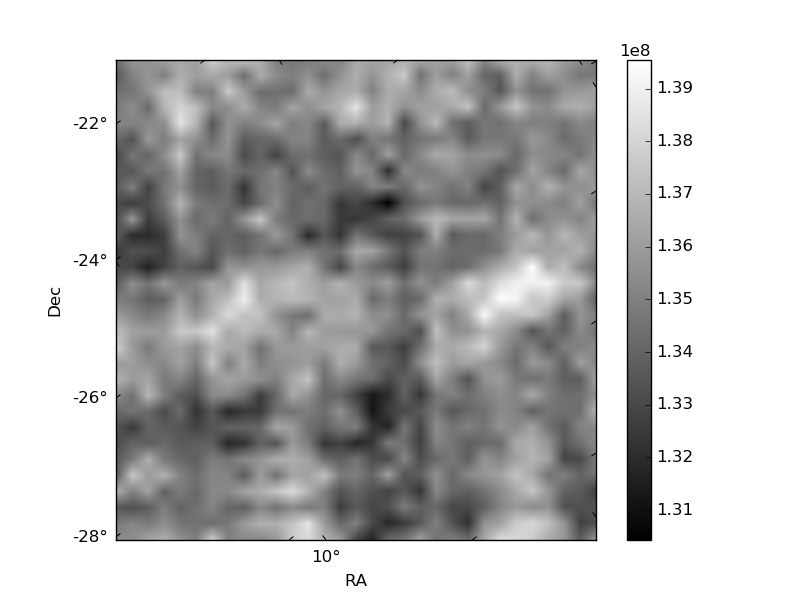
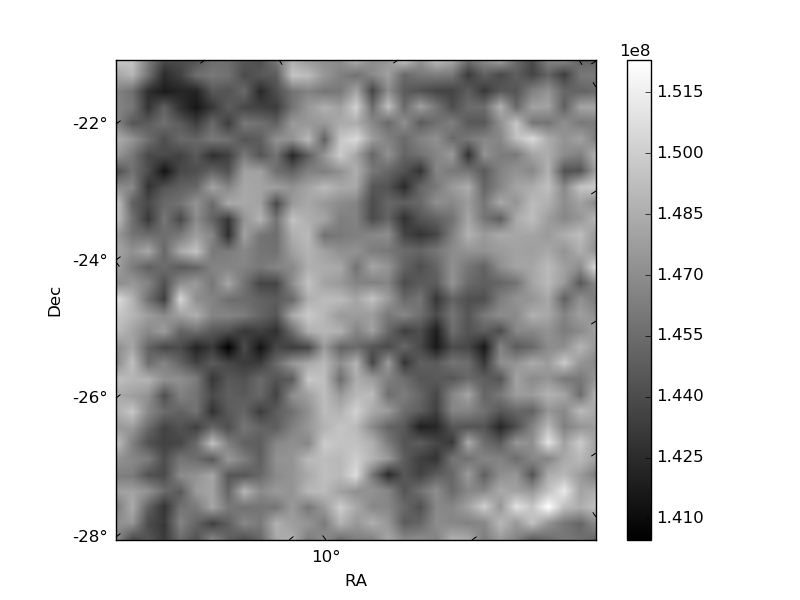
Histogram calculated using DETX and DETY for each event in the final _common_clean file
| Quadrant A | 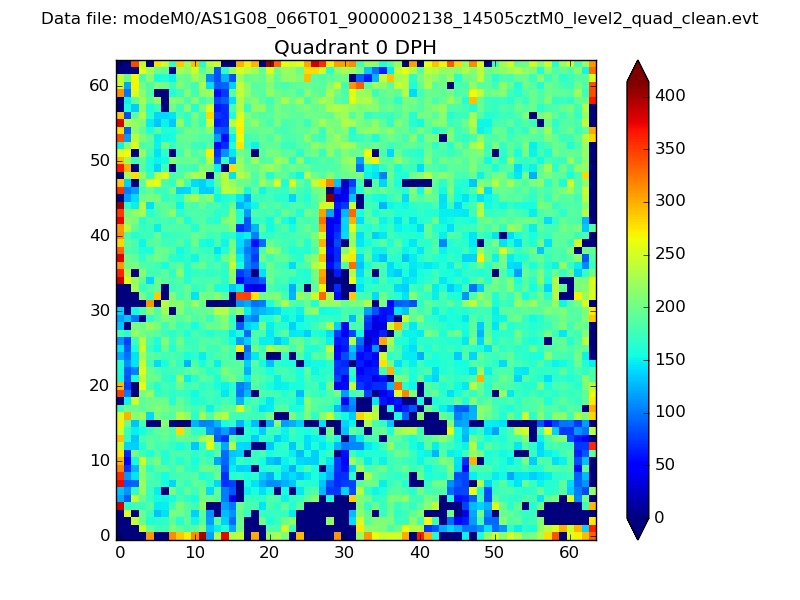 |
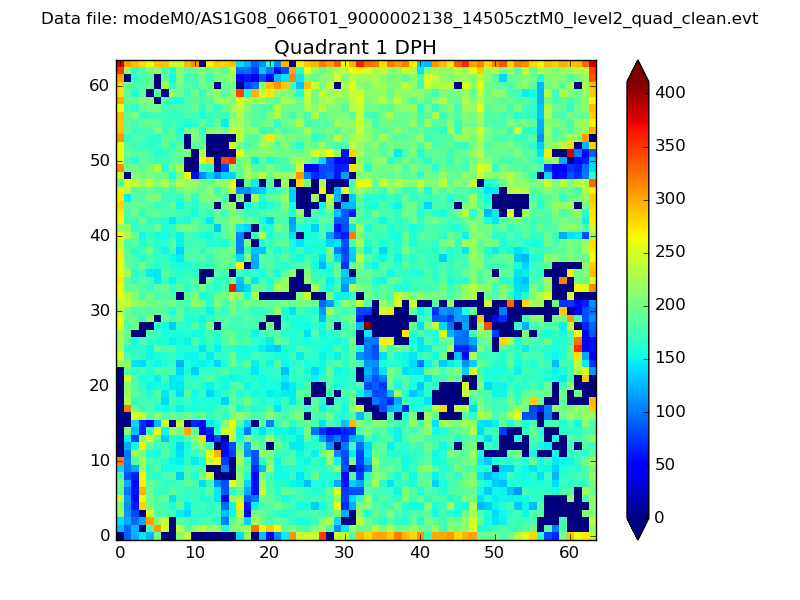 |
Quadrant B |
|---|---|---|---|
| Quadrant D | 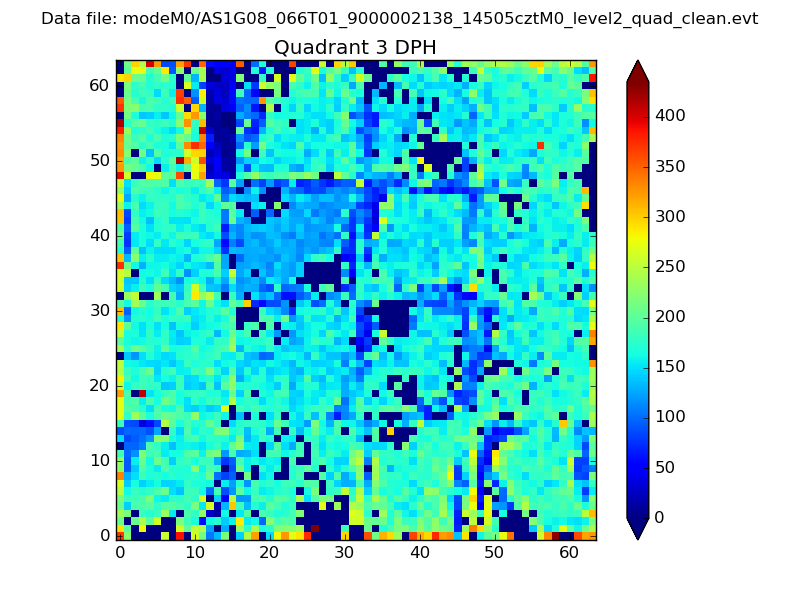 |
 |
Quadrant C |
| Plot type | Count rate plots | Images |
|---|---|---|
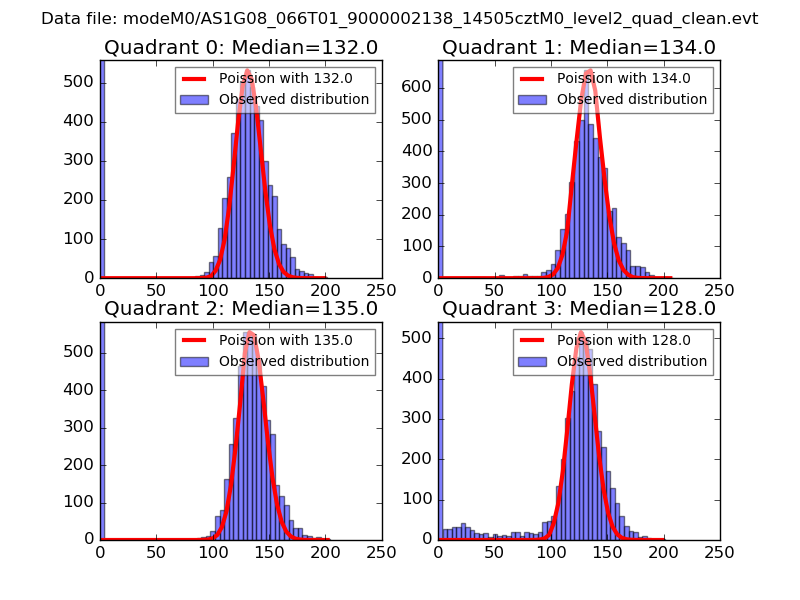
| Comparison with Poisson distribution Blue bars denote a histogram of data divided into 1 sec bins. Red curve is a Poisson curve with rate = median count rate of data. |
 |
 |
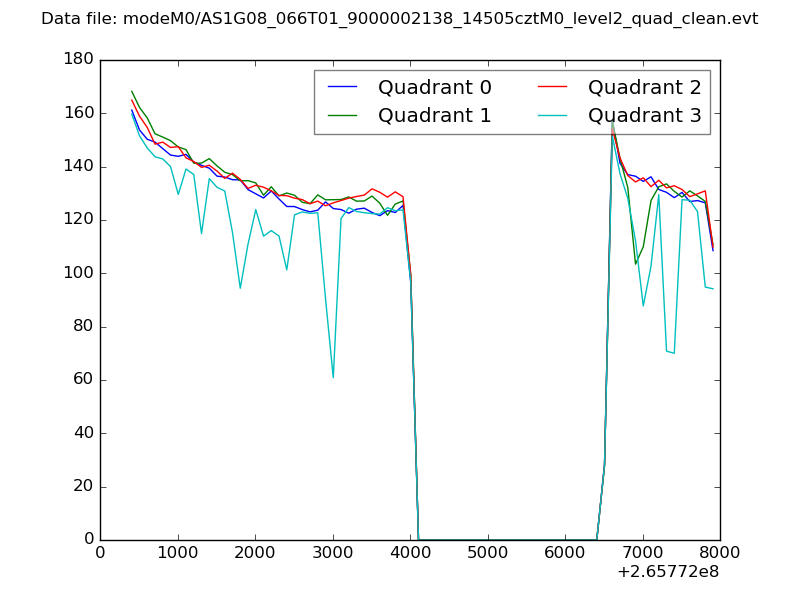
| Quadrant-wise count rates Data is divided into 100 sec bins |
 |
|
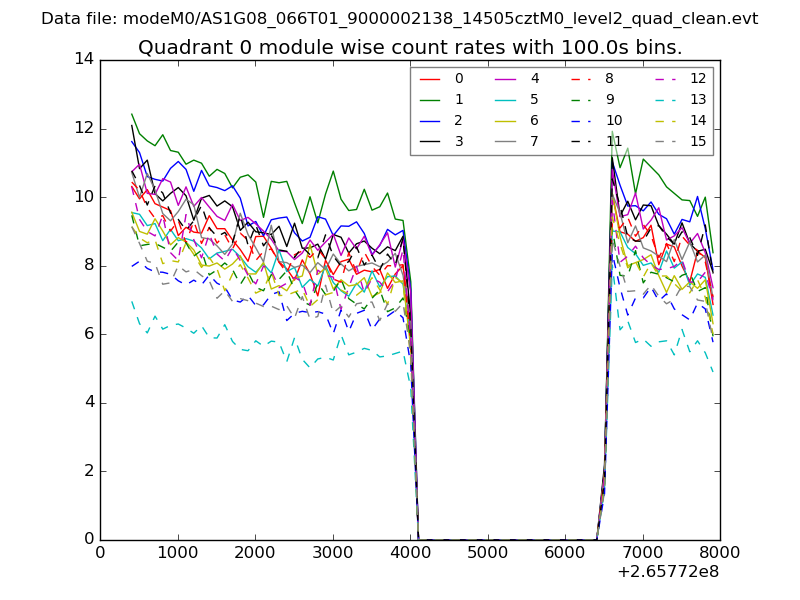
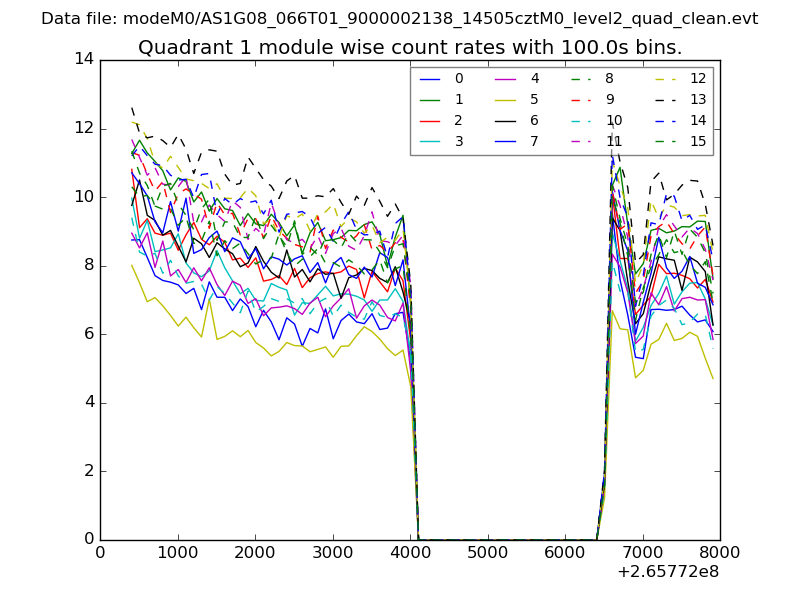
| Module-wise count rates for Quadrant A Data is divided into 100 sec bins |
 |
 |
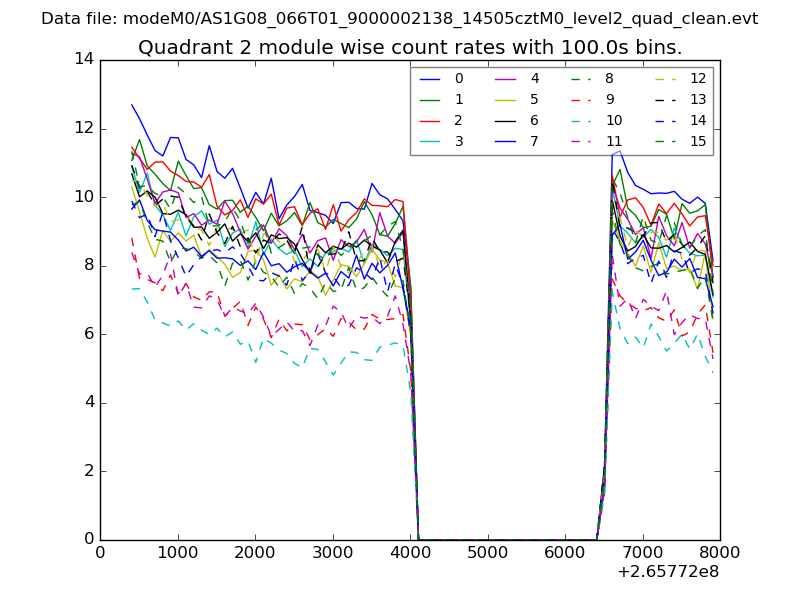
| Module-wise count rates for Quadrant B Data is divided into 100 sec bins |
 |
 |
| Module-wise count rates for Quadrant C Data is divided into 100 sec bins |
 |
 |
| Module-wise count rates for Quadrant D Data is divided into 100 sec bins |
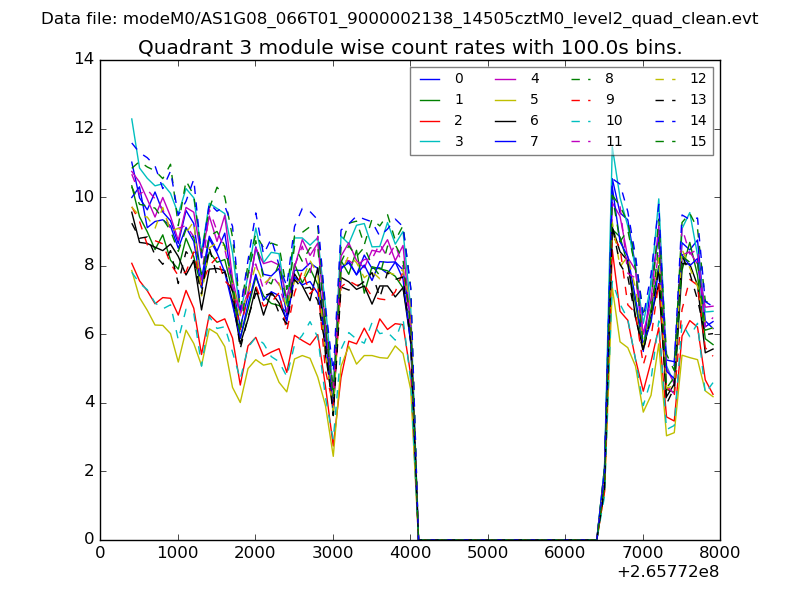 |
 |
| Parameter | Plot |
|---|---|
| CZT HV Monitor | 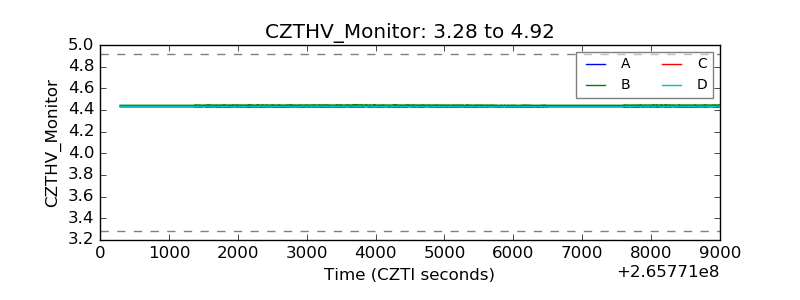 |
| D_VDD | 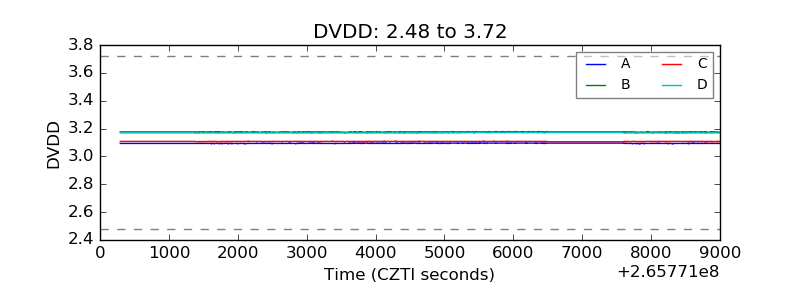 |
| Temperature 1 | 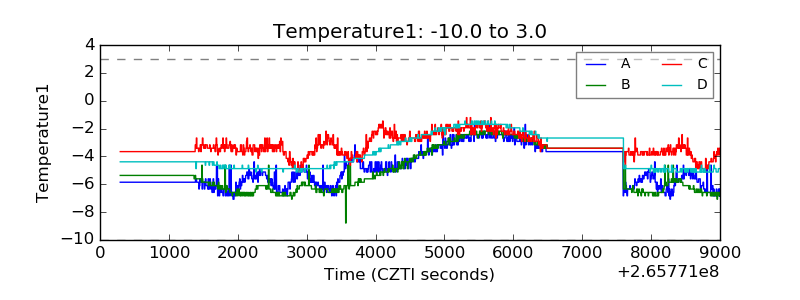 |
| Veto HV Monitor |  |
| Veto LLD | 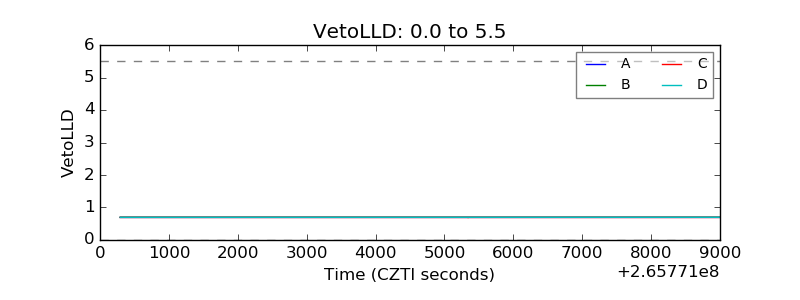 |
| Alpha Counter | 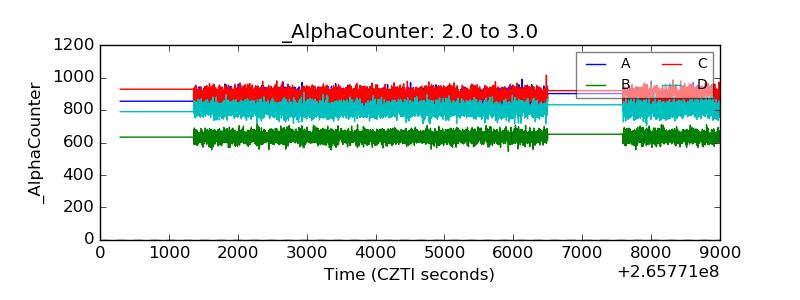 |
| _CPM_Rate | 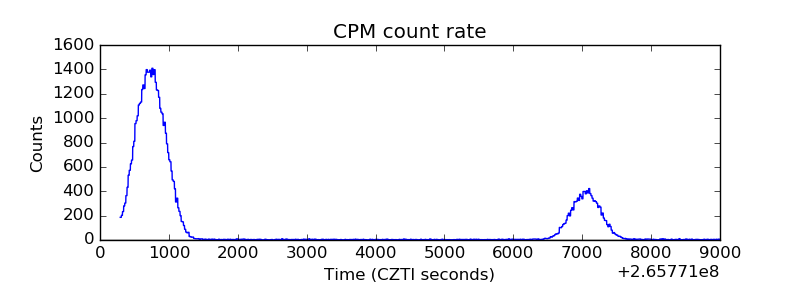 |
| CZT Counter | 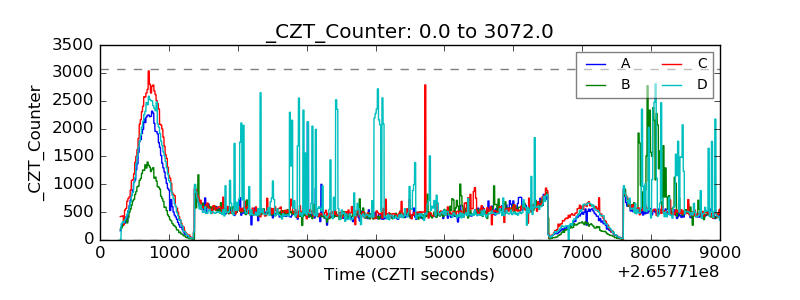 |
| +2.5 Volts monitor | 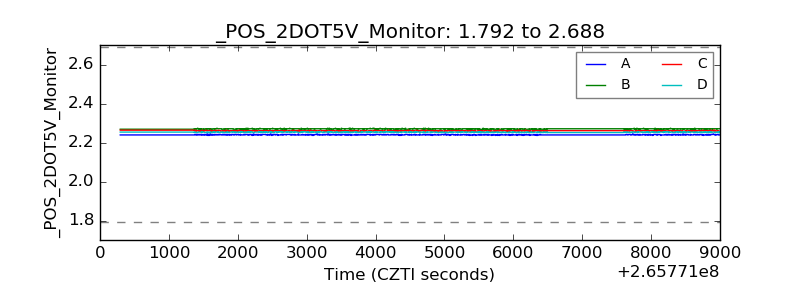 |
| +5 Volts monitor |  |
| _ROLL_ROT | 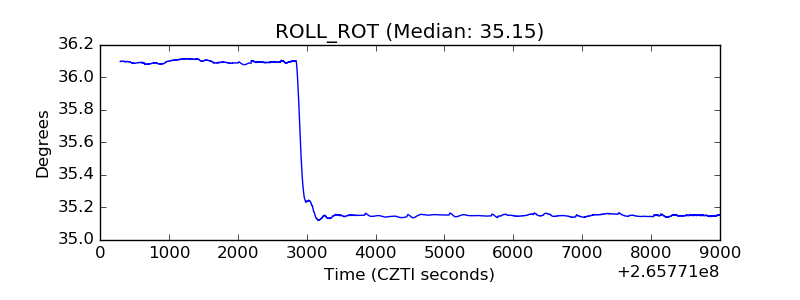 |
| _Roll_DEC | 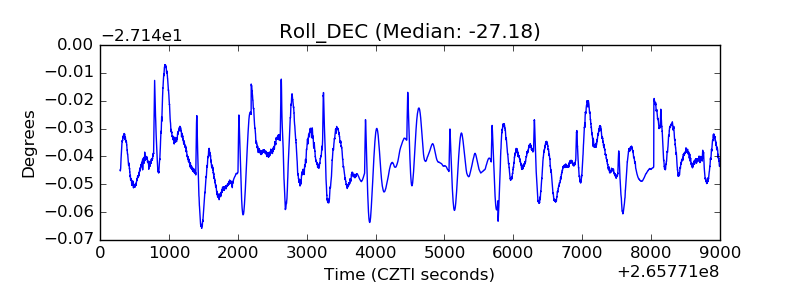 |
| _Roll_RA | 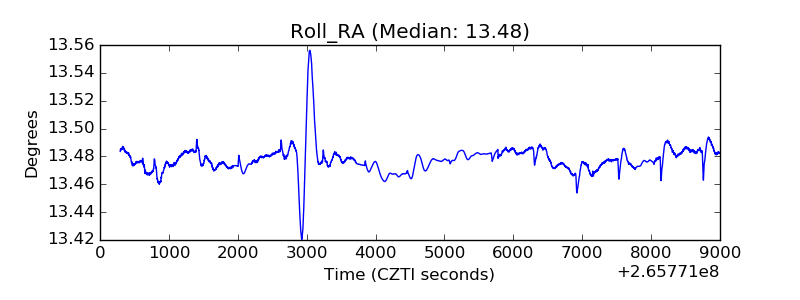 |
| Veto Counter | 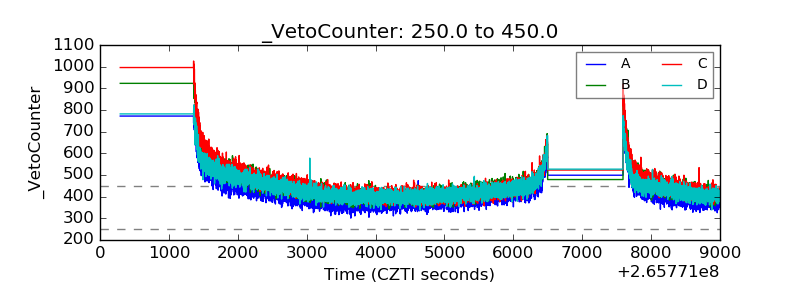 |