| Param | Original file | Final file |
|---|---|---|
| Filename | modeM0/AS1G08_066T01_9000002138_14508cztM0_level2.evt | modeM0/AS1G08_066T01_9000002138_14508cztM0_level2_quad_clean.evt |
| Size (bytes) | 549,406,080 | 107,887,680 |
| Size | 524.0 MB | 102.9 MB |
| Events in quadrant A | 3,687,592 | 688,060 |
| Events in quadrant B | 3,790,694 | 703,961 |
| Events in quadrant C | 3,812,945 | 698,722 |
| Events in quadrant D | 4,818,181 | 634,161 |
| Mode SS | |||
|---|---|---|---|
| Quadrant | BADHDUFLAG | Total packets | Discarded packets |
| A | 0 | 156 | 0 |
| B | 0 | 156 | 0 |
| C | 0 | 156 | 0 |
| D | 0 | 156 | 0 |
| Mode M0 | |||
|---|---|---|---|
| Quadrant | BADHDUFLAG | Total packets | Discarded packets |
| A | 0 | 16152 | 1 |
| B | 0 | 16395 | 0 |
| C | 0 | 16246 | 0 |
| D | 0 | 19779 | 0 |
| Quadrant | Total seconds | Saturated seconds | Saturation percentage |
|---|---|---|---|
| A | 7791 | 269 | 3.452702% |
| B | 7791 | 275 | 3.529714% |
| C | 7791 | 181 | 2.323193% |
| D | 7791 | 702 | 9.010397% |
Noise dominated data is calculated using 1-second bins in cleaned event files. If a bin has >2000 counts, and if more than 50% of those come from <1% of pixels, then it is considered to be noise-dominated and hence unusable.
| Quadrant | # 1 sec bins | Bins with >0 counts | Bins with >2000 counts | High rate bins dominated by noise | Noise dominated (total time) | Noise dominated (detector-on time) | Marked lightcurve |
|---|---|---|---|---|---|---|---|
| A | 7792 | 7792 | 0 | 0 | 0.00% | 0.00% | 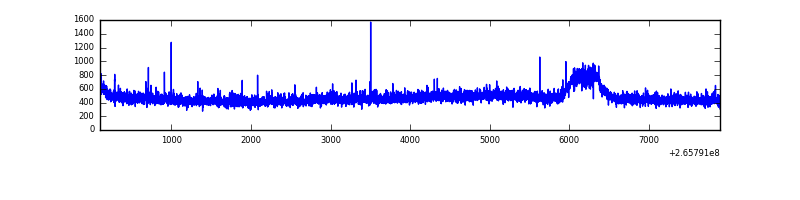 |
| B | 7792 | 7792 | 12 | 12 | 0.15% | 0.15% | 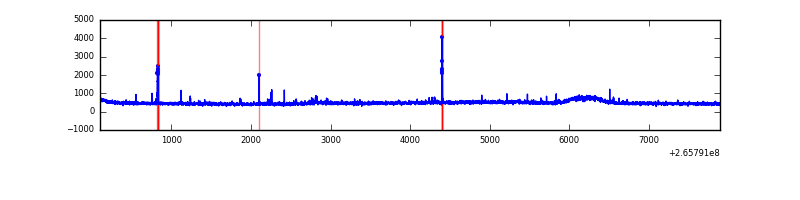 |
| C | 7792 | 7792 | 1 | 1 | 0.01% | 0.01% | 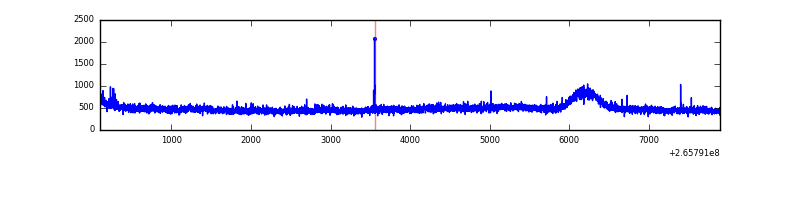 |
| D | 7792 | 7792 | 301 | 301 | 3.86% | 3.86% | 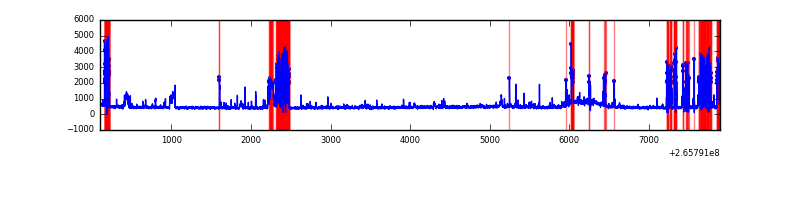 |
Top three noisy pixels from each quadrant. If the there are fewer than three noisy pixels in the level2.evt file, extra rows are filled as -1
| Pixel properties | Quadrant properties | ||||||
|---|---|---|---|---|---|---|---|
| Quadrant | DetID | PixID | Counts | Sigma | Mean | Median | Sigma |
| A | 12 | 189 | 47680 | 244.66 | 938 | 917 | 191.1 |
| A | 0 | 23 | 9391 | 44.33 | 938 | 917 | 191.1 |
| A | 0 | 226 | 8784 | 41.16 | 938 | 917 | 191.1 |
| B | 0 | 189 | 30192 | 160.58 | 937 | 912 | 182.3 |
| B | 15 | 222 | 29703 | 157.9 | 937 | 912 | 182.3 |
| B | 10 | 252 | 24246 | 127.97 | 937 | 912 | 182.3 |
| C | 3 | 233 | 203590 | 938.93 | 924 | 926 | 215.8 |
| C | 13 | 61 | 6559 | 26.1 | 924 | 926 | 215.8 |
| C | 0 | 207 | 6115 | 24.04 | 924 | 926 | 215.8 |
| D | 10 | 199 | 1036399 | 4387.45 | 882 | 861 | 236.0 |
| D | 12 | 110 | 173099 | 729.75 | 882 | 861 | 236.0 |
| D | 13 | 122 | 138376 | 582.64 | 882 | 861 | 236.0 |
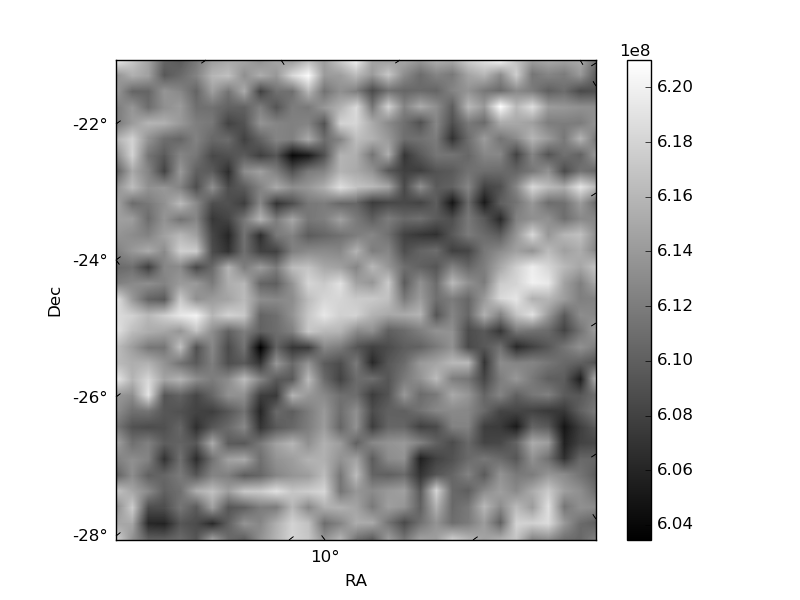
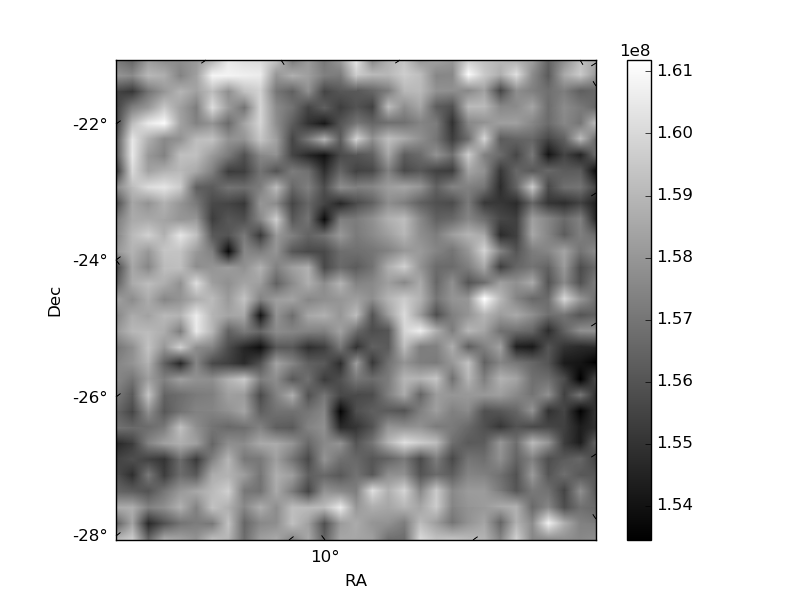
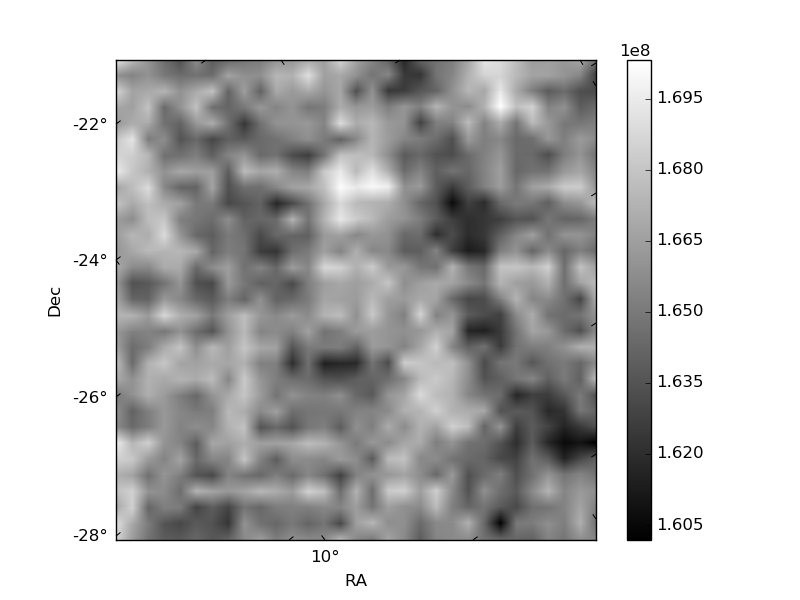
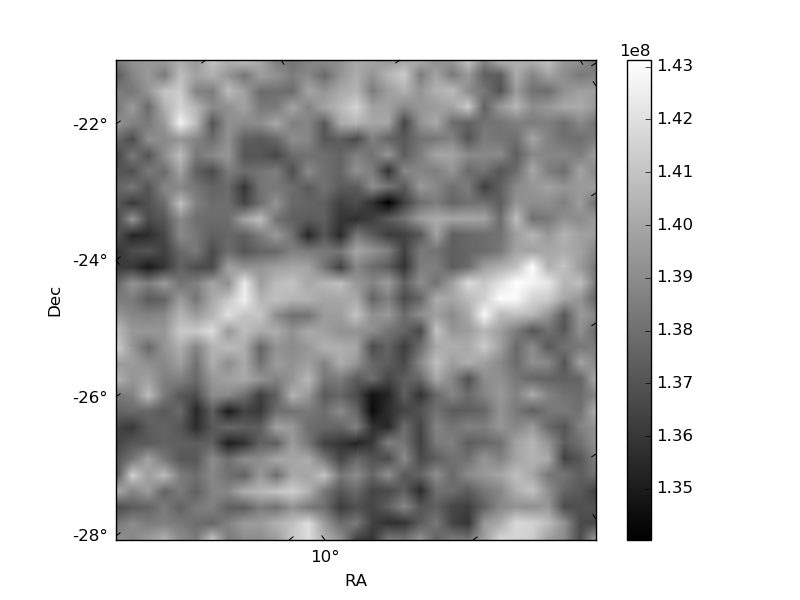
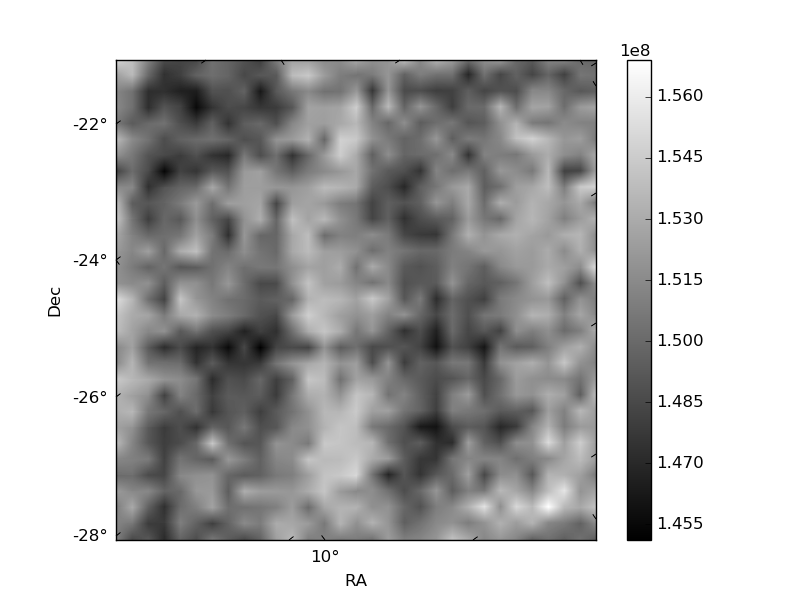
Histogram calculated using DETX and DETY for each event in the final _common_clean file
| Quadrant A | 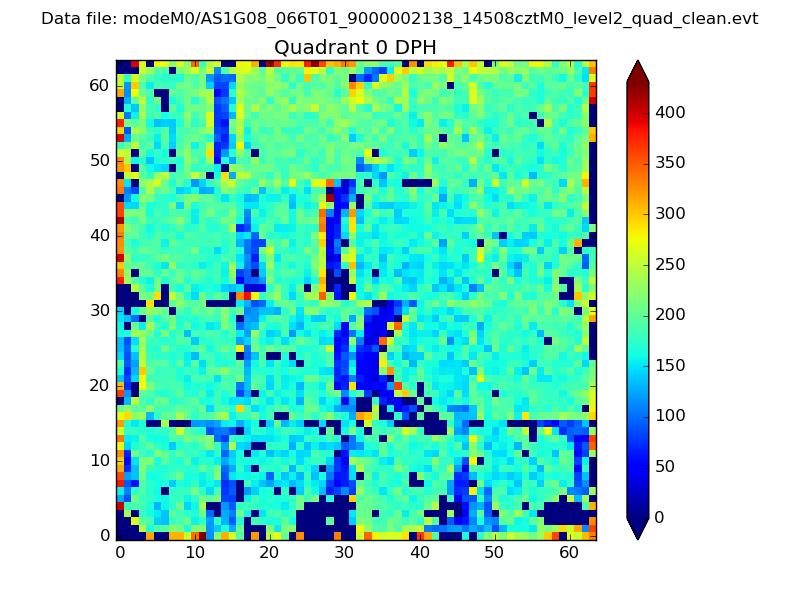 |
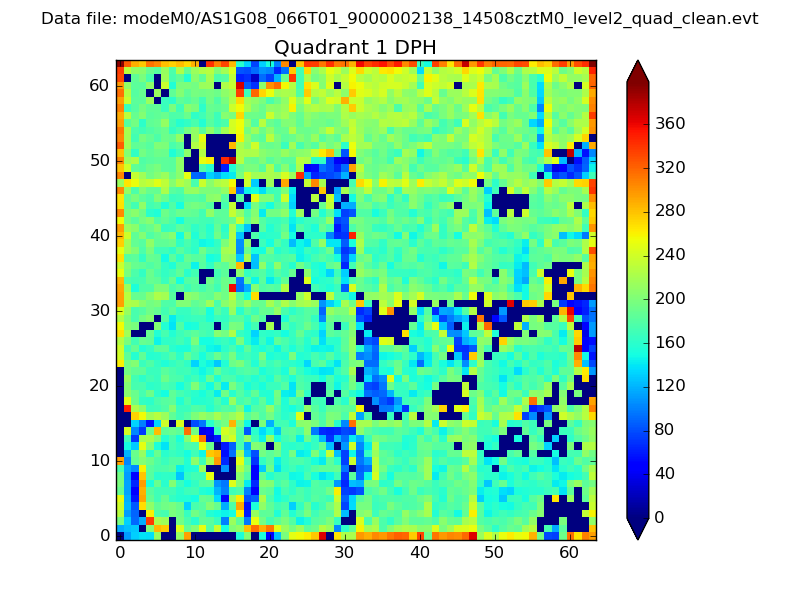 |
Quadrant B |
|---|---|---|---|
| Quadrant D | 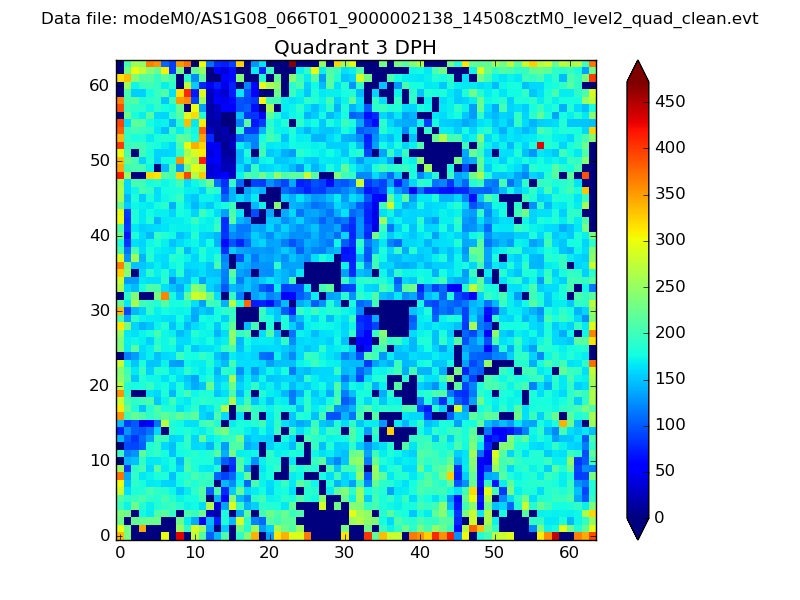 |
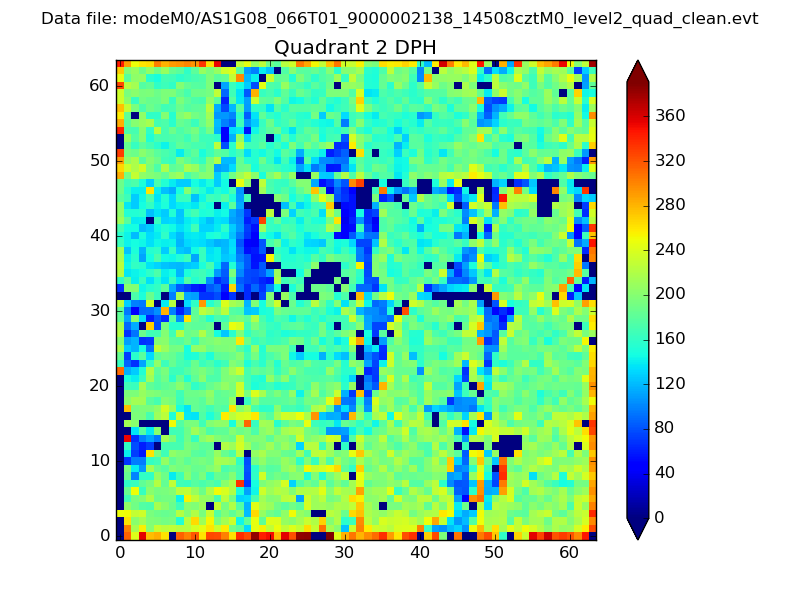 |
Quadrant C |
| Plot type | Count rate plots | Images |
|---|---|---|
| Comparison with Poisson distribution Blue bars denote a histogram of data divided into 1 sec bins. Red curve is a Poisson curve with rate = median count rate of data. |
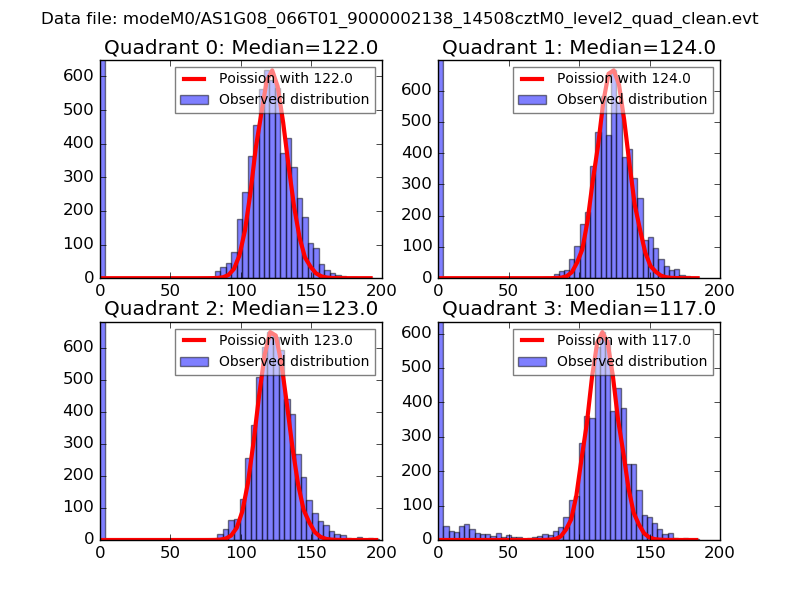 |
 |
| Quadrant-wise count rates Data is divided into 100 sec bins |
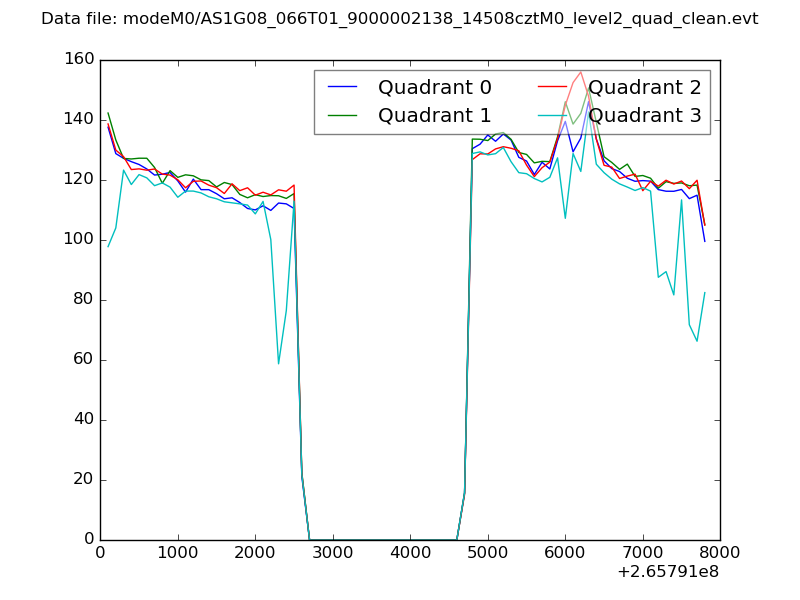 |
|
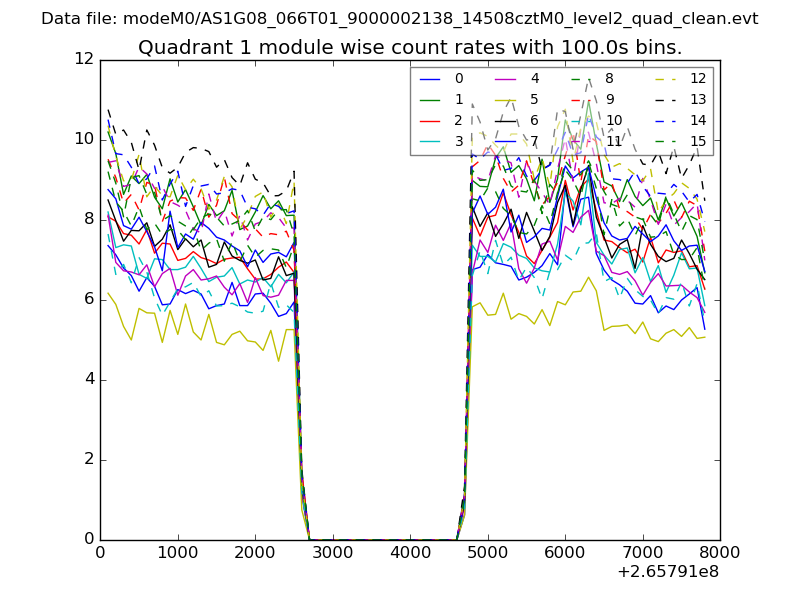
| Module-wise count rates for Quadrant A Data is divided into 100 sec bins |
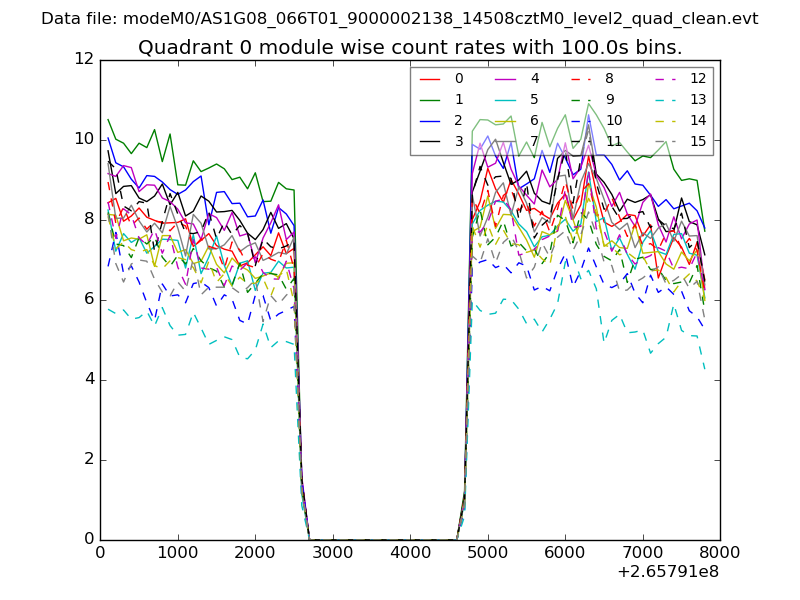 |
 |
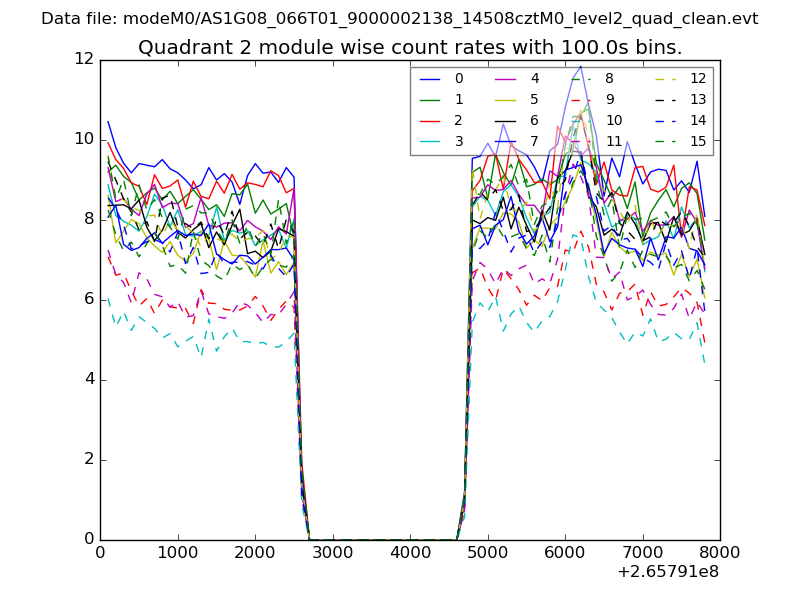
| Module-wise count rates for Quadrant B Data is divided into 100 sec bins |
 |
 |
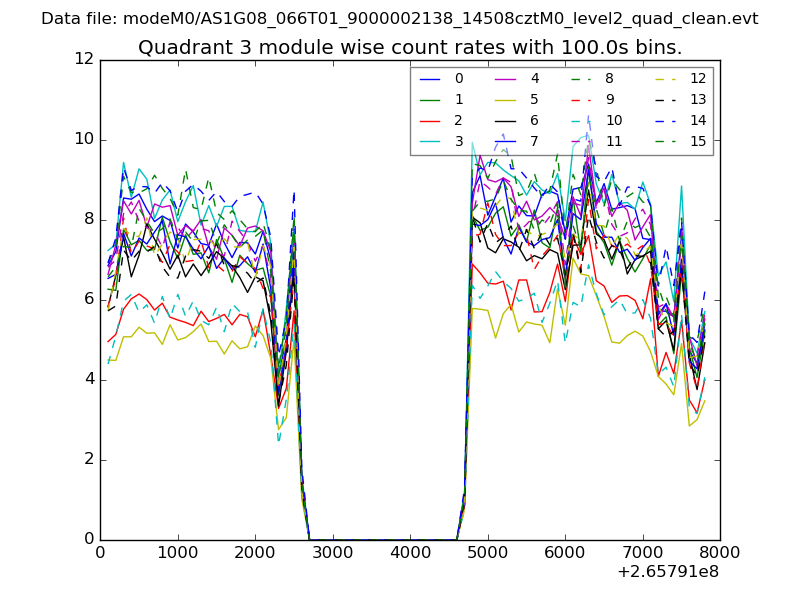
| Module-wise count rates for Quadrant C Data is divided into 100 sec bins |
 |
 |
| Module-wise count rates for Quadrant D Data is divided into 100 sec bins |
 |
 |
| Parameter | Plot |
|---|---|
| CZT HV Monitor | 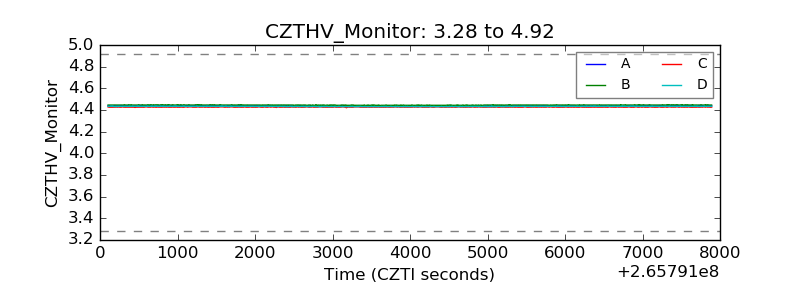 |
| D_VDD | 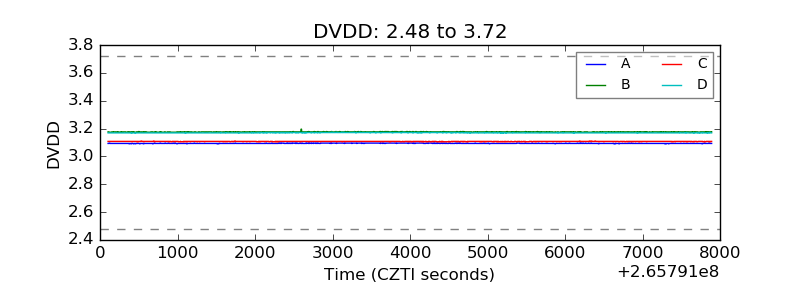 |
| Temperature 1 | 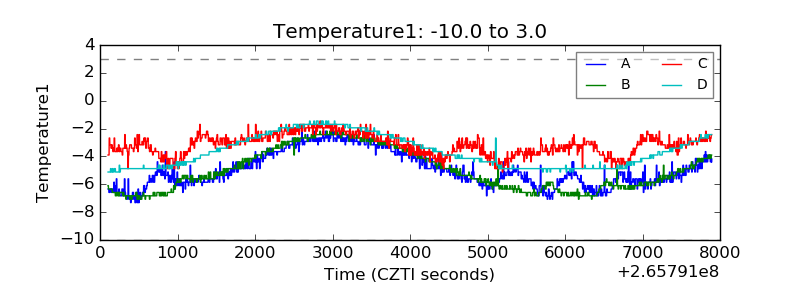 |
| Veto HV Monitor | 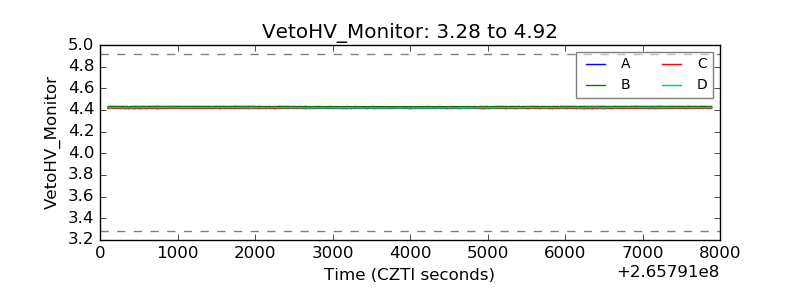 |
| Veto LLD | 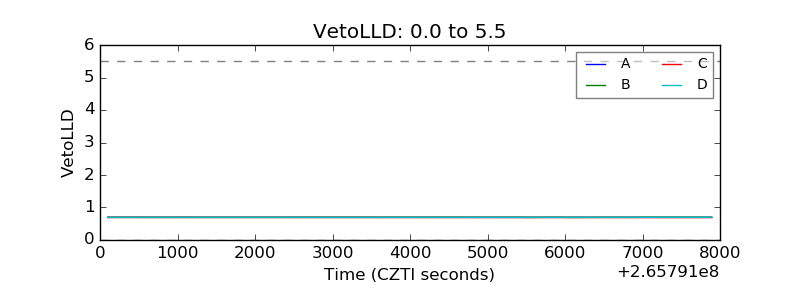 |
| Alpha Counter | 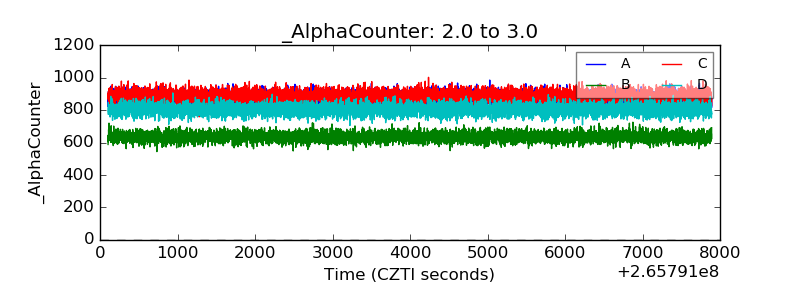 |
| _CPM_Rate | 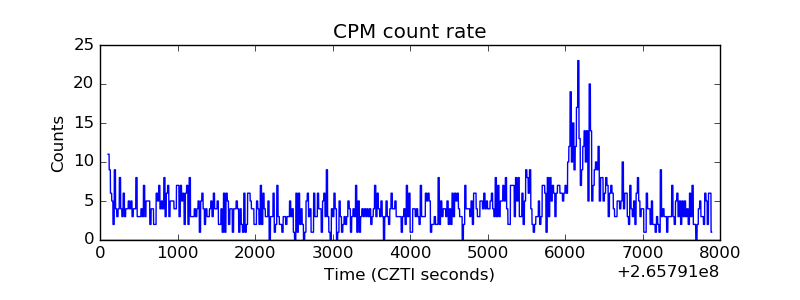 |
| CZT Counter | 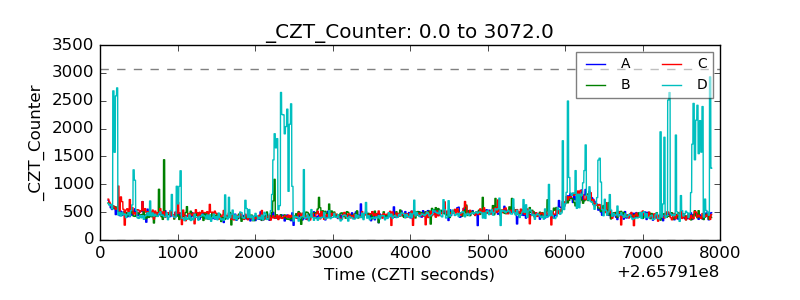 |
| +2.5 Volts monitor |  |
| +5 Volts monitor | 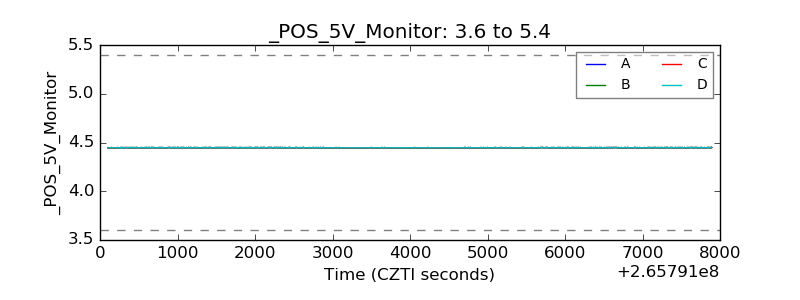 |
| _ROLL_ROT | 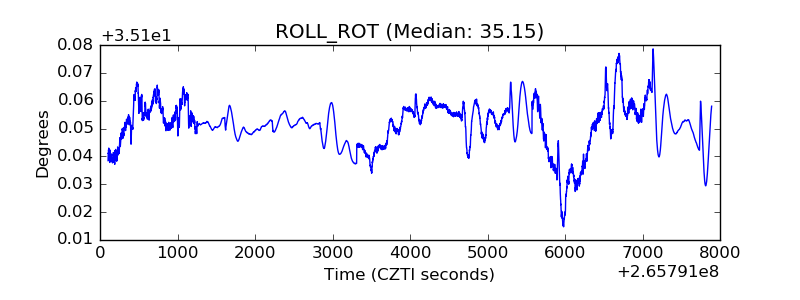 |
| _Roll_DEC |  |
| _Roll_RA | 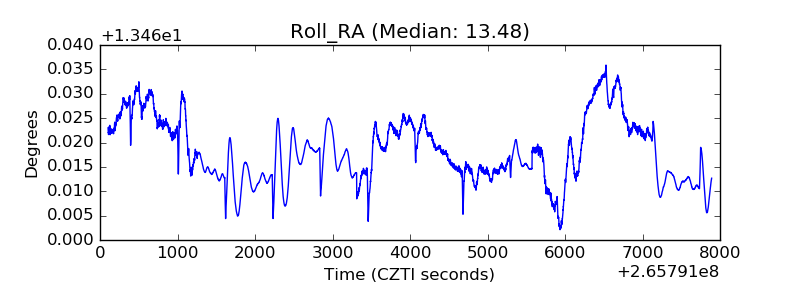 |
| Veto Counter | 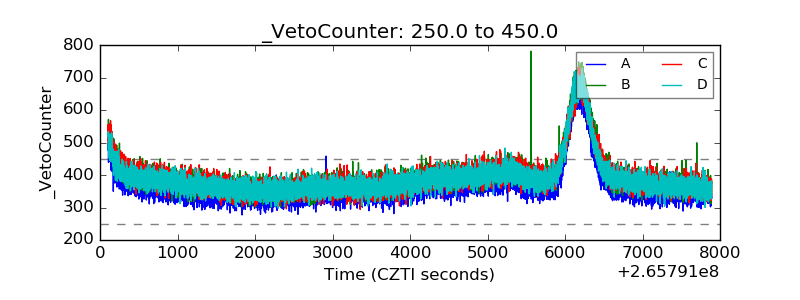 |