| Param | Original file | Final file |
|---|---|---|
| Filename | modeM0/AS1G08_066T01_9000002138_14509cztM0_level2.evt | modeM0/AS1G08_066T01_9000002138_14509cztM0_level2_quad_clean.evt |
| Size (bytes) | 425,819,520 | 72,443,520 |
| Size | 406.1 MB | 69.1 MB |
| Events in quadrant A | 2,764,710 | 460,032 |
| Events in quadrant B | 2,870,660 | 470,661 |
| Events in quadrant C | 2,805,392 | 467,496 |
| Events in quadrant D | 4,048,120 | 377,197 |
| Mode M9 | |||
|---|---|---|---|
| Quadrant | BADHDUFLAG | Total packets | Discarded packets |
| A | 0 | 4 | 0 |
| B | 0 | 4 | 0 |
| C | 0 | 4 | 0 |
| D | 0 | 4 | 0 |
| Mode SS | |||
|---|---|---|---|
| Quadrant | BADHDUFLAG | Total packets | Discarded packets |
| A | 0 | 140 | 18 |
| B | 0 | 140 | 14 |
| C | 0 | 141 | 17 |
| D | 0 | 140 | 22 |
| Mode M0 | |||
|---|---|---|---|
| Quadrant | BADHDUFLAG | Total packets | Discarded packets |
| A | 0 | 14088 | 1903 |
| B | 0 | 14244 | 1856 |
| C | 0 | 14089 | 1880 |
| D | 0 | 20085 | 3930 |
| Quadrant | Total seconds | Saturated seconds | Saturation percentage |
|---|---|---|---|
| A | 5983 | 34 | 0.568277% |
| B | 6023 | 52 | 0.863357% |
| C | 6004 | 25 | 0.416389% |
| D | 5884 | 757 | 12.865398% |
Noise dominated data is calculated using 1-second bins in cleaned event files. If a bin has >2000 counts, and if more than 50% of those come from <1% of pixels, then it is considered to be noise-dominated and hence unusable.
| Quadrant | # 1 sec bins | Bins with >0 counts | Bins with >2000 counts | High rate bins dominated by noise | Noise dominated (total time) | Noise dominated (detector-on time) | Marked lightcurve |
|---|---|---|---|---|---|---|---|
| A | 7393 | 6183 | 2 | 2 | 0.03% | 0.03% | 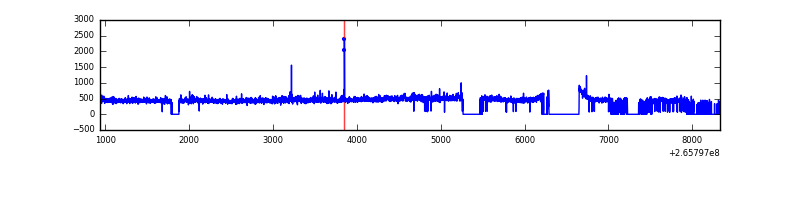 |
| B | 7394 | 6223 | 1 | 1 | 0.01% | 0.02% | 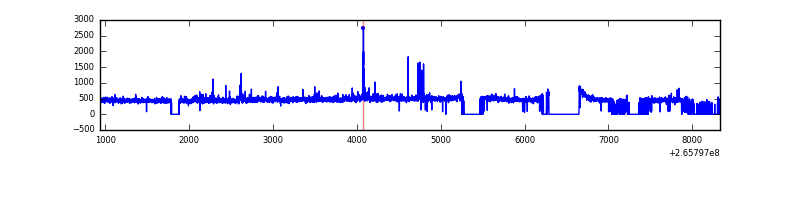 |
| C | 7394 | 6201 | 0 | 0 | 0.00% | 0.00% | 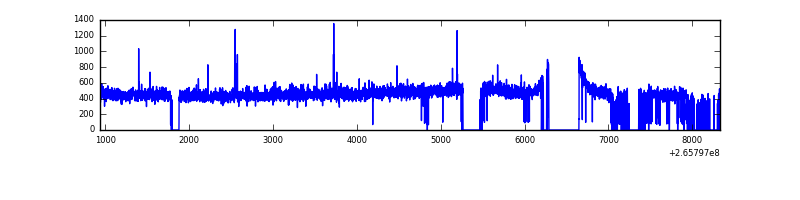 |
| D | 7393 | 6065 | 348 | 348 | 4.71% | 5.74% | 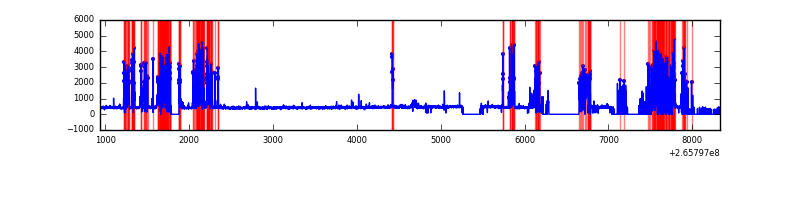 |
Top three noisy pixels from each quadrant. If the there are fewer than three noisy pixels in the level2.evt file, extra rows are filled as -1
| Pixel properties | Quadrant properties | ||||||
|---|---|---|---|---|---|---|---|
| Quadrant | DetID | PixID | Counts | Sigma | Mean | Median | Sigma |
| A | 12 | 189 | 48937 | 337.43 | 696 | 680 | 143.0 |
| A | 8 | 15 | 14366 | 95.7 | 696 | 680 | 143.0 |
| A | 0 | 23 | 13236 | 87.8 | 696 | 680 | 143.0 |
| B | 0 | 189 | 42179 | 307.07 | 698 | 681 | 135.1 |
| B | 0 | 219 | 36268 | 263.33 | 698 | 681 | 135.1 |
| B | 0 | 197 | 17029 | 120.97 | 698 | 681 | 135.1 |
| C | 3 | 233 | 134792 | 840.69 | 681 | 685 | 159.5 |
| C | 0 | 207 | 12499 | 74.06 | 681 | 685 | 159.5 |
| C | 13 | 61 | 4772 | 25.62 | 681 | 685 | 159.5 |
| D | 10 | 199 | 1597238 | 9884.53 | 609 | 595 | 161.5 |
| D | 12 | 110 | 59599 | 365.28 | 609 | 595 | 161.5 |
| D | 2 | 120 | 23421 | 141.31 | 609 | 595 | 161.5 |
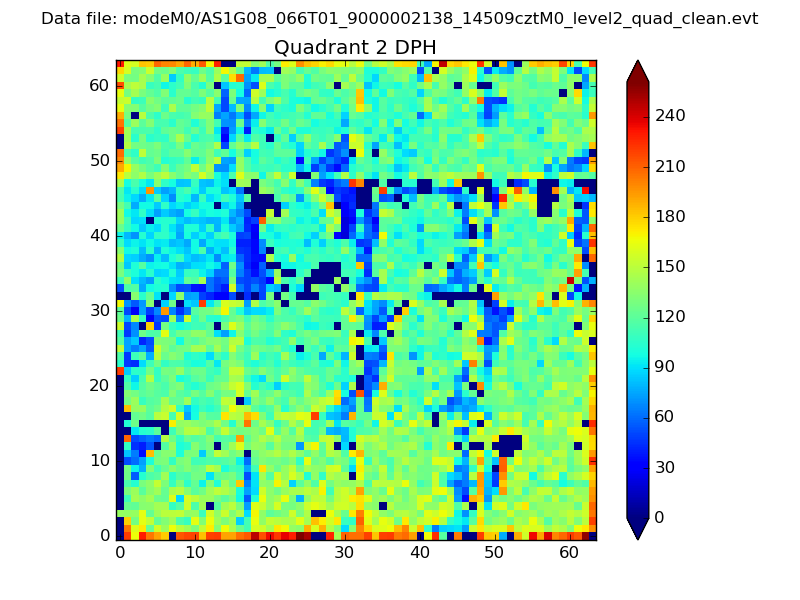
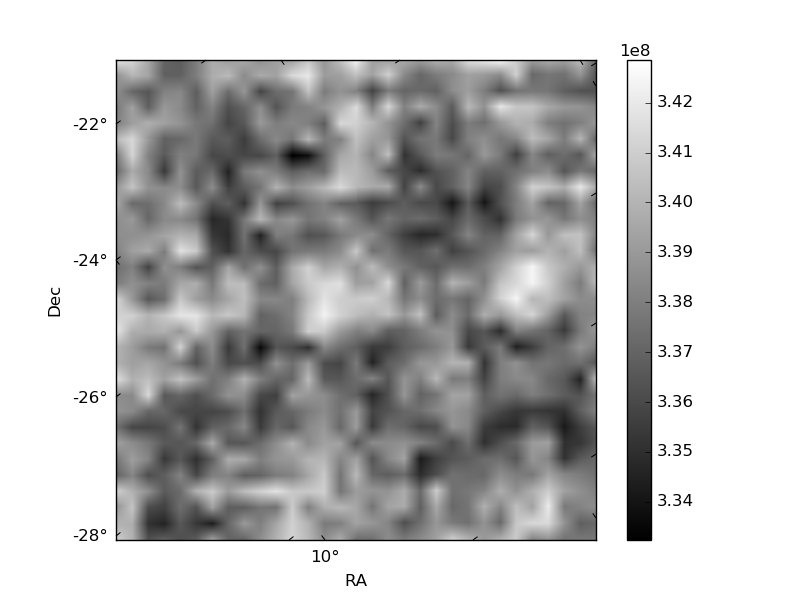
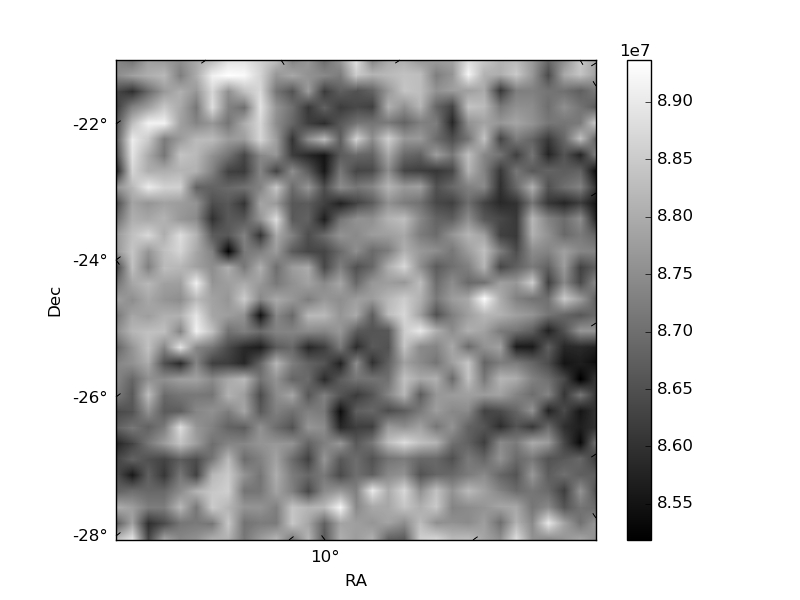
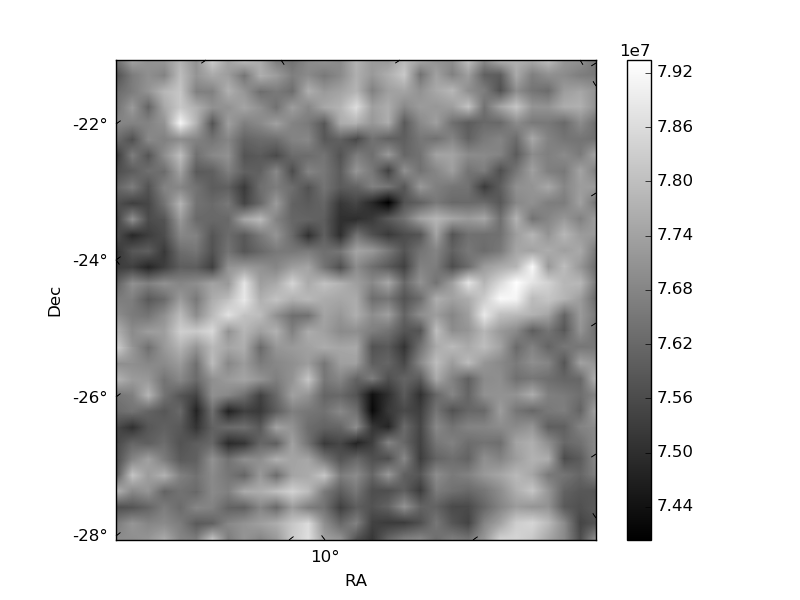
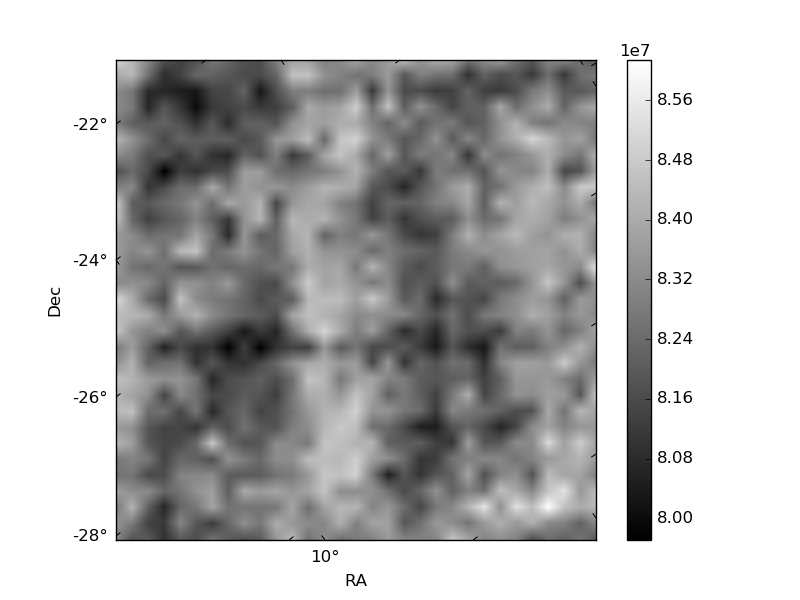
Histogram calculated using DETX and DETY for each event in the final _common_clean file
| Quadrant A | 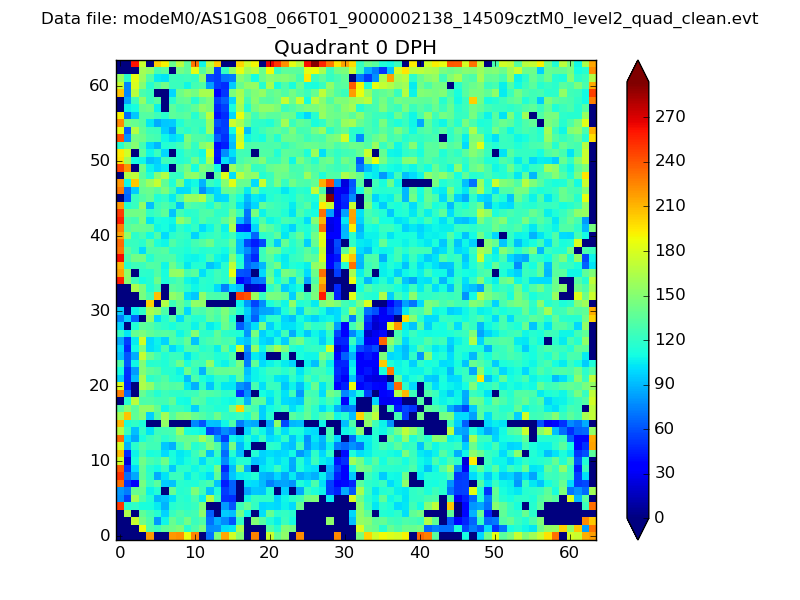 |
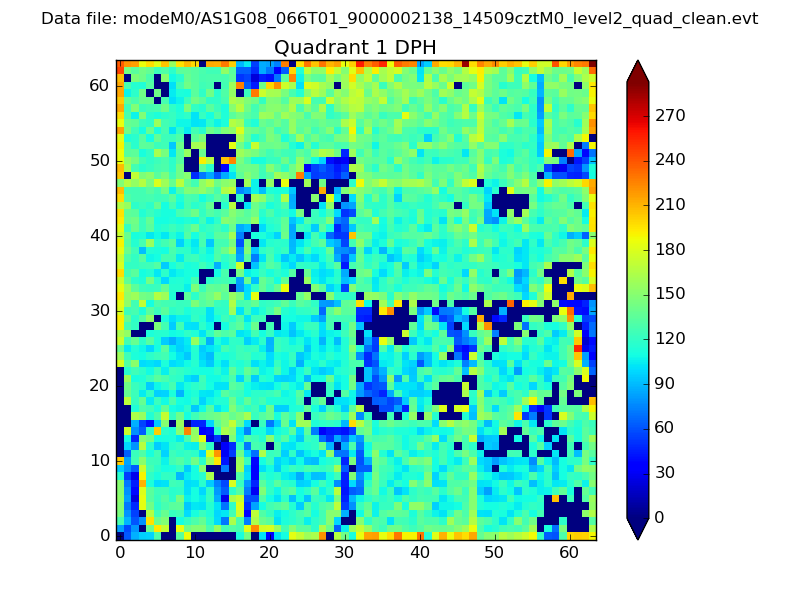 |
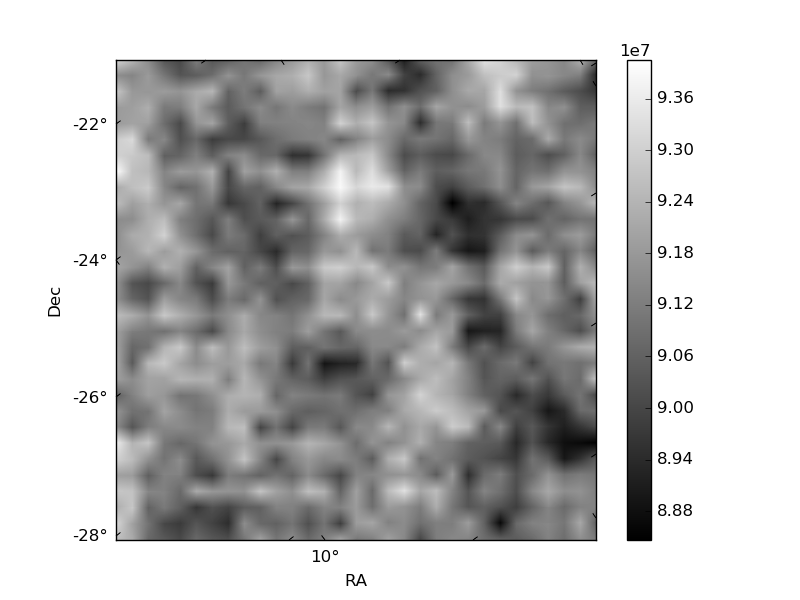
Quadrant B |
|---|---|---|---|
| Quadrant D | 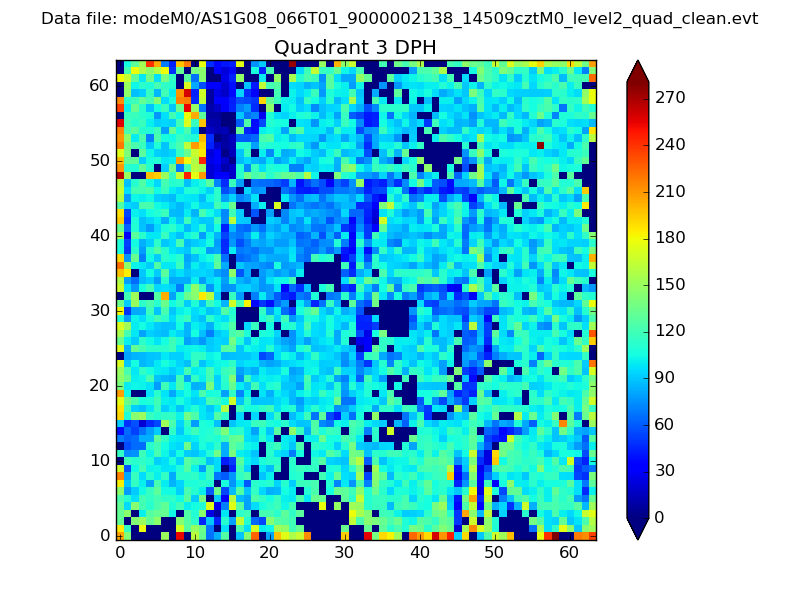 |
 |
Quadrant C |
| Plot type | Count rate plots | Images |
|---|---|---|
| Comparison with Poisson distribution Blue bars denote a histogram of data divided into 1 sec bins. Red curve is a Poisson curve with rate = median count rate of data. |
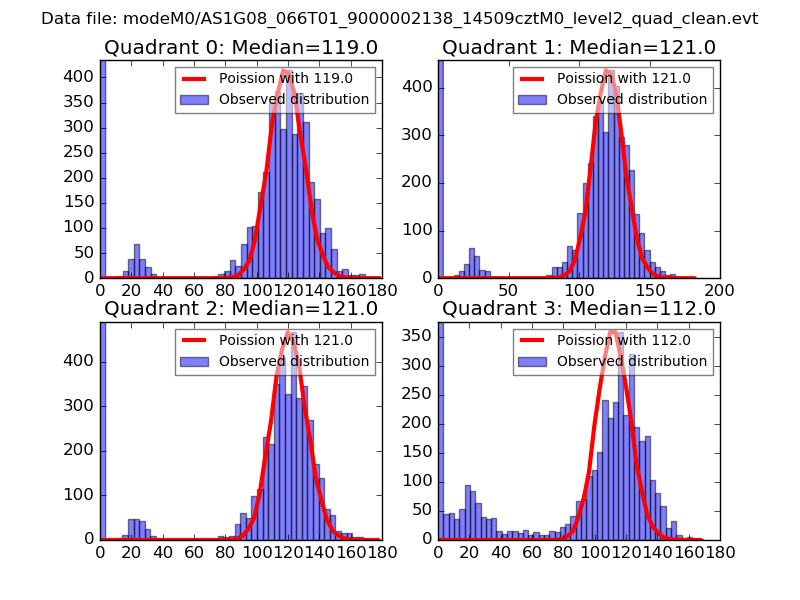 |
 |
| Quadrant-wise count rates Data is divided into 100 sec bins |
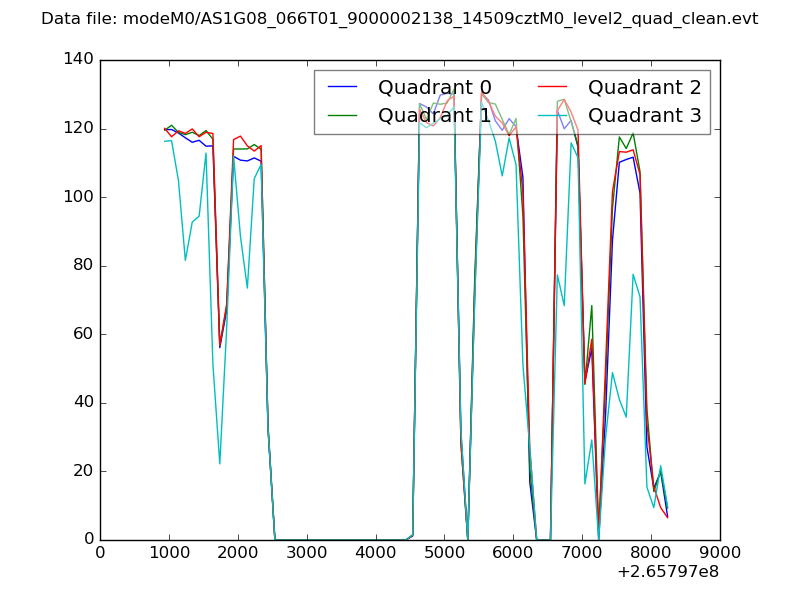 |
|
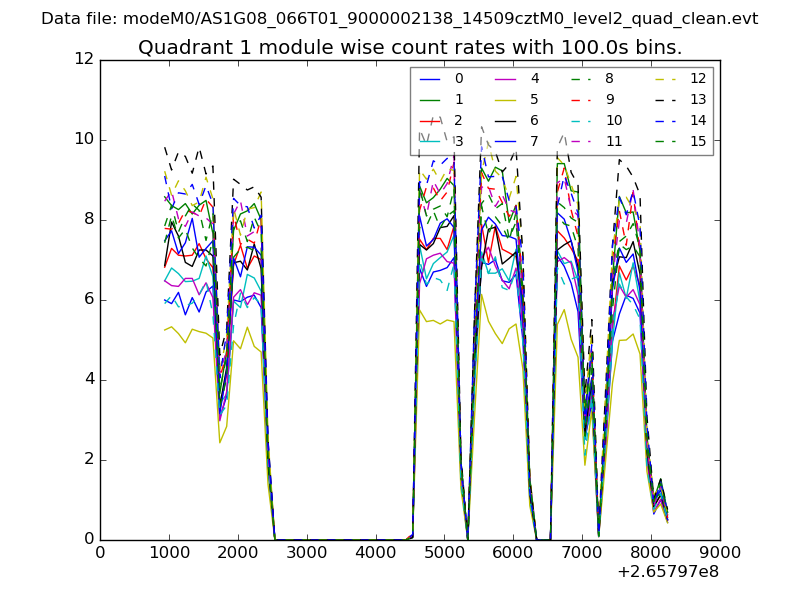
| Module-wise count rates for Quadrant A Data is divided into 100 sec bins |
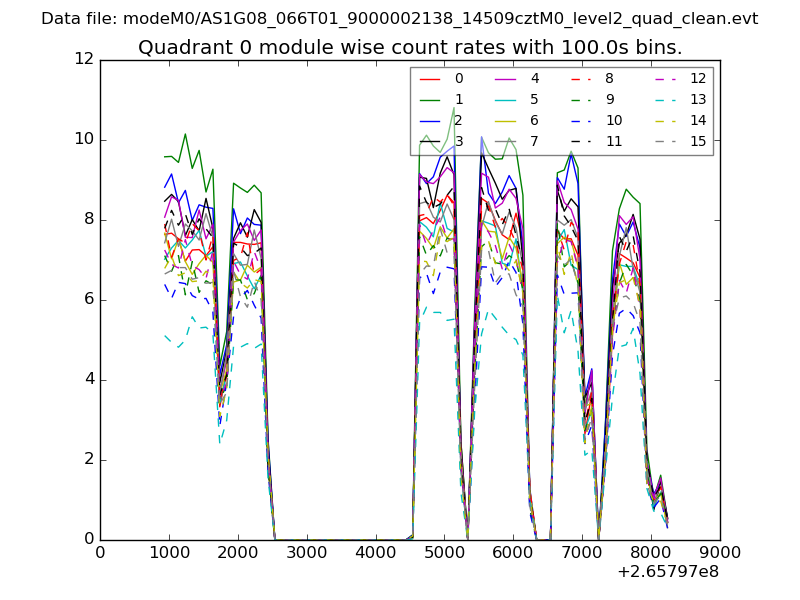 |
 |
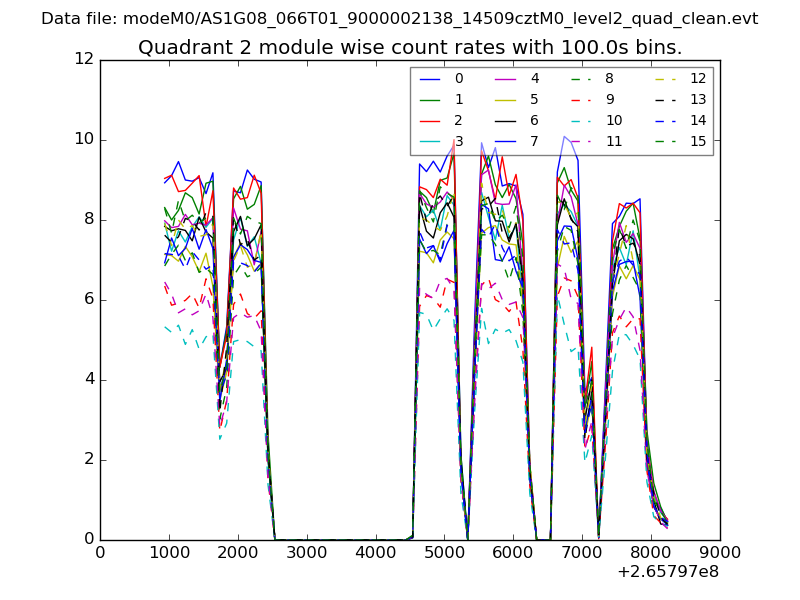
| Module-wise count rates for Quadrant B Data is divided into 100 sec bins |
 |
 |
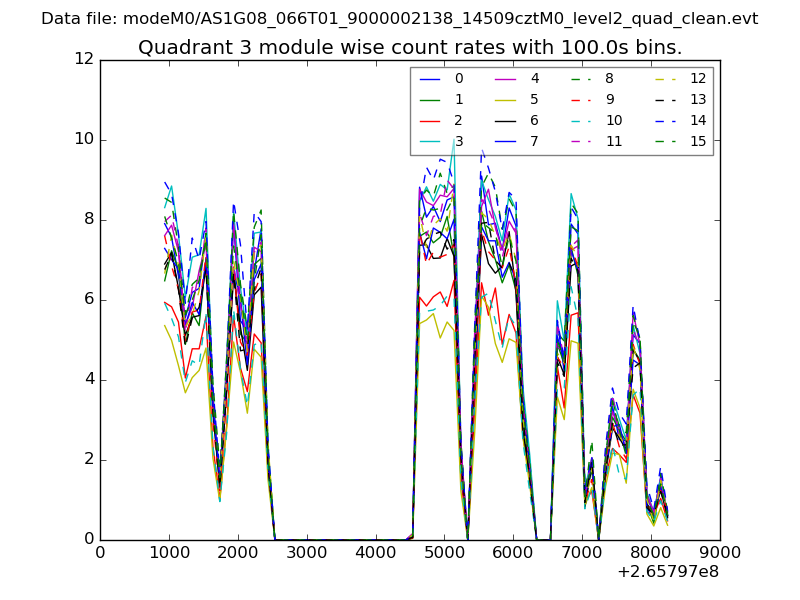
| Module-wise count rates for Quadrant C Data is divided into 100 sec bins |
 |
 |
| Module-wise count rates for Quadrant D Data is divided into 100 sec bins |
 |
 |
| Parameter | Plot |
|---|---|
| CZT HV Monitor | 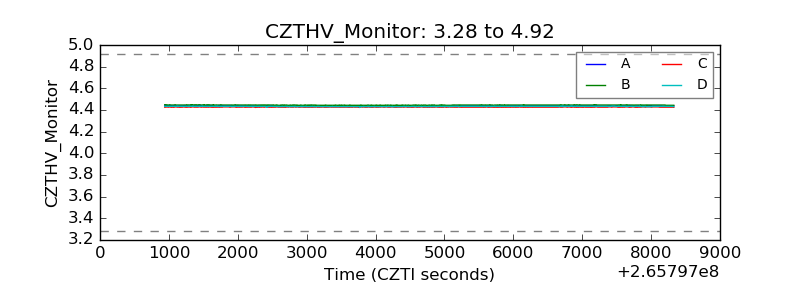 |
| D_VDD | 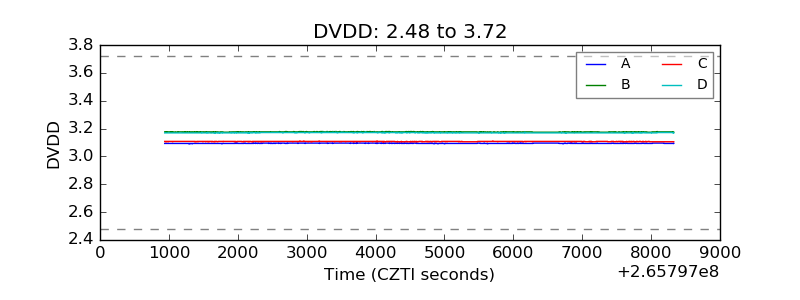 |
| Temperature 1 | 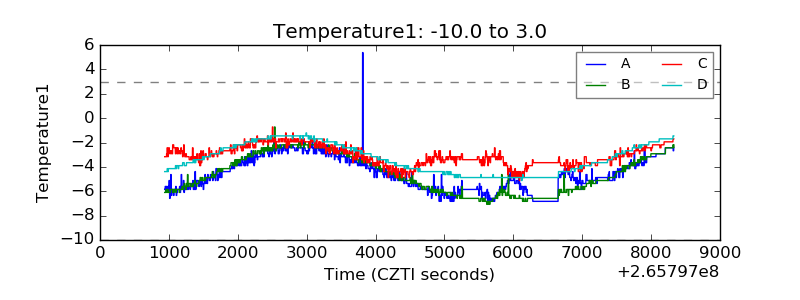 |
| Veto HV Monitor | 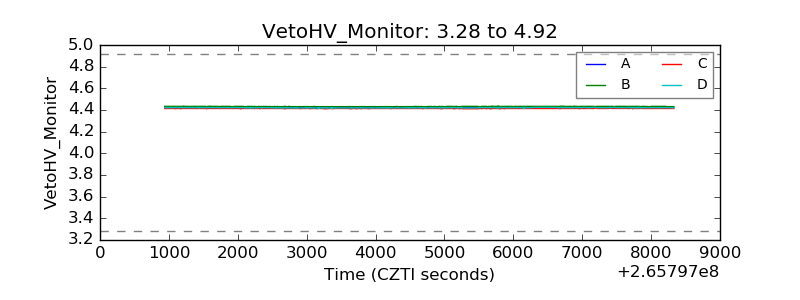 |
| Veto LLD | 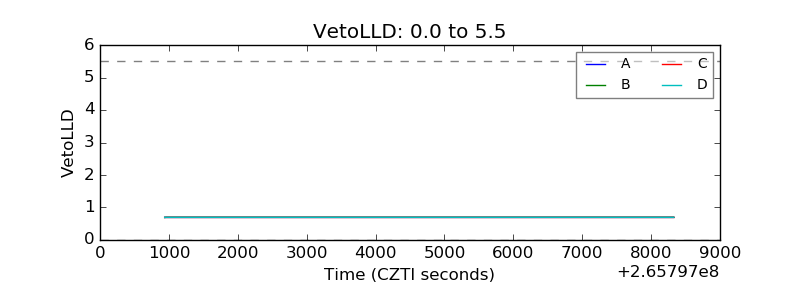 |
| Alpha Counter | 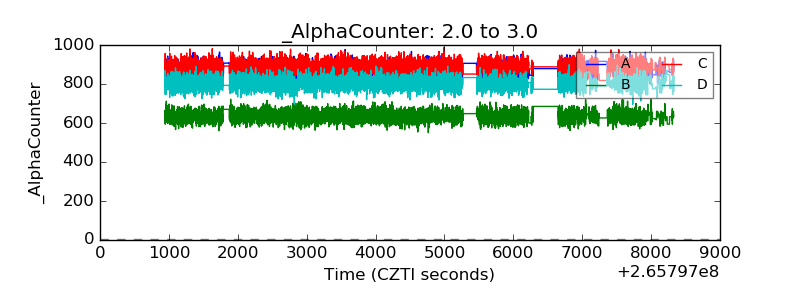 |
| _CPM_Rate | 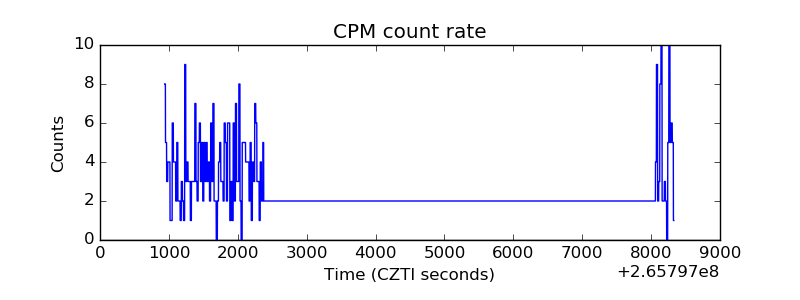 |
| CZT Counter | 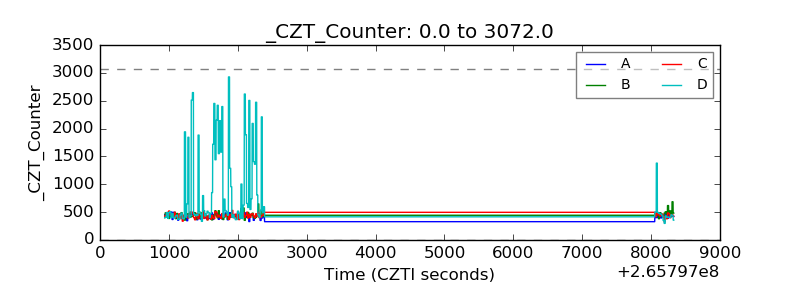 |
| +2.5 Volts monitor |  |
| +5 Volts monitor |  |
| _ROLL_ROT | 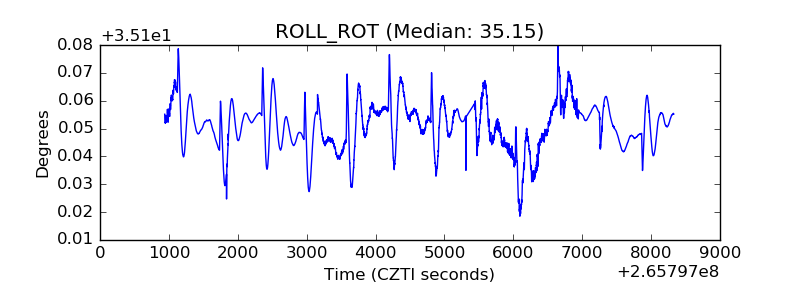 |
| _Roll_DEC | 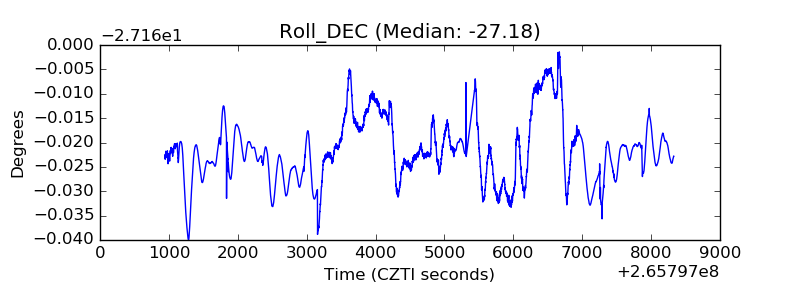 |
| _Roll_RA | 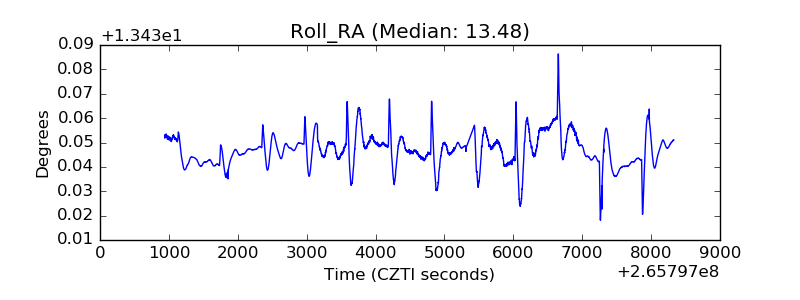 |
| Veto Counter | 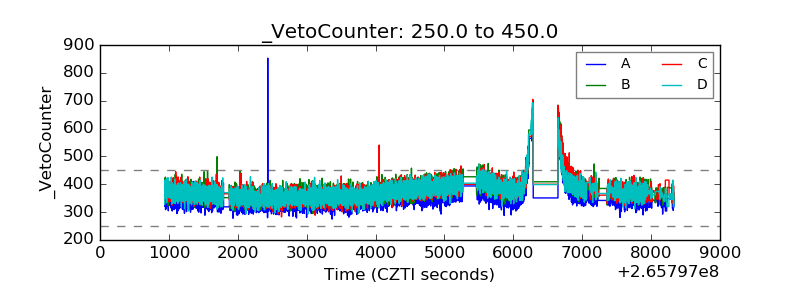 |