| Param | Original file | Final file |
|---|---|---|
| Filename | modeM0/AS1G08_066T01_9000002138_14511cztM0_level2.evt | modeM0/AS1G08_066T01_9000002138_14511cztM0_level2_quad_clean.evt |
| Size (bytes) | 974,030,400 | 147,703,680 |
| Size | 928.9 MB | 140.9 MB |
| Events in quadrant A | 5,935,196 | 921,327 |
| Events in quadrant B | 6,335,863 | 929,733 |
| Events in quadrant C | 8,288,968 | 915,430 |
| Events in quadrant D | 8,085,235 | 834,068 |
| Mode M9 | |||
|---|---|---|---|
| Quadrant | BADHDUFLAG | Total packets | Discarded packets |
| A | 0 | 12 | 0 |
| B | 0 | 12 | 0 |
| C | 0 | 12 | 0 |
| D | 0 | 12 | 0 |
| Mode SS | |||
|---|---|---|---|
| Quadrant | BADHDUFLAG | Total packets | Discarded packets |
| A | 0 | 256 | 0 |
| B | 0 | 256 | 0 |
| C | 0 | 256 | 0 |
| D | 0 | 256 | 0 |
| Mode M0 | |||
|---|---|---|---|
| Quadrant | BADHDUFLAG | Total packets | Discarded packets |
| A | 0 | 25722 | 3 |
| B | 0 | 26419 | 2 |
| C | 0 | 32578 | 2 |
| D | 0 | 32949 | 2 |
| Quadrant | Total seconds | Saturated seconds | Saturation percentage |
|---|---|---|---|
| A | 12616 | 151 | 1.196893% |
| B | 12616 | 173 | 1.371275% |
| C | 12616 | 490 | 3.883957% |
| D | 12616 | 1039 | 8.235574% |
Noise dominated data is calculated using 1-second bins in cleaned event files. If a bin has >2000 counts, and if more than 50% of those come from <1% of pixels, then it is considered to be noise-dominated and hence unusable.
| Quadrant | # 1 sec bins | Bins with >0 counts | Bins with >2000 counts | High rate bins dominated by noise | Noise dominated (total time) | Noise dominated (detector-on time) | Marked lightcurve |
|---|---|---|---|---|---|---|---|
| A | 13827 | 12619 | 0 | 0 | 0.00% | 0.00% | 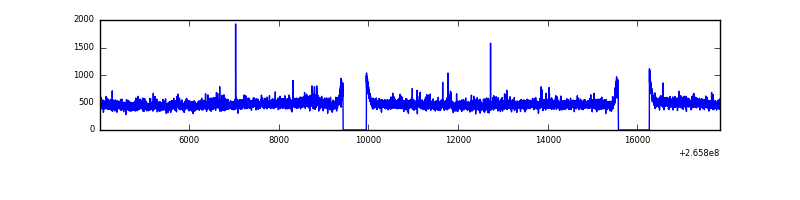 |
| B | 13827 | 12619 | 7 | 7 | 0.05% | 0.06% | 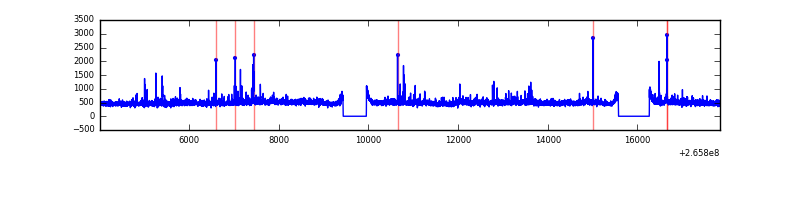 |
| C | 13827 | 12619 | 377 | 377 | 2.73% | 2.99% | 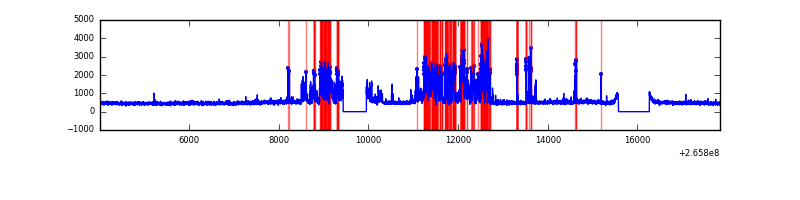 |
| D | 13827 | 12617 | 536 | 536 | 3.88% | 4.25% | 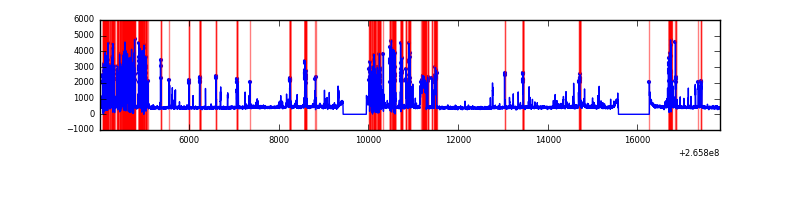 |
Top three noisy pixels from each quadrant. If the there are fewer than three noisy pixels in the level2.evt file, extra rows are filled as -1
| Pixel properties | Quadrant properties | ||||||
|---|---|---|---|---|---|---|---|
| Quadrant | DetID | PixID | Counts | Sigma | Mean | Median | Sigma |
| A | 8 | 15 | 88358 | 285.34 | 1496 | 1460 | 304.5 |
| A | 12 | 189 | 63326 | 203.14 | 1496 | 1460 | 304.5 |
| A | 0 | 23 | 19790 | 60.19 | 1496 | 1460 | 304.5 |
| B | 5 | 29 | 136388 | 471.19 | 1491 | 1453 | 286.4 |
| B | 3 | 209 | 107615 | 370.72 | 1491 | 1453 | 286.4 |
| B | 0 | 189 | 65287 | 222.91 | 1491 | 1453 | 286.4 |
| C | 0 | 207 | 2214008 | 6656.4 | 1436 | 1443 | 332.4 |
| C | 3 | 233 | 450959 | 1352.35 | 1436 | 1443 | 332.4 |
| C | 10 | 22 | 16852 | 46.36 | 1436 | 1443 | 332.4 |
| D | 10 | 199 | 1964301 | 5305.61 | 1387 | 1356 | 370.0 |
| D | 12 | 110 | 670953 | 1809.84 | 1387 | 1356 | 370.0 |
| D | 2 | 120 | 100051 | 266.76 | 1387 | 1356 | 370.0 |
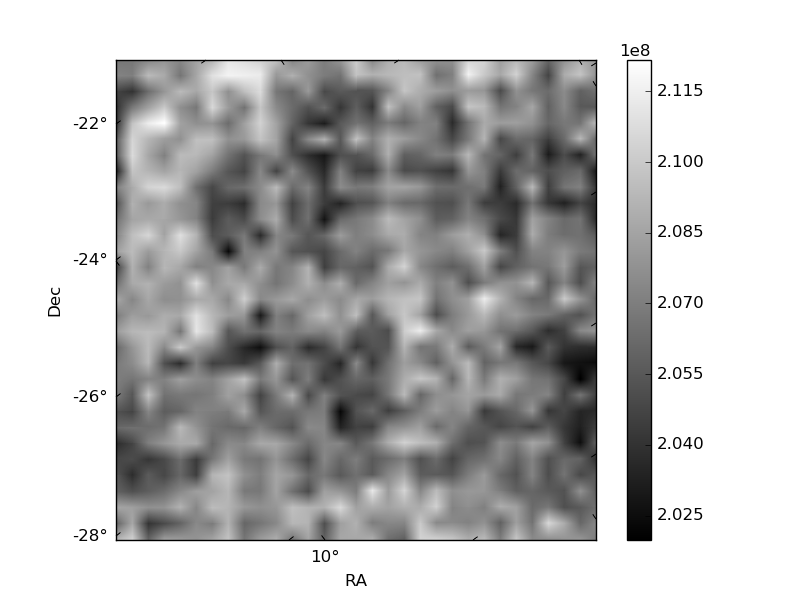
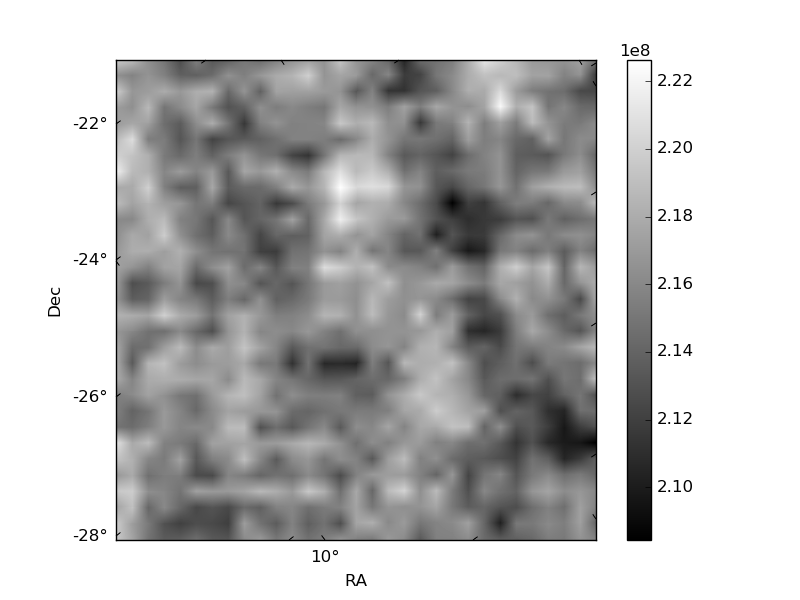
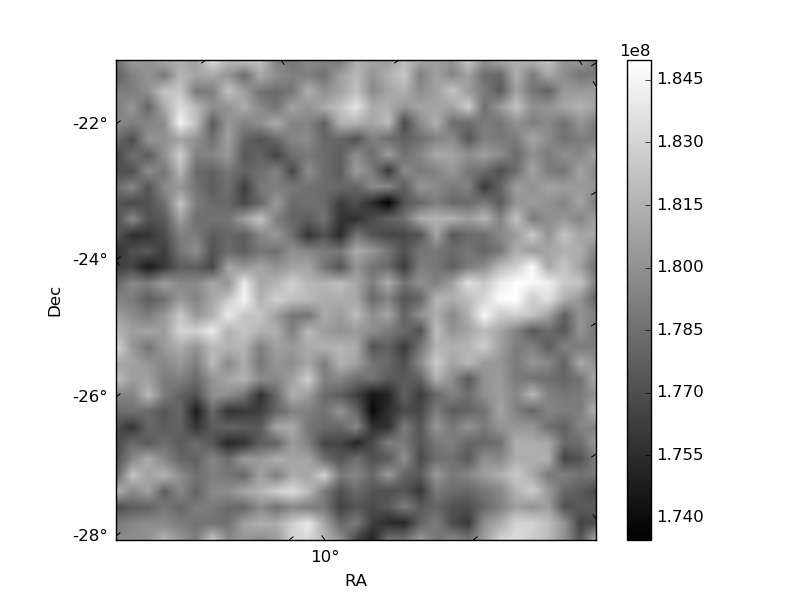
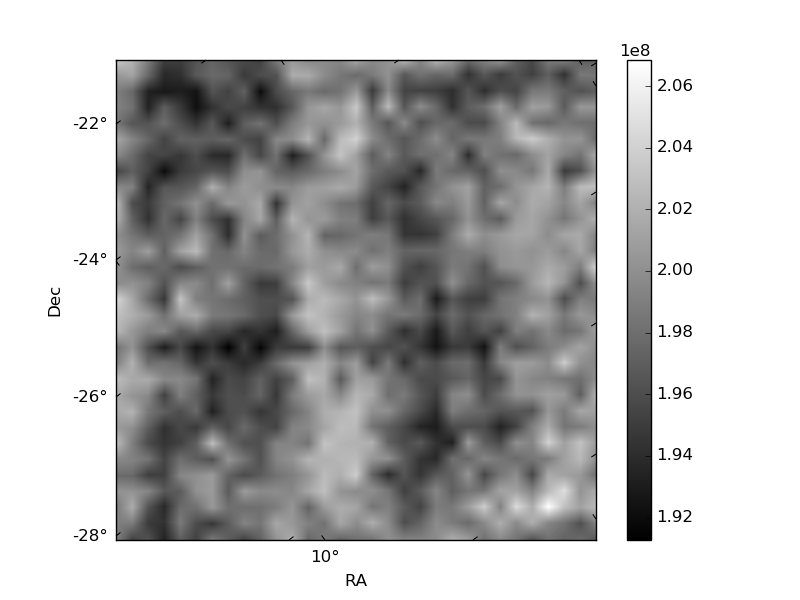
Histogram calculated using DETX and DETY for each event in the final _common_clean file
| Quadrant A | 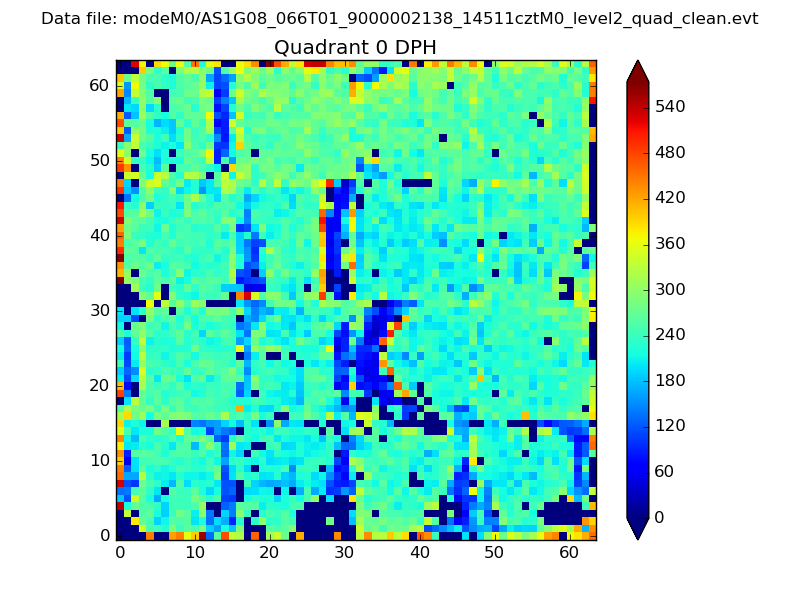 |
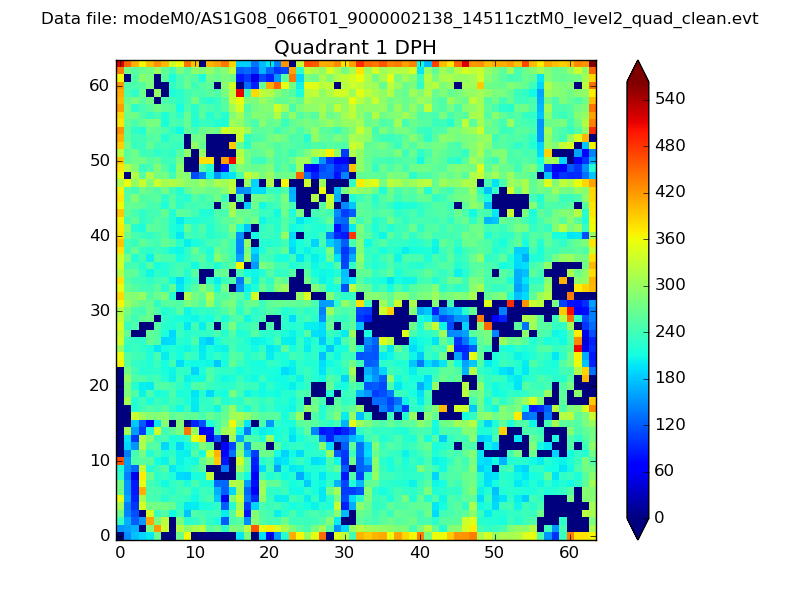 |
Quadrant B |
|---|---|---|---|
| Quadrant D | 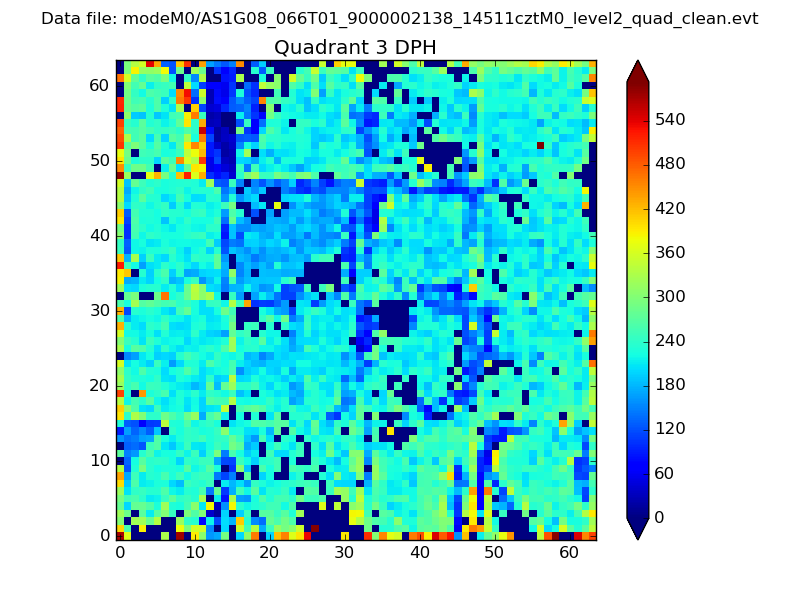 |
 |
Quadrant C |
| Plot type | Count rate plots | Images |
|---|---|---|
| Comparison with Poisson distribution Blue bars denote a histogram of data divided into 1 sec bins. Red curve is a Poisson curve with rate = median count rate of data. |
 |
 |
| Quadrant-wise count rates Data is divided into 100 sec bins |
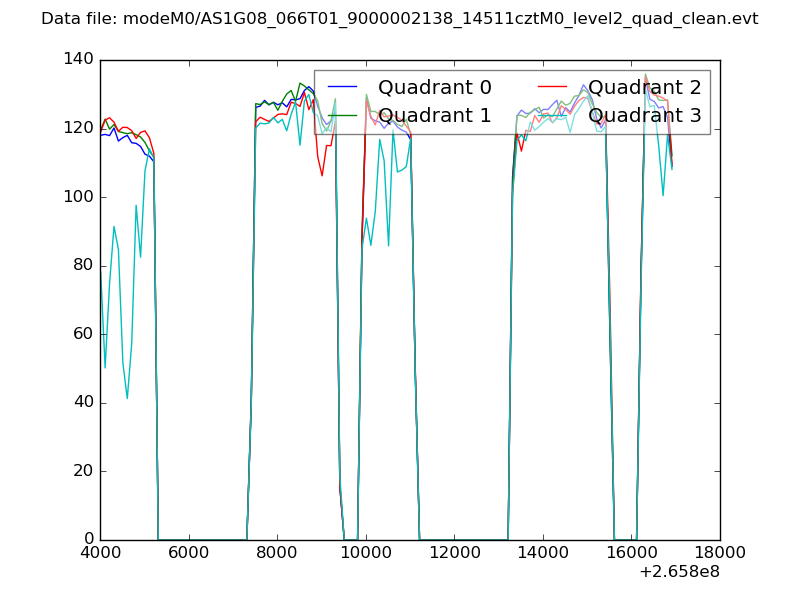 |
|
| Module-wise count rates for Quadrant A Data is divided into 100 sec bins |
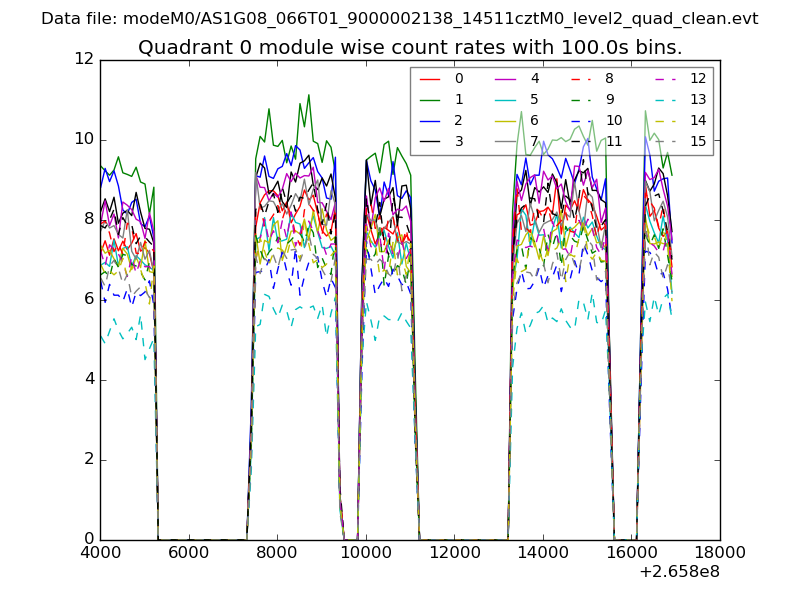 |
 |
| Module-wise count rates for Quadrant B Data is divided into 100 sec bins |
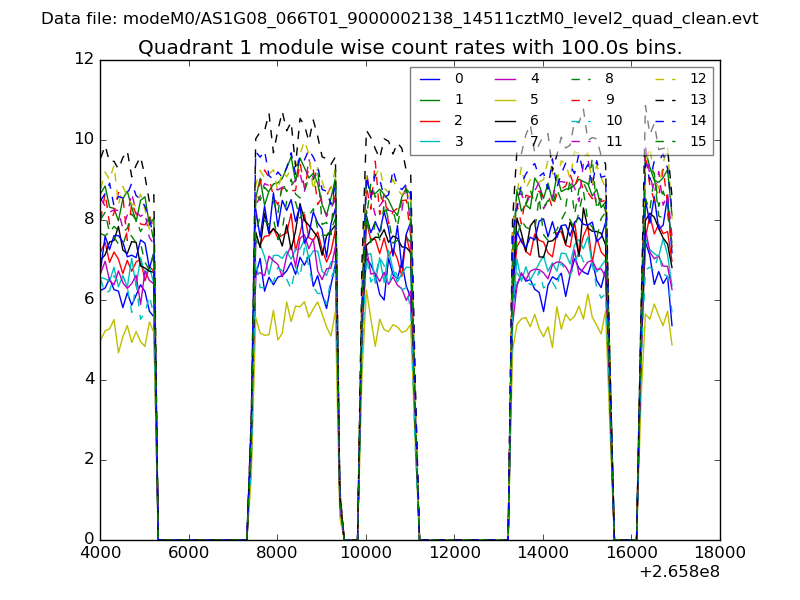 |
 |
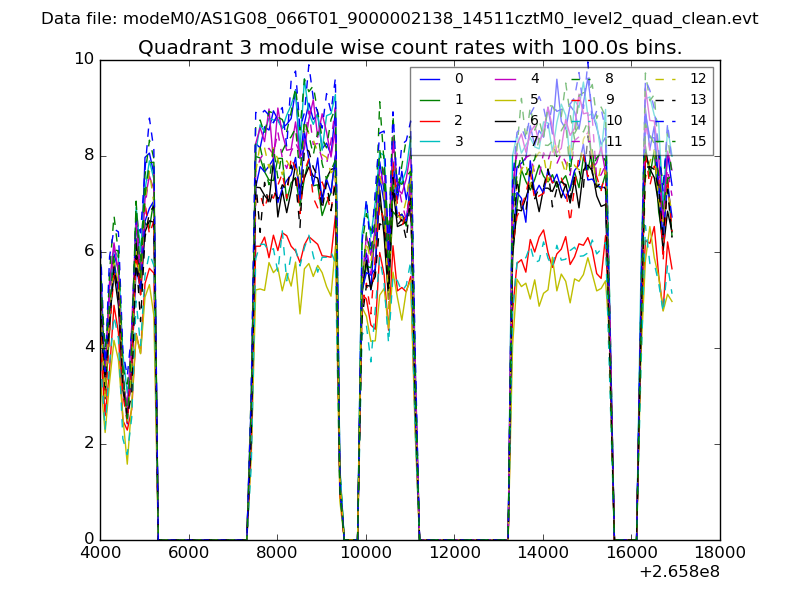
| Module-wise count rates for Quadrant C Data is divided into 100 sec bins |
 |
 |
| Module-wise count rates for Quadrant D Data is divided into 100 sec bins |
 |
 |
| Parameter | Plot |
|---|---|
| CZT HV Monitor |  |
| D_VDD | 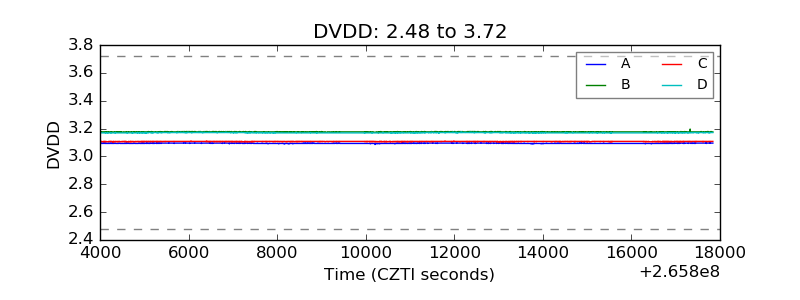 |
| Temperature 1 | 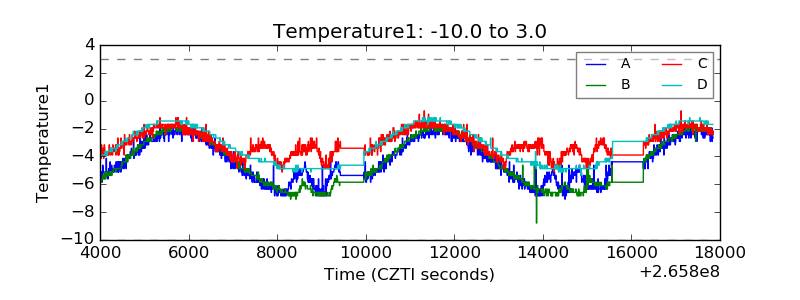 |
| Veto HV Monitor | 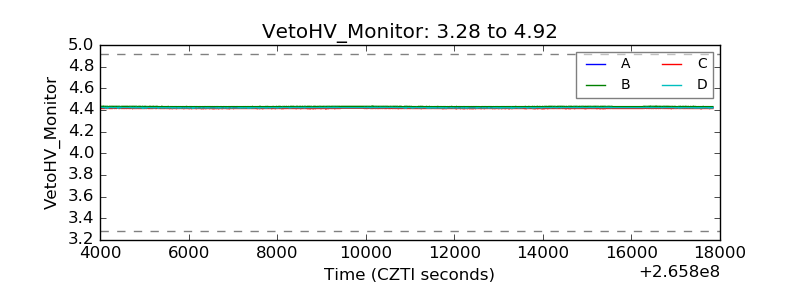 |
| Veto LLD | 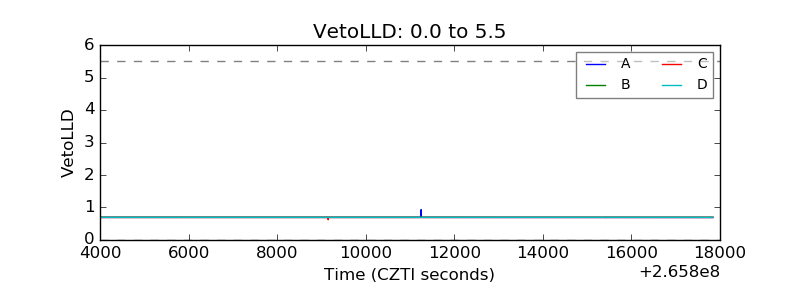 |
| Alpha Counter | 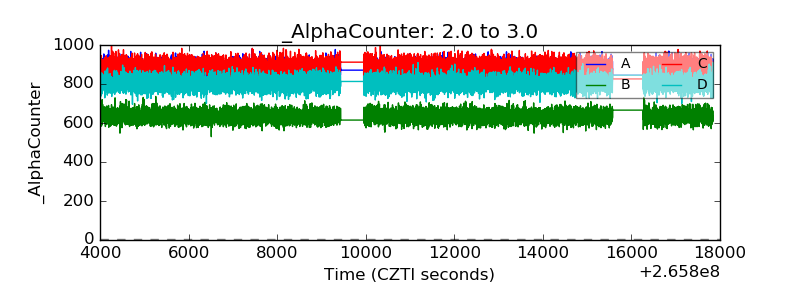 |
| _CPM_Rate | 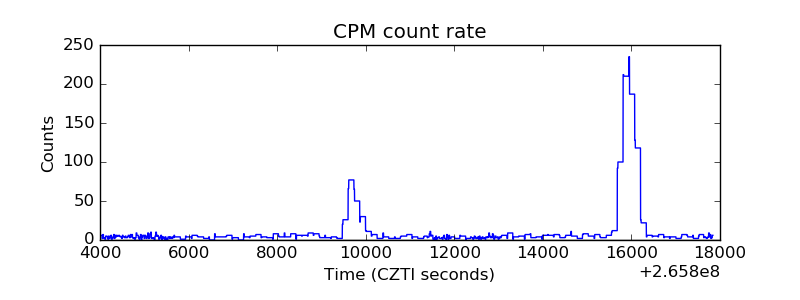 |
| CZT Counter | 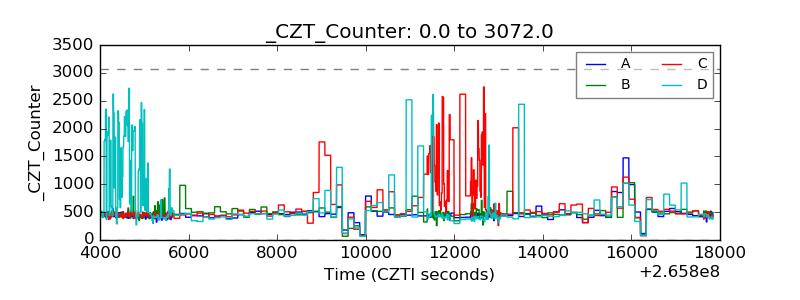 |
| +2.5 Volts monitor |  |
| +5 Volts monitor |  |
| _ROLL_ROT | 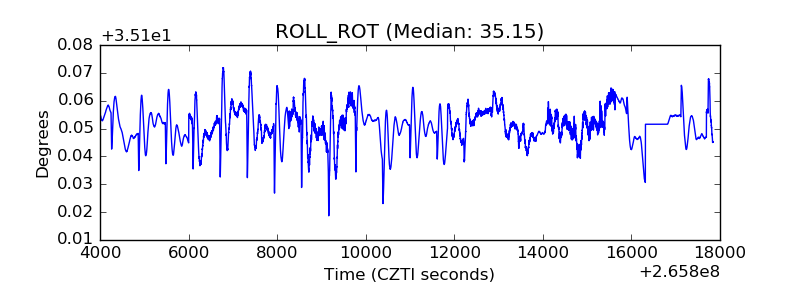 |
| _Roll_DEC | 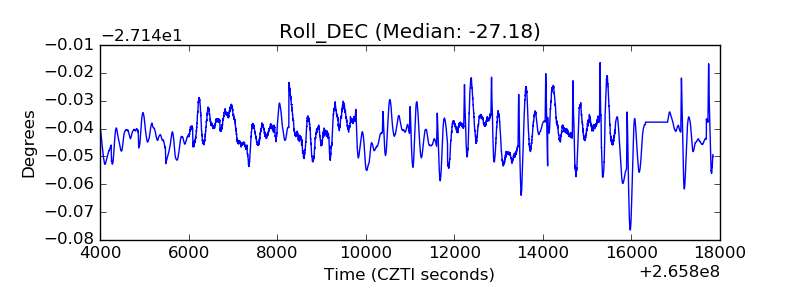 |
| _Roll_RA | 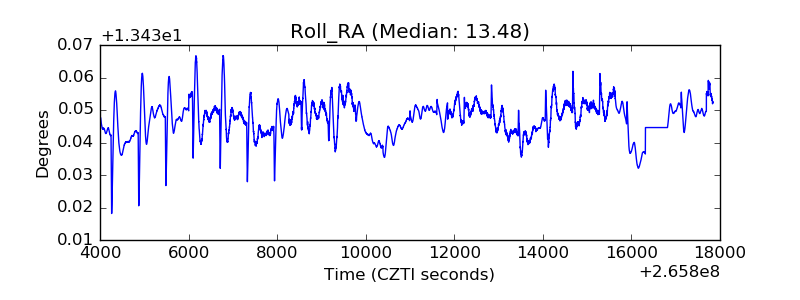 |
| Veto Counter | 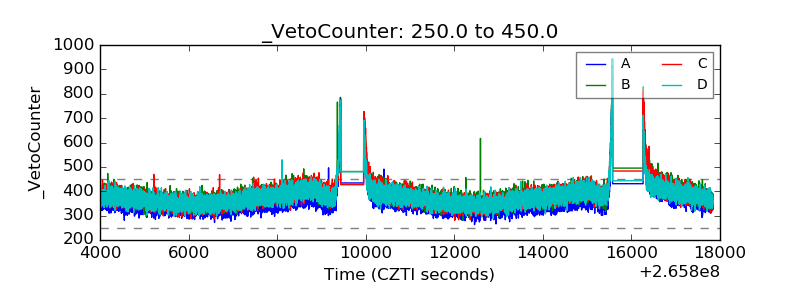 |