| Param | Original file | Final file |
|---|---|---|
| Filename | modeM0/AS1G08_066T01_9000002138_14512cztM0_level2.evt | modeM0/AS1G08_066T01_9000002138_14512cztM0_level2_quad_clean.evt |
| Size (bytes) | 1,686,847,680 | 260,352,000 |
| Size | 1.6 GB | 248.3 MB |
| Events in quadrant A | 10,703,686 | 1,618,844 |
| Events in quadrant B | 11,694,625 | 1,617,566 |
| Events in quadrant C | 13,169,370 | 1,609,177 |
| Events in quadrant D | 13,984,506 | 1,475,598 |
| Mode M9 | |||
|---|---|---|---|
| Quadrant | BADHDUFLAG | Total packets | Discarded packets |
| A | 0 | 25 | 0 |
| B | 0 | 25 | 0 |
| C | 0 | 25 | 0 |
| D | 0 | 25 | 0 |
| Mode SS | |||
|---|---|---|---|
| Quadrant | BADHDUFLAG | Total packets | Discarded packets |
| A | 0 | 460 | 0 |
| B | 0 | 460 | 0 |
| C | 0 | 460 | 0 |
| D | 0 | 460 | 0 |
| Mode M0 | |||
|---|---|---|---|
| Quadrant | BADHDUFLAG | Total packets | Discarded packets |
| A | 0 | 46445 | 5 |
| B | 0 | 48746 | 4 |
| C | 0 | 53405 | 4 |
| D | 0 | 57577 | 4 |
| Quadrant | Total seconds | Saturated seconds | Saturation percentage |
|---|---|---|---|
| A | 22719 | 257 | 1.131212% |
| B | 22719 | 455 | 2.002729% |
| C | 22719 | 566 | 2.491307% |
| D | 22719 | 1596 | 7.024957% |
Noise dominated data is calculated using 1-second bins in cleaned event files. If a bin has >2000 counts, and if more than 50% of those come from <1% of pixels, then it is considered to be noise-dominated and hence unusable.
| Quadrant | # 1 sec bins | Bins with >0 counts | Bins with >2000 counts | High rate bins dominated by noise | Noise dominated (total time) | Noise dominated (detector-on time) | Marked lightcurve |
|---|---|---|---|---|---|---|---|
| A | 25180 | 22724 | 2 | 2 | 0.01% | 0.01% | 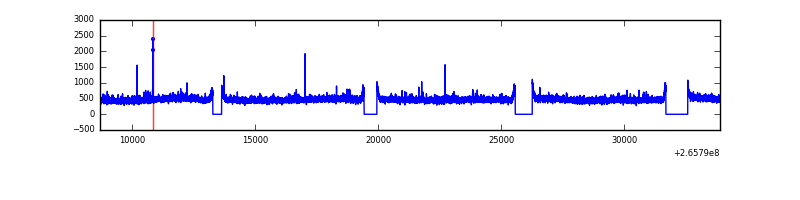 |
| B | 25180 | 22724 | 117 | 117 | 0.46% | 0.51% | 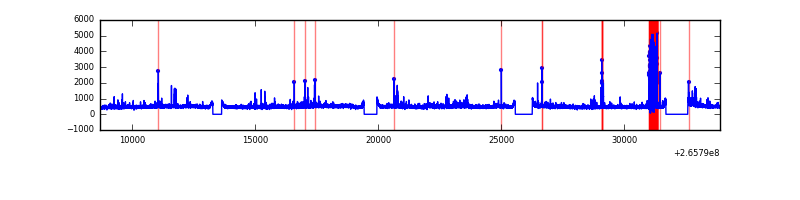 |
| C | 25180 | 22724 | 383 | 383 | 1.52% | 1.69% | 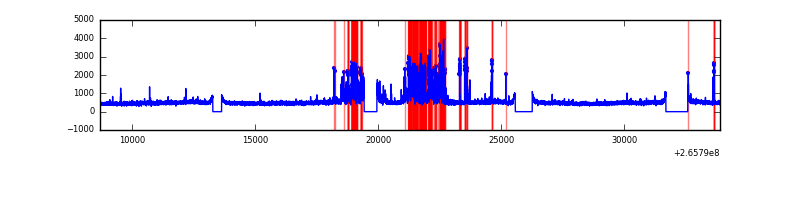 |
| D | 25180 | 22722 | 839 | 839 | 3.33% | 3.69% | 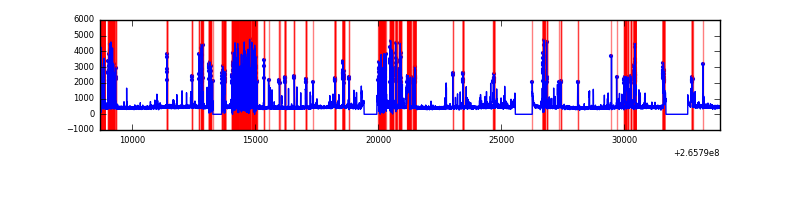 |
Top three noisy pixels from each quadrant. If the there are fewer than three noisy pixels in the level2.evt file, extra rows are filled as -1
| Pixel properties | Quadrant properties | ||||||
|---|---|---|---|---|---|---|---|
| Quadrant | DetID | PixID | Counts | Sigma | Mean | Median | Sigma |
| A | 12 | 189 | 137169 | 245.94 | 2702 | 2639 | 547.0 |
| A | 8 | 15 | 107795 | 192.24 | 2702 | 2639 | 547.0 |
| A | 0 | 23 | 41148 | 70.4 | 2702 | 2639 | 547.0 |
| B | 10 | 249 | 375591 | 729.22 | 2684 | 2613 | 511.5 |
| B | 5 | 29 | 149620 | 287.42 | 2684 | 2613 | 511.5 |
| B | 0 | 189 | 149013 | 286.23 | 2684 | 2613 | 511.5 |
| C | 0 | 207 | 2249323 | 3708.72 | 2609 | 2620 | 605.8 |
| C | 3 | 233 | 724887 | 1192.28 | 2609 | 2620 | 605.8 |
| C | 10 | 22 | 22362 | 32.59 | 2609 | 2620 | 605.8 |
| D | 10 | 199 | 3107547 | 4596.1 | 2524 | 2466 | 675.6 |
| D | 12 | 110 | 912684 | 1347.29 | 2524 | 2466 | 675.6 |
| D | 2 | 120 | 147272 | 214.34 | 2524 | 2466 | 675.6 |
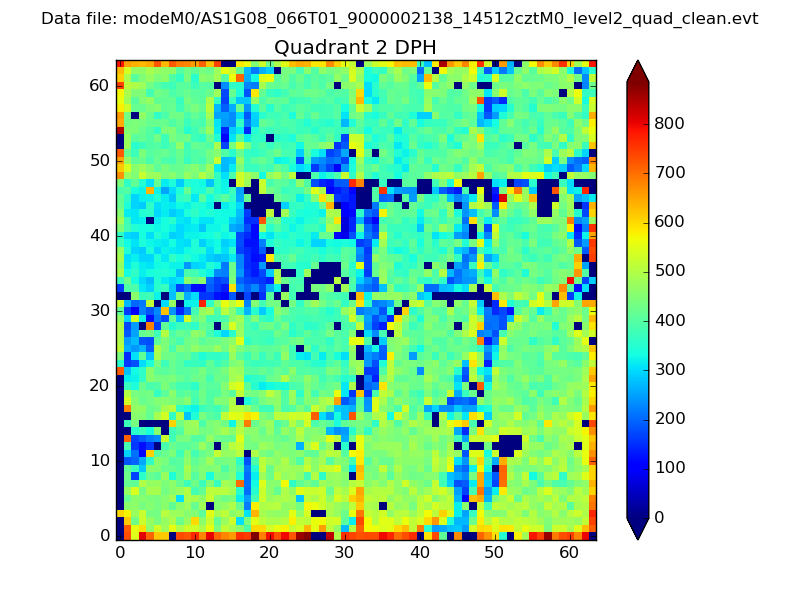
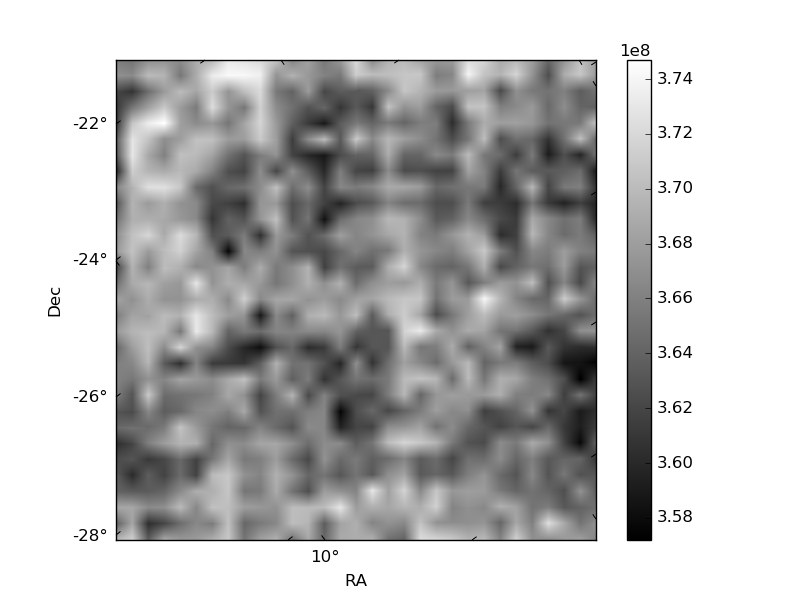
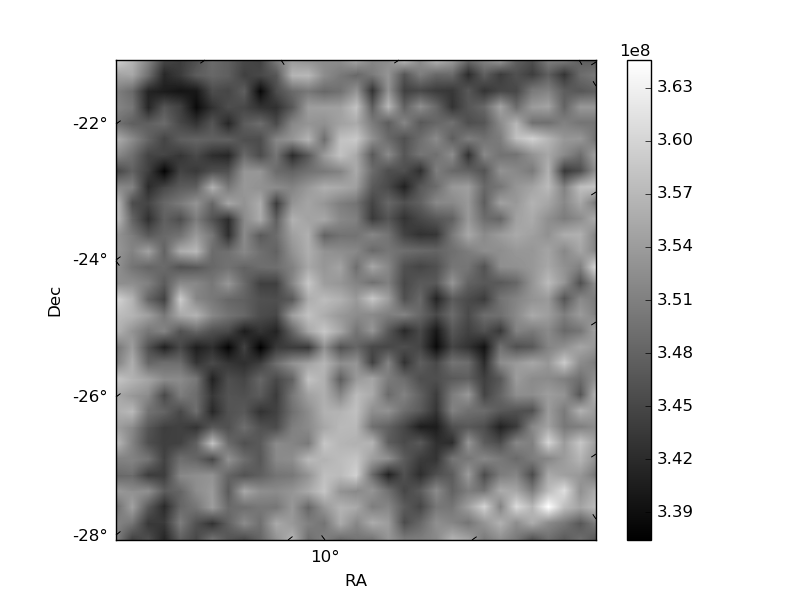
Histogram calculated using DETX and DETY for each event in the final _common_clean file
| Quadrant A | 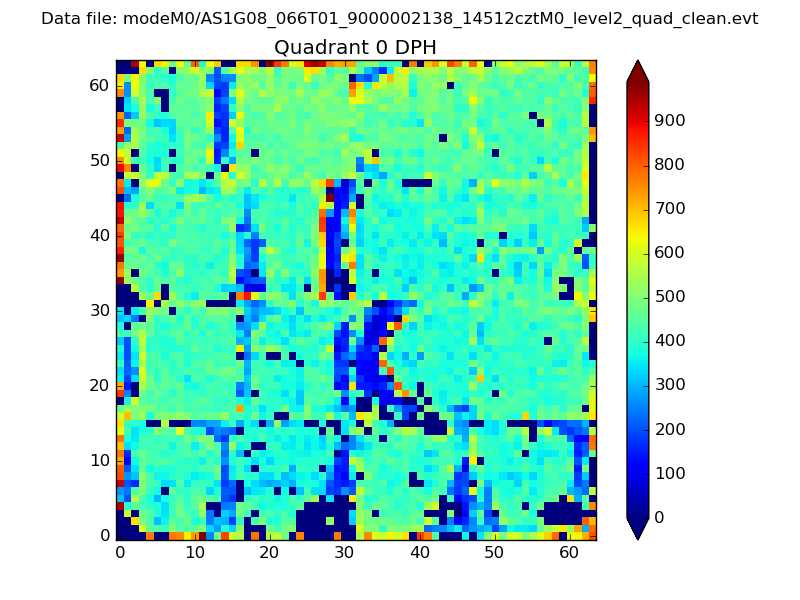 |
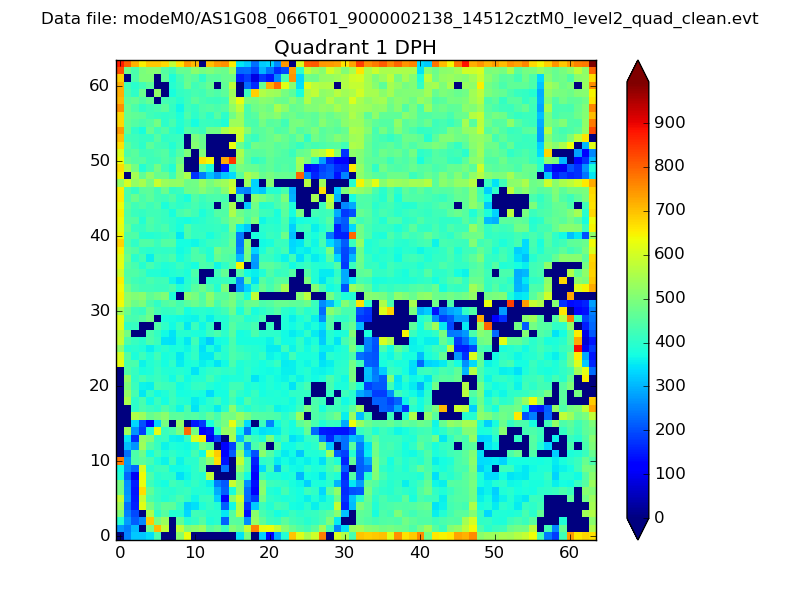 |
Quadrant B |
|---|---|---|---|
| Quadrant D | 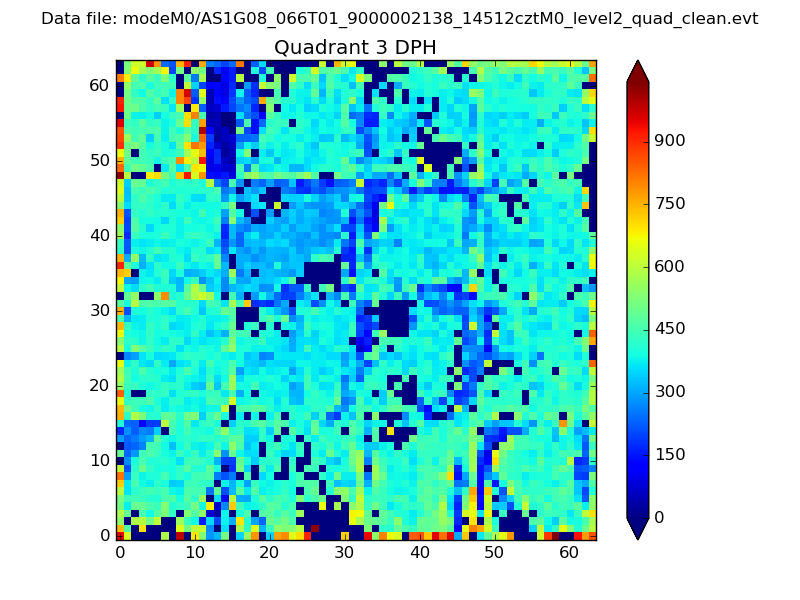 |
 |
Quadrant C |
| Plot type | Count rate plots | Images |
|---|---|---|
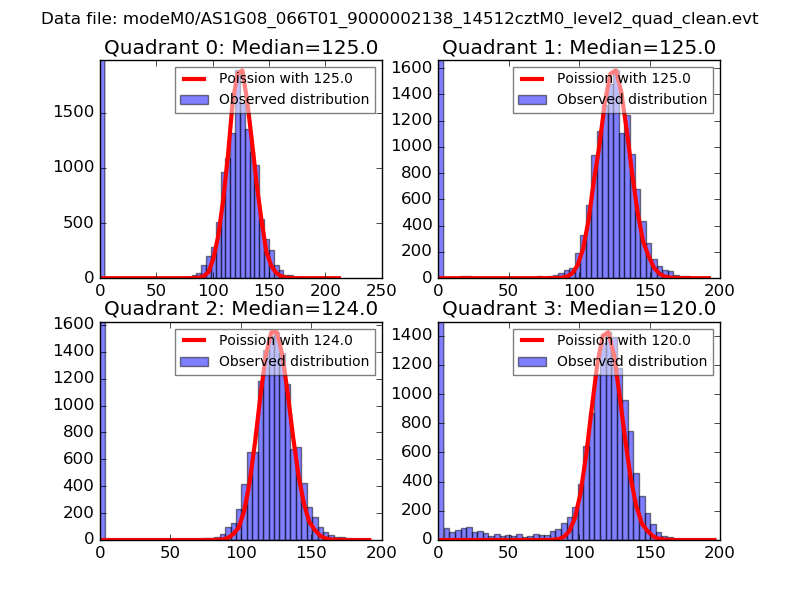
| Comparison with Poisson distribution Blue bars denote a histogram of data divided into 1 sec bins. Red curve is a Poisson curve with rate = median count rate of data. |
 |
 |
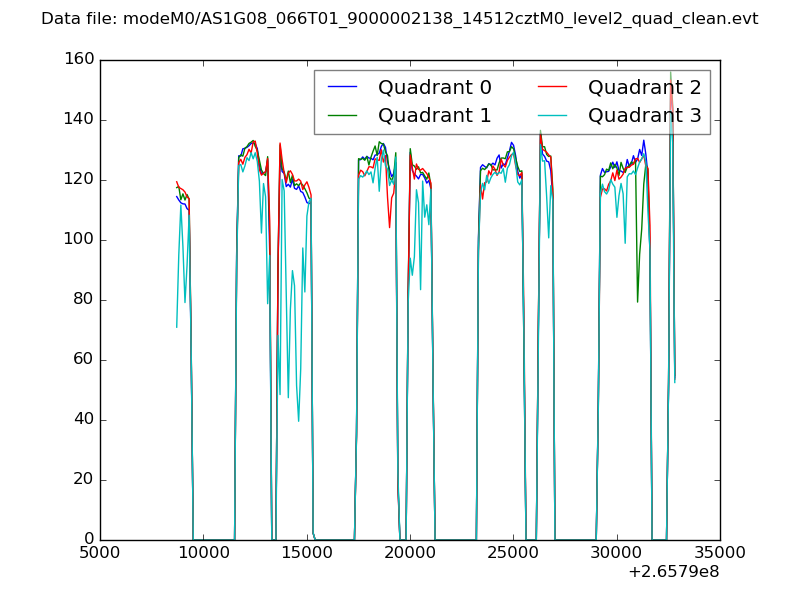
| Quadrant-wise count rates Data is divided into 100 sec bins |
 |
|
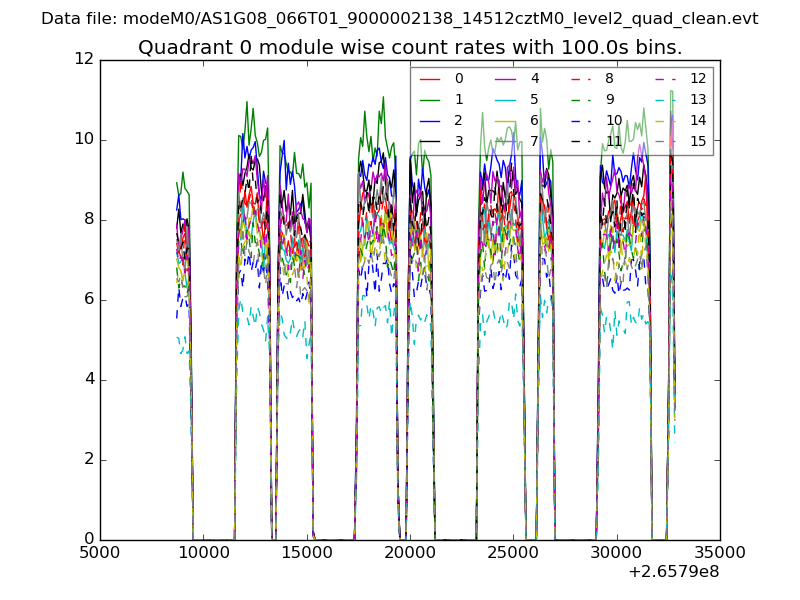
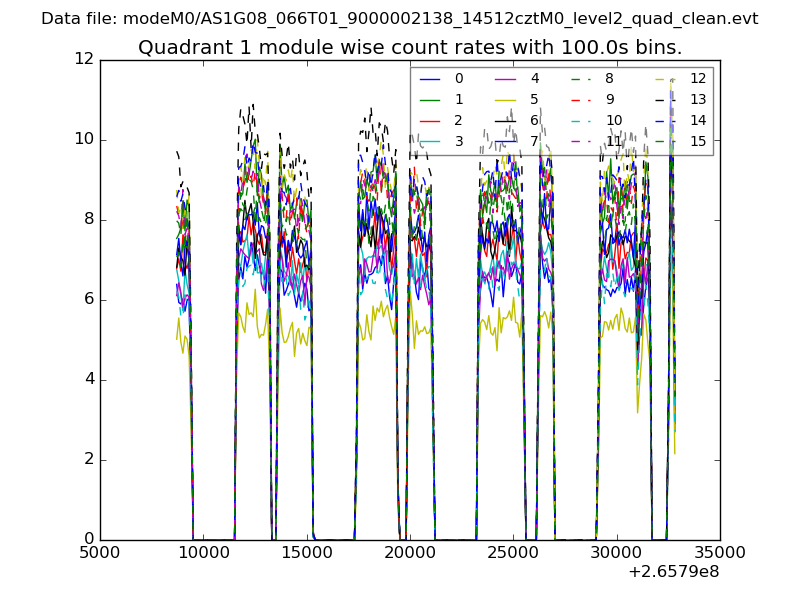
| Module-wise count rates for Quadrant A Data is divided into 100 sec bins |
 |
 |
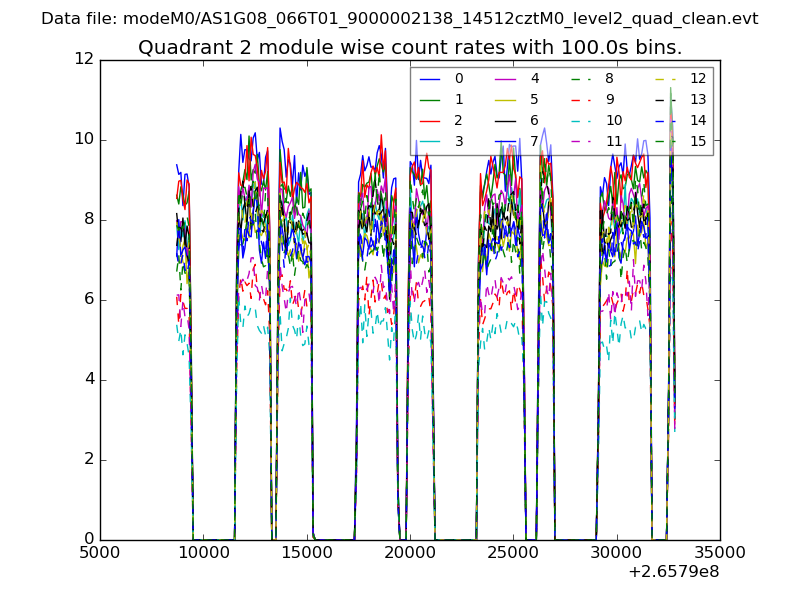
| Module-wise count rates for Quadrant B Data is divided into 100 sec bins |
 |
 |
| Module-wise count rates for Quadrant C Data is divided into 100 sec bins |
 |
 |
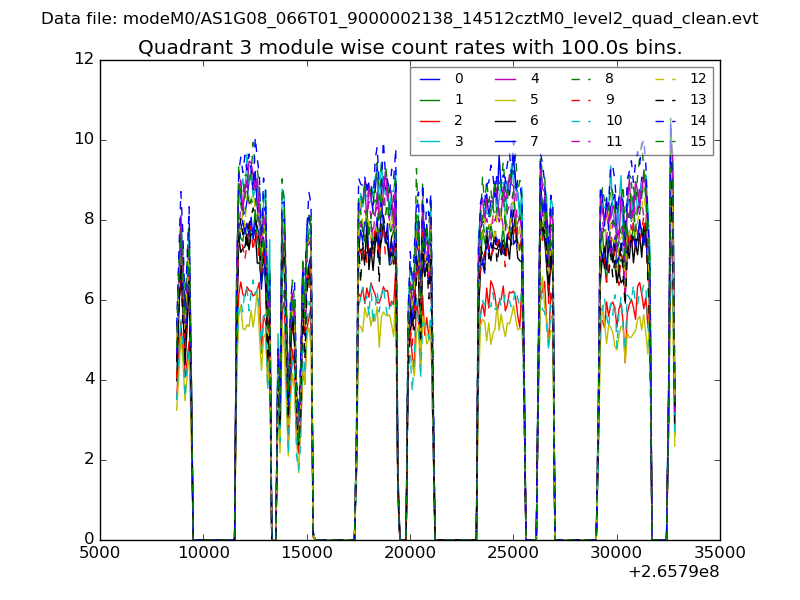
| Module-wise count rates for Quadrant D Data is divided into 100 sec bins |
 |
 |
| Parameter | Plot |
|---|---|
| CZT HV Monitor | 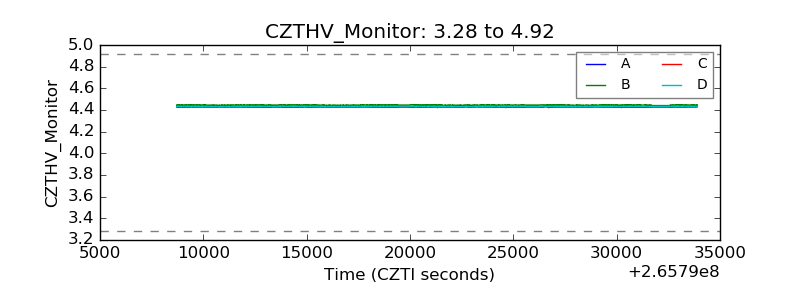 |
| D_VDD | 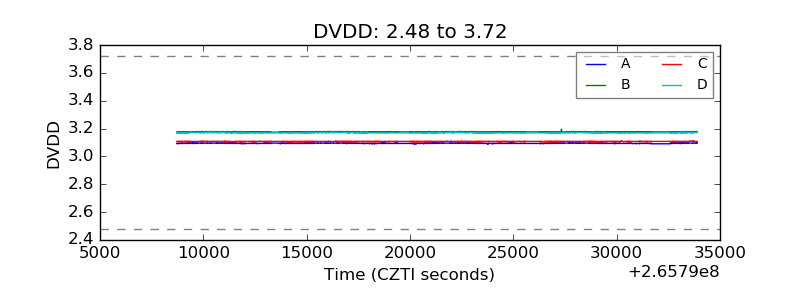 |
| Temperature 1 |  |
| Veto HV Monitor | 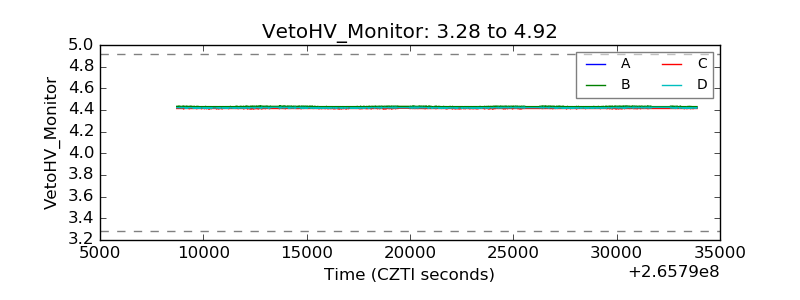 |
| Veto LLD | 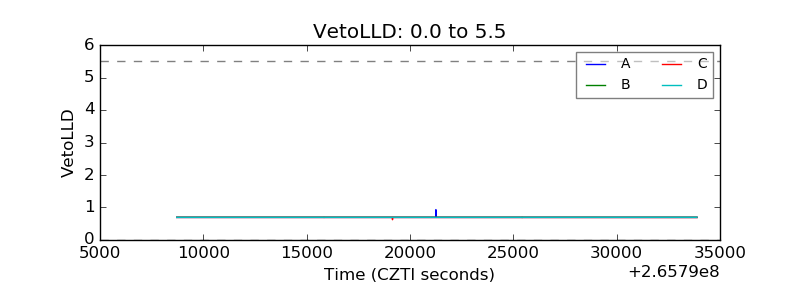 |
| Alpha Counter | 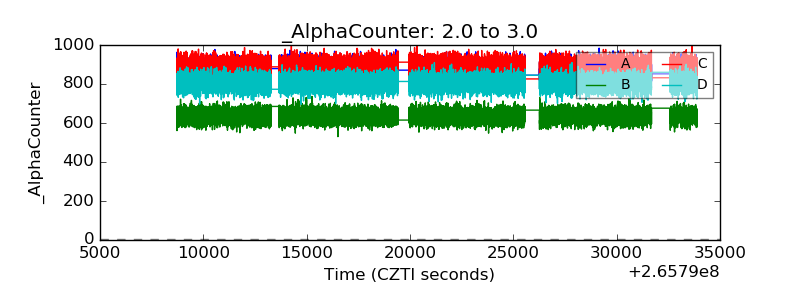 |
| _CPM_Rate | 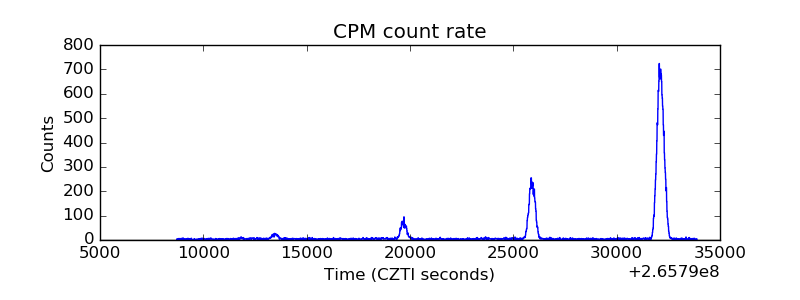 |
| CZT Counter |  |
| +2.5 Volts monitor |  |
| +5 Volts monitor | 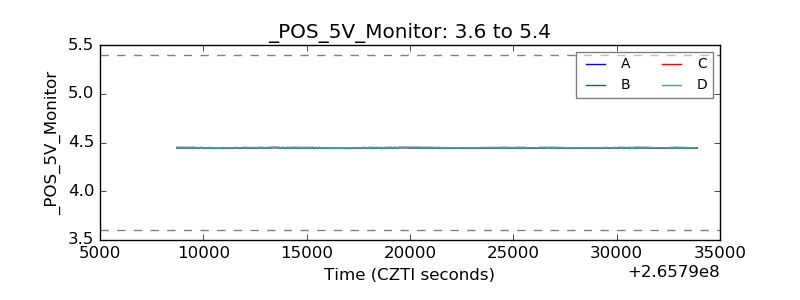 |
| _ROLL_ROT | 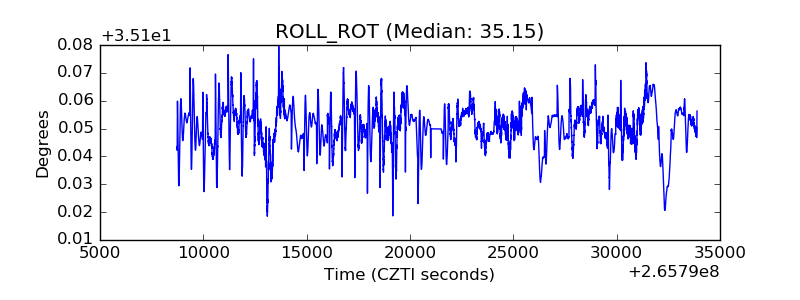 |
| _Roll_DEC | 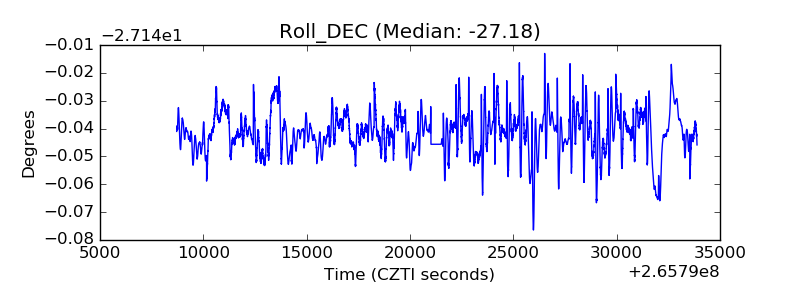 |
| _Roll_RA |  |
| Veto Counter | 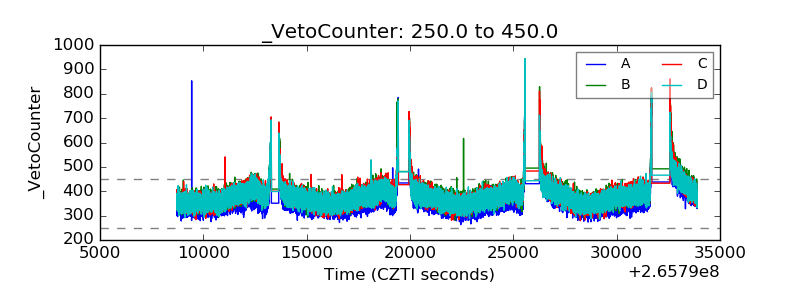 |