| Param | Original file | Final file |
|---|---|---|
| Filename | modeM0/AS1G08_066T01_9000002138_14514cztM0_level2.evt | modeM0/AS1G08_066T01_9000002138_14514cztM0_level2_quad_clean.evt |
| Size (bytes) | 480,528,000 | 66,268,800 |
| Size | 458.3 MB | 63.2 MB |
| Events in quadrant A | 3,425,281 | 399,452 |
| Events in quadrant B | 3,435,984 | 401,696 |
| Events in quadrant C | 3,233,763 | 394,386 |
| Events in quadrant D | 4,033,129 | 373,954 |
| Mode M9 | |||
|---|---|---|---|
| Quadrant | BADHDUFLAG | Total packets | Discarded packets |
| A | 0 | 14 | 0 |
| B | 0 | 14 | 0 |
| C | 0 | 14 | 0 |
| D | 0 | 15 | 0 |
| Mode SS | |||
|---|---|---|---|
| Quadrant | BADHDUFLAG | Total packets | Discarded packets |
| A | 0 | 128 | 0 |
| B | 0 | 128 | 0 |
| C | 0 | 128 | 0 |
| D | 0 | 128 | 0 |
| Mode M0 | |||
|---|---|---|---|
| Quadrant | BADHDUFLAG | Total packets | Discarded packets |
| A | 0 | 14216 | 3 |
| B | 0 | 14325 | 2 |
| C | 0 | 13450 | 2 |
| D | 0 | 16232 | 2 |
| Quadrant | Total seconds | Saturated seconds | Saturation percentage |
|---|---|---|---|
| A | 6255 | 60 | 0.959233% |
| B | 6255 | 75 | 1.199041% |
| C | 6255 | 37 | 0.591527% |
| D | 6255 | 215 | 3.437250% |
Noise dominated data is calculated using 1-second bins in cleaned event files. If a bin has >2000 counts, and if more than 50% of those come from <1% of pixels, then it is considered to be noise-dominated and hence unusable.
| Quadrant | # 1 sec bins | Bins with >0 counts | Bins with >2000 counts | High rate bins dominated by noise | Noise dominated (total time) | Noise dominated (detector-on time) | Marked lightcurve |
|---|---|---|---|---|---|---|---|
| A | 7441 | 6257 | 0 | 0 | 0.00% | 0.00% | 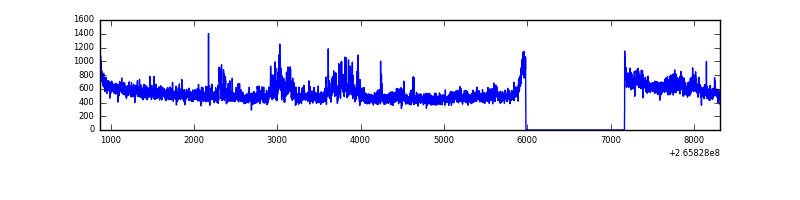 |
| B | 7441 | 6257 | 3 | 3 | 0.04% | 0.05% | 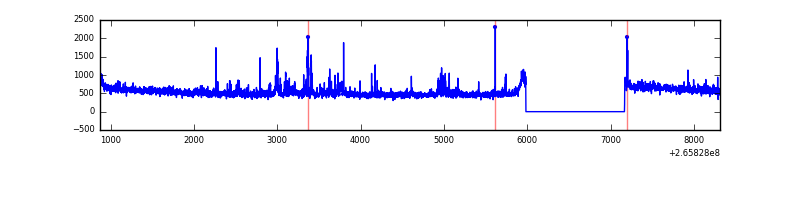 |
| C | 7441 | 6257 | 1 | 1 | 0.01% | 0.02% | 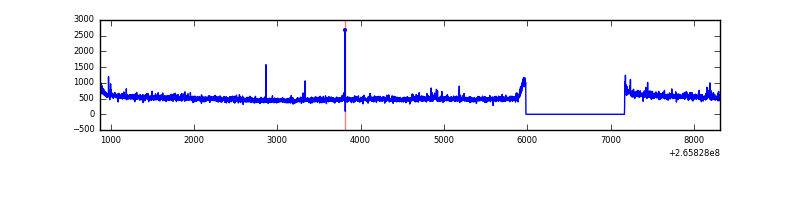 |
| D | 7441 | 6257 | 87 | 87 | 1.17% | 1.39% | 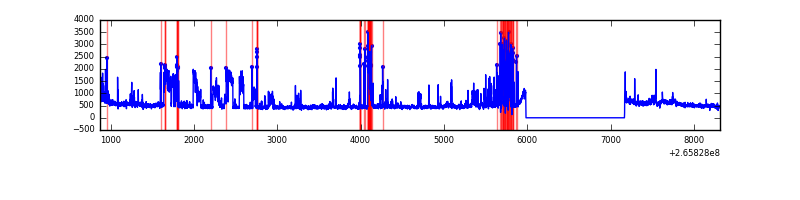 |
Top three noisy pixels from each quadrant. If the there are fewer than three noisy pixels in the level2.evt file, extra rows are filled as -1
| Pixel properties | Quadrant properties | ||||||
|---|---|---|---|---|---|---|---|
| Quadrant | DetID | PixID | Counts | Sigma | Mean | Median | Sigma |
| A | 8 | 15 | 287635 | 1767.82 | 803 | 786 | 162.3 |
| A | 12 | 189 | 28728 | 172.2 | 803 | 786 | 162.3 |
| A | 0 | 226 | 7697 | 42.59 | 803 | 786 | 162.3 |
| B | 3 | 209 | 94842 | 622.61 | 805 | 788 | 151.1 |
| B | 0 | 219 | 68226 | 446.42 | 805 | 788 | 151.1 |
| B | 0 | 189 | 43045 | 279.73 | 805 | 788 | 151.1 |
| C | 3 | 233 | 204905 | 1144.52 | 775 | 779 | 178.3 |
| C | 13 | 61 | 5602 | 27.04 | 775 | 779 | 178.3 |
| C | 14 | 234 | 5100 | 24.23 | 775 | 779 | 178.3 |
| D | 12 | 110 | 555005 | 2989.36 | 764 | 745 | 185.4 |
| D | 10 | 199 | 409072 | 2202.28 | 764 | 745 | 185.4 |
| D | 2 | 120 | 75132 | 401.2 | 764 | 745 | 185.4 |
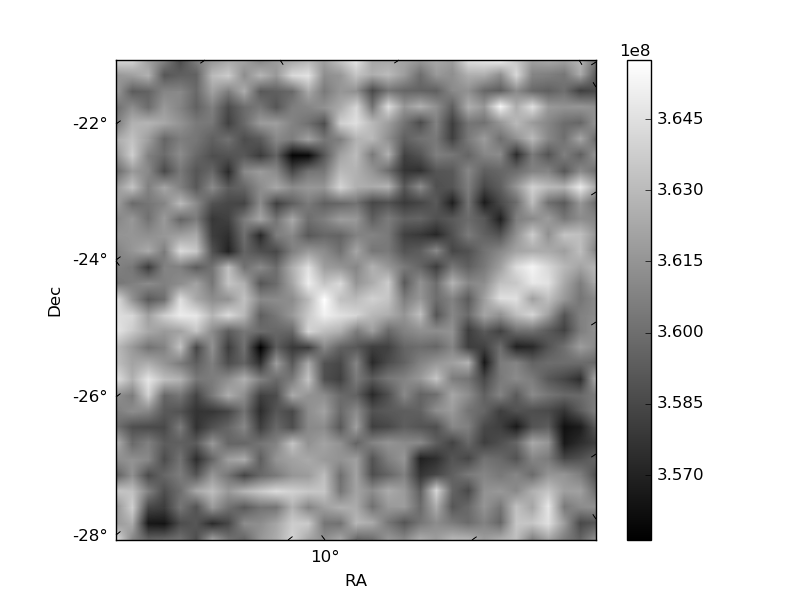
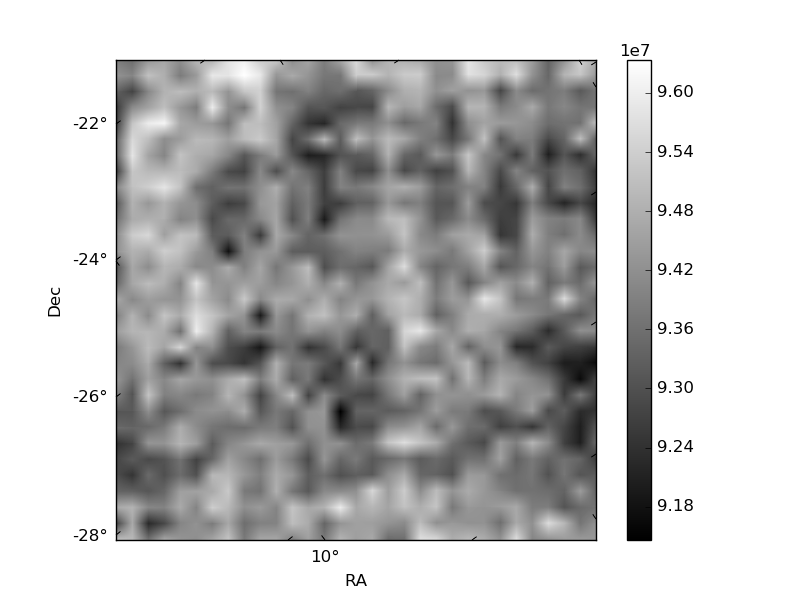
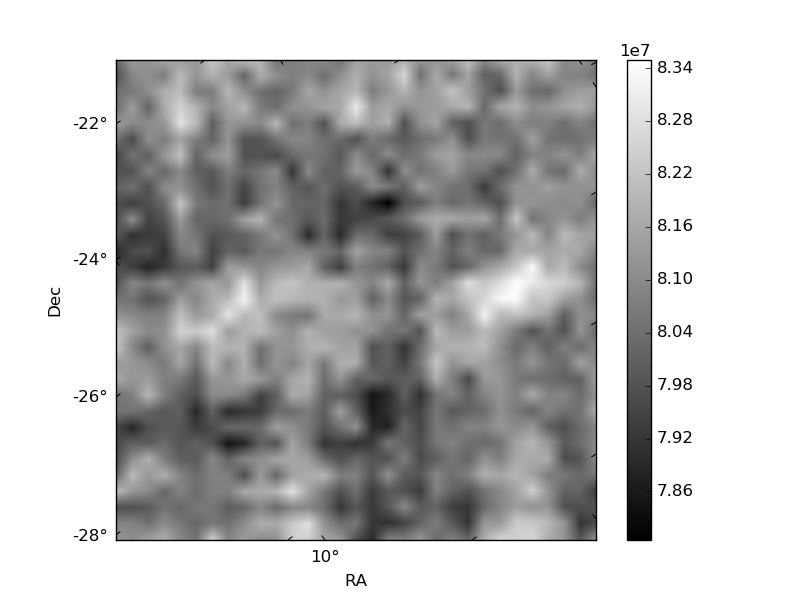
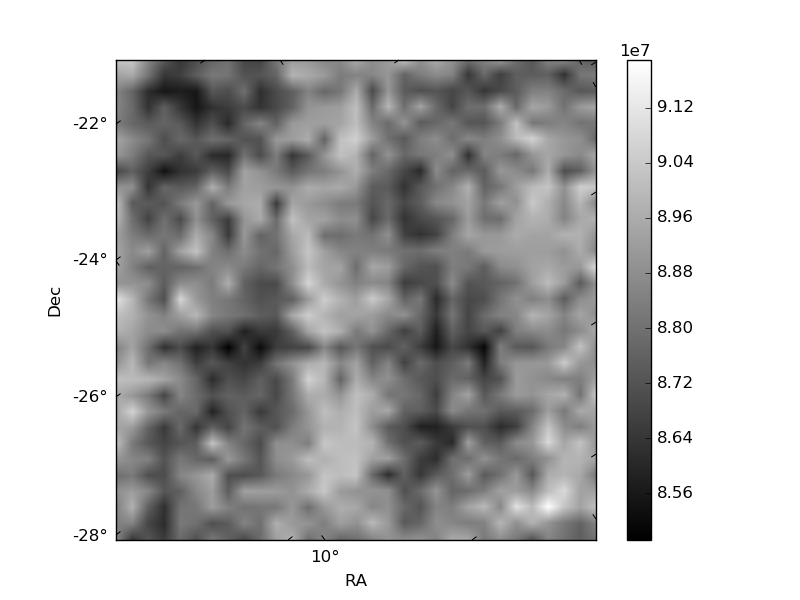
Histogram calculated using DETX and DETY for each event in the final _common_clean file
| Quadrant A | 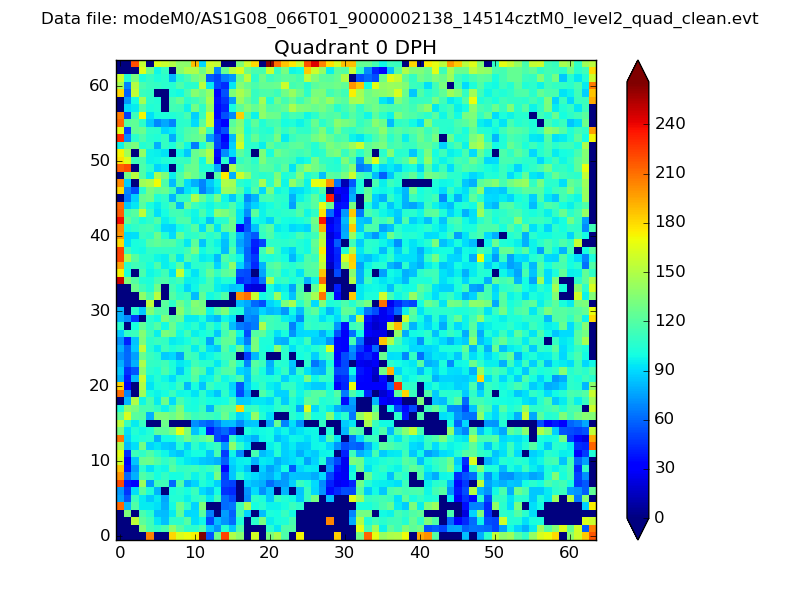 |
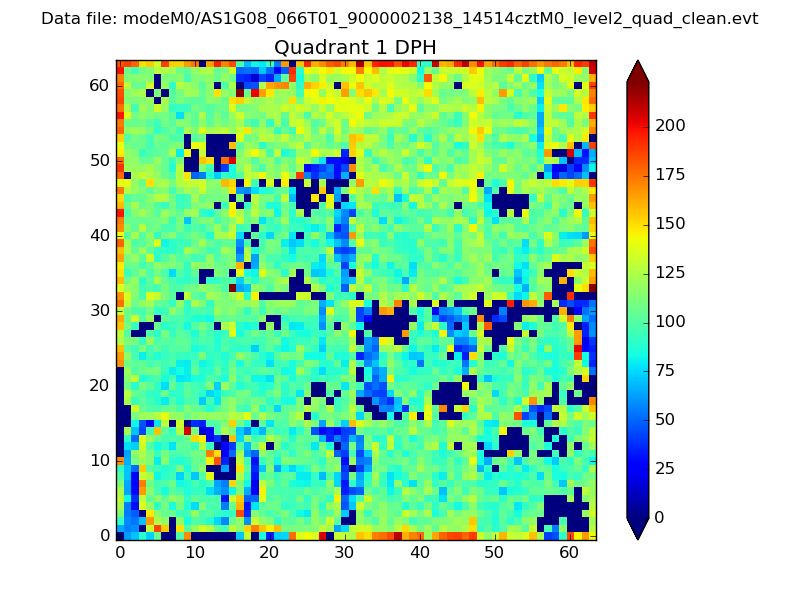 |
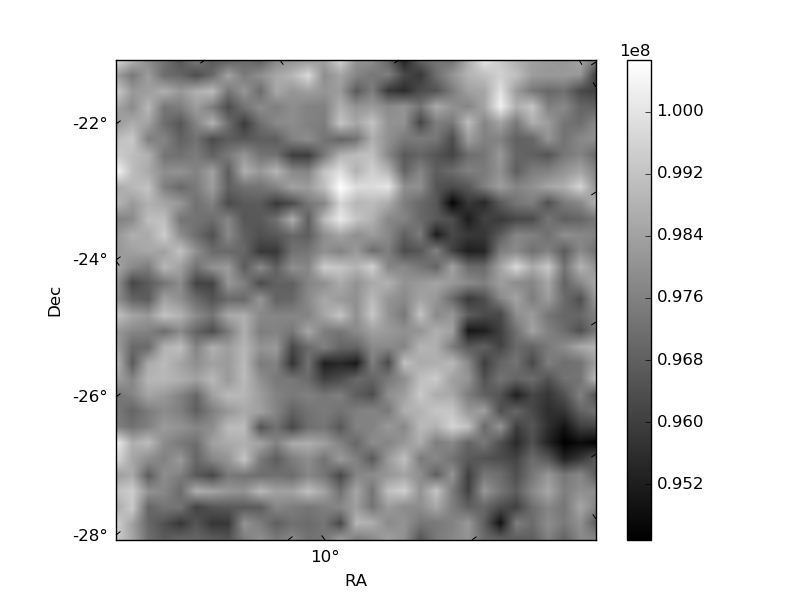
Quadrant B |
|---|---|---|---|
| Quadrant D | 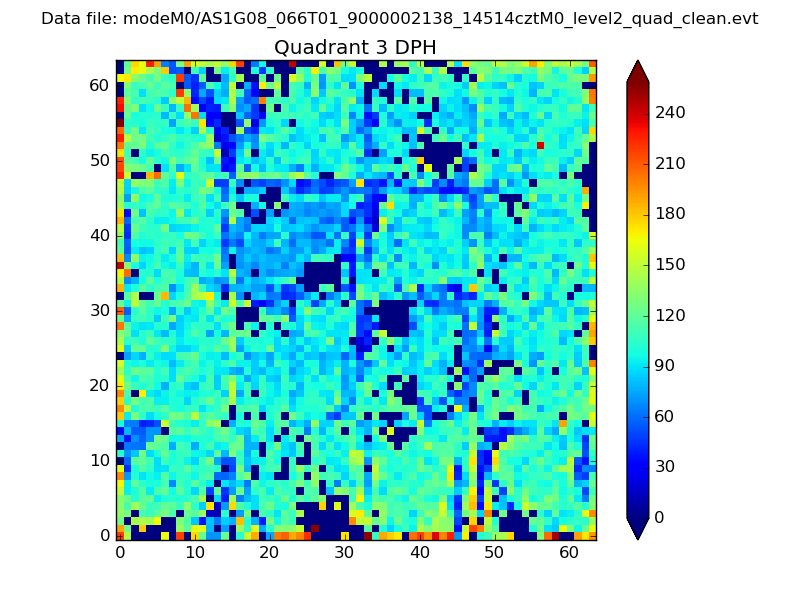 |
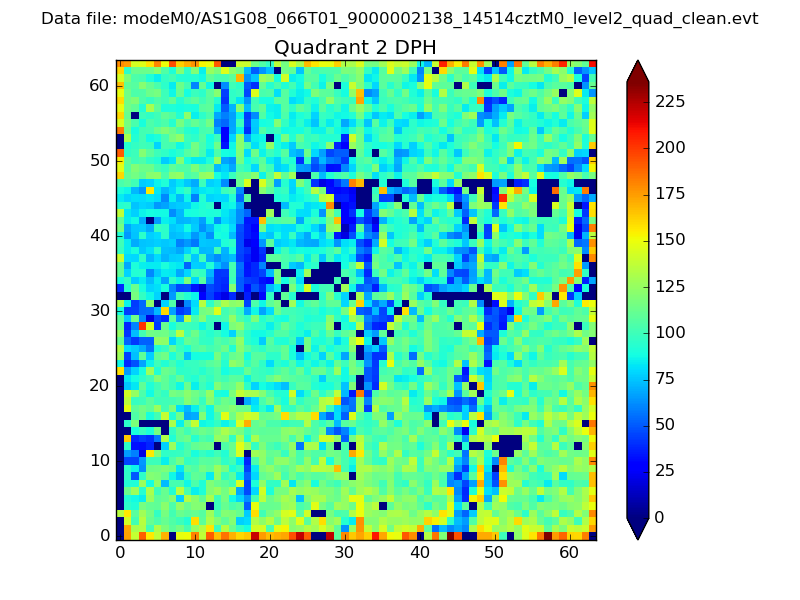 |
Quadrant C |
| Plot type | Count rate plots | Images |
|---|---|---|
| Comparison with Poisson distribution Blue bars denote a histogram of data divided into 1 sec bins. Red curve is a Poisson curve with rate = median count rate of data. |
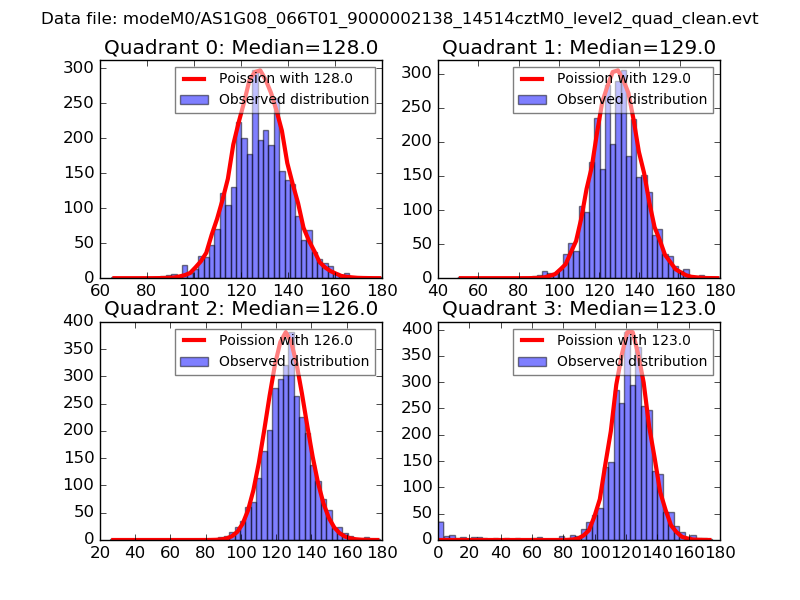 |
 |
| Quadrant-wise count rates Data is divided into 100 sec bins |
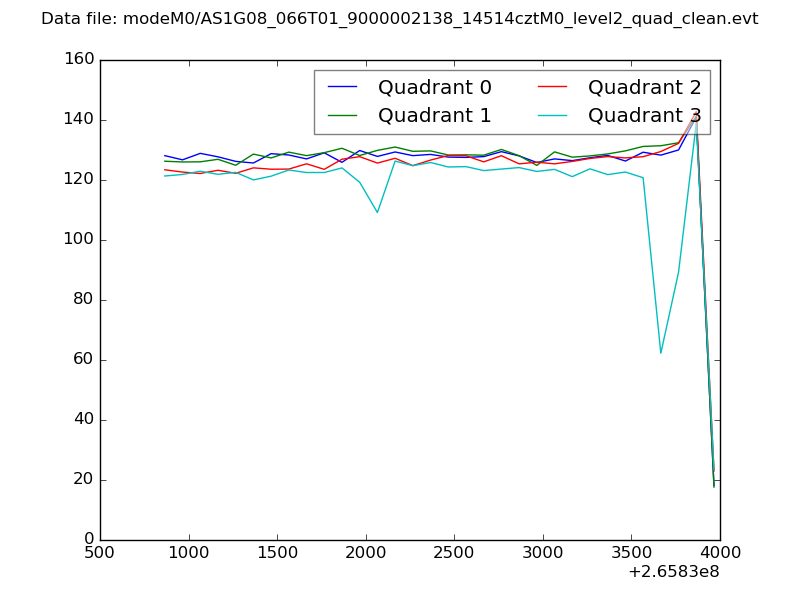 |
|
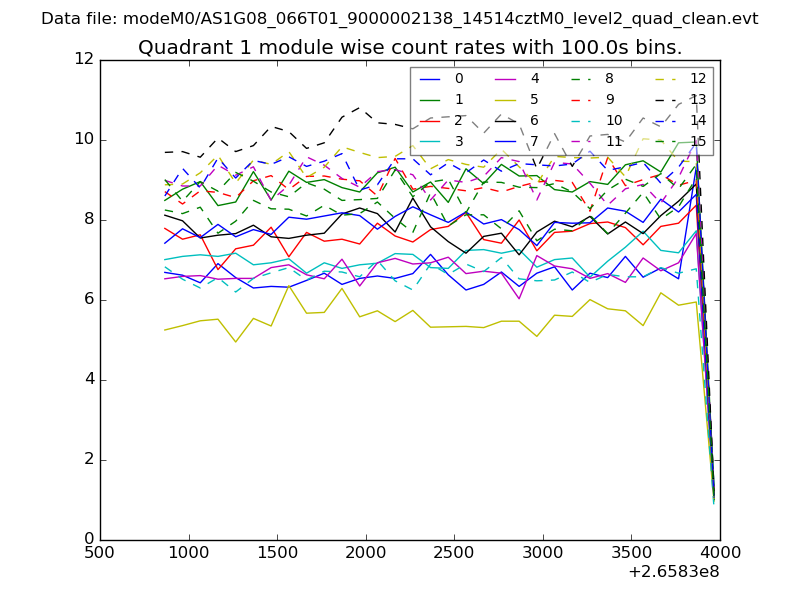
| Module-wise count rates for Quadrant A Data is divided into 100 sec bins |
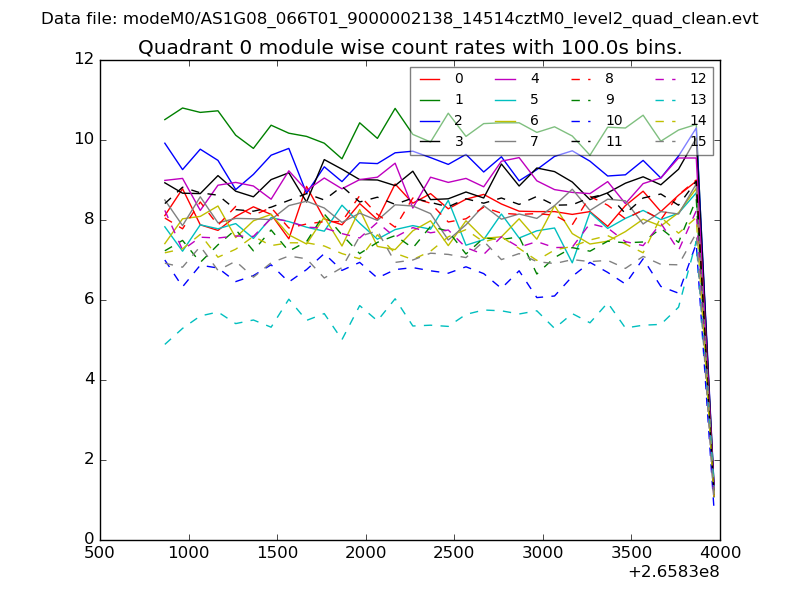 |
 |
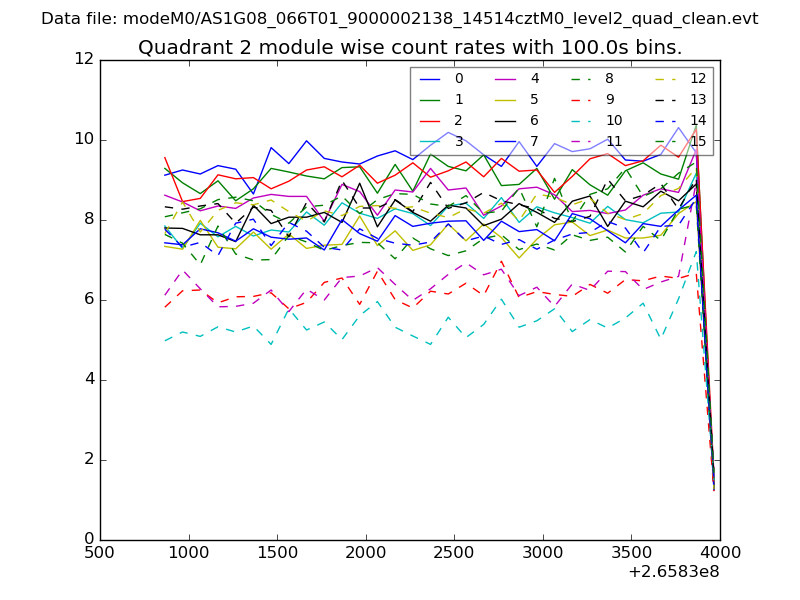
| Module-wise count rates for Quadrant B Data is divided into 100 sec bins |
 |
 |
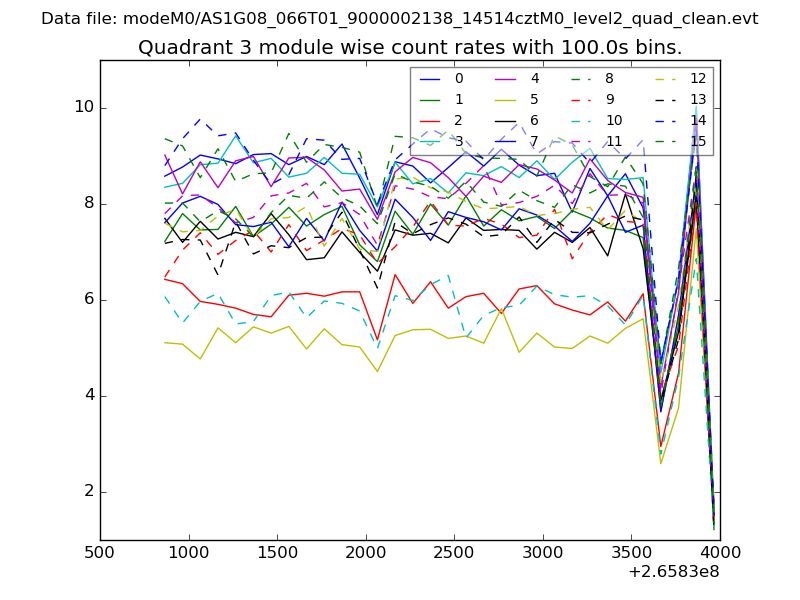
| Module-wise count rates for Quadrant C Data is divided into 100 sec bins |
 |
 |
| Module-wise count rates for Quadrant D Data is divided into 100 sec bins |
 |
 |
| Parameter | Plot |
|---|---|
| CZT HV Monitor | 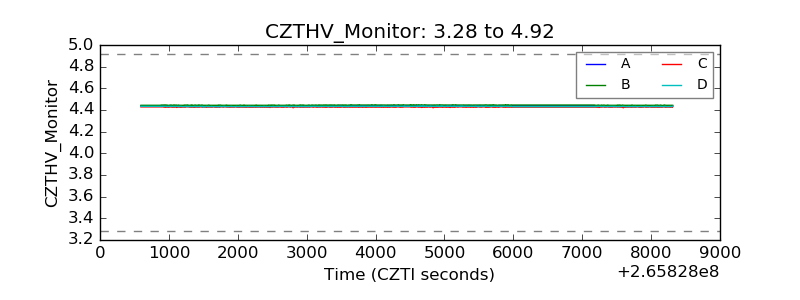 |
| D_VDD |  |
| Temperature 1 | 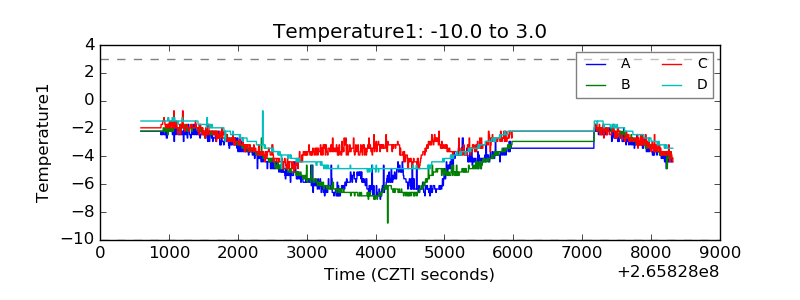 |
| Veto HV Monitor | 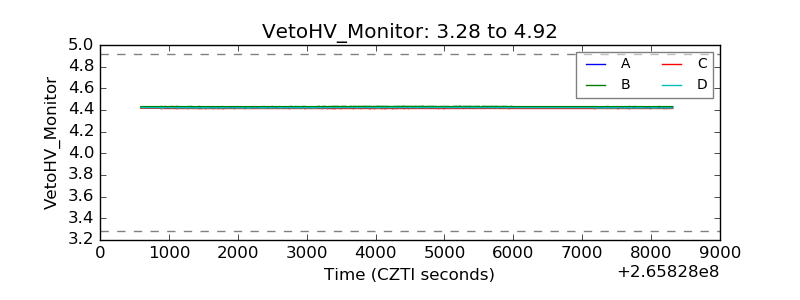 |
| Veto LLD | 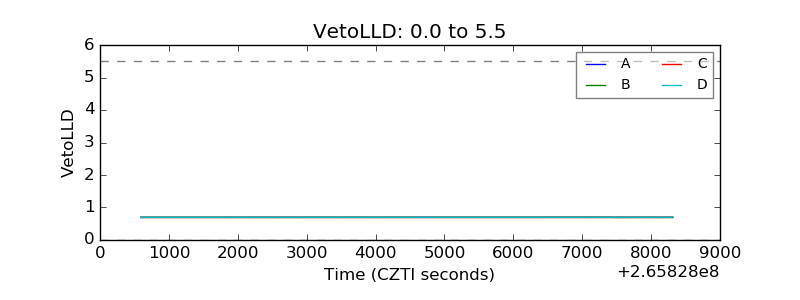 |
| Alpha Counter | 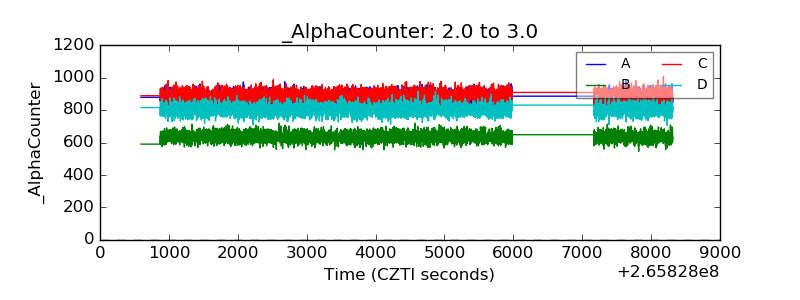 |
| _CPM_Rate | 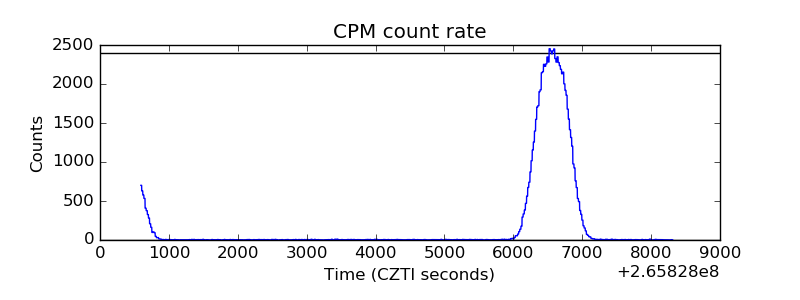 |
| CZT Counter | 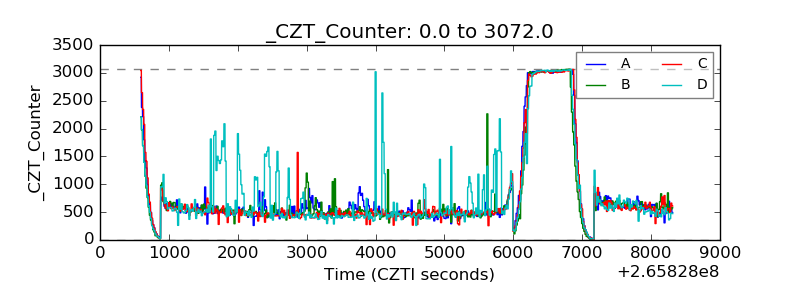 |
| +2.5 Volts monitor |  |
| +5 Volts monitor |  |
| _ROLL_ROT | 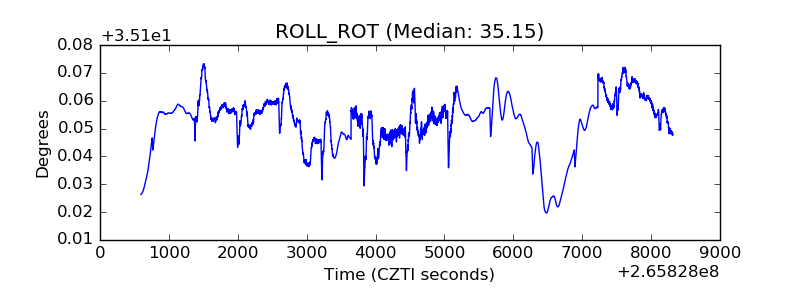 |
| _Roll_DEC | 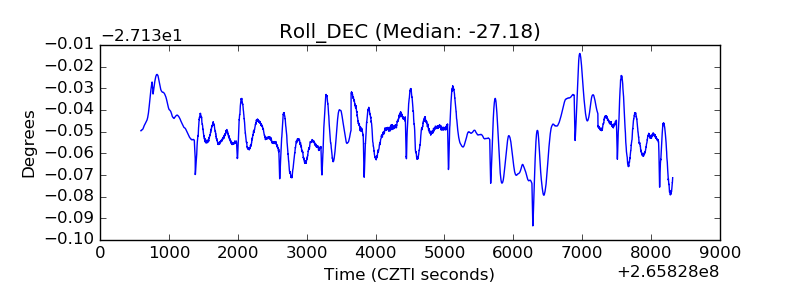 |
| _Roll_RA | 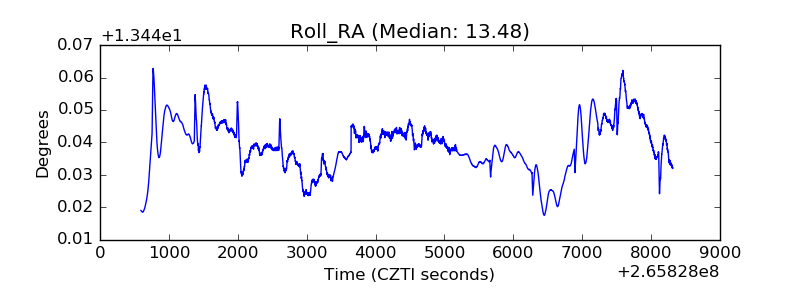 |
| Veto Counter | 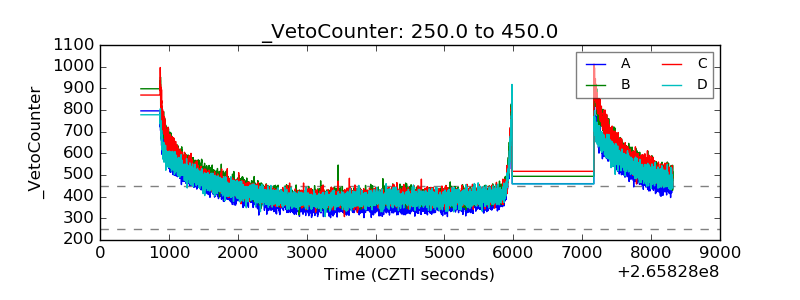 |