| Param | Original file | Final file |
|---|---|---|
| Filename | modeM0/AS1G08_066T01_9000002138_14517cztM0_level2.evt | modeM0/AS1G08_066T01_9000002138_14517cztM0_level2_quad_clean.evt |
| Size (bytes) | 494,573,760 | 90,311,040 |
| Size | 471.7 MB | 86.1 MB |
| Events in quadrant A | 3,566,696 | 587,832 |
| Events in quadrant B | 3,478,983 | 600,082 |
| Events in quadrant C | 3,506,150 | 587,451 |
| Events in quadrant D | 4,006,416 | 527,614 |
| Mode M9 | |||
|---|---|---|---|
| Quadrant | BADHDUFLAG | Total packets | Discarded packets |
| A | 0 | 26 | 0 |
| B | 0 | 26 | 0 |
| C | 0 | 26 | 0 |
| D | 0 | 26 | 0 |
| Mode SS | |||
|---|---|---|---|
| Quadrant | BADHDUFLAG | Total packets | Discarded packets |
| A | 0 | 128 | 0 |
| B | 0 | 128 | 0 |
| C | 0 | 128 | 0 |
| D | 0 | 128 | 0 |
| Mode M0 | |||
|---|---|---|---|
| Quadrant | BADHDUFLAG | Total packets | Discarded packets |
| A | 0 | 14522 | 3 |
| B | 0 | 14383 | 2 |
| C | 0 | 14248 | 2 |
| D | 0 | 15784 | 2 |
| Quadrant | Total seconds | Saturated seconds | Saturation percentage |
|---|---|---|---|
| A | 6185 | 136 | 2.198868% |
| B | 6185 | 135 | 2.182700% |
| C | 6185 | 70 | 1.131770% |
| D | 6185 | 525 | 8.488278% |
Noise dominated data is calculated using 1-second bins in cleaned event files. If a bin has >2000 counts, and if more than 50% of those come from <1% of pixels, then it is considered to be noise-dominated and hence unusable.
| Quadrant | # 1 sec bins | Bins with >0 counts | Bins with >2000 counts | High rate bins dominated by noise | Noise dominated (total time) | Noise dominated (detector-on time) | Marked lightcurve |
|---|---|---|---|---|---|---|---|
| A | 8791 | 6188 | 4 | 4 | 0.05% | 0.06% | 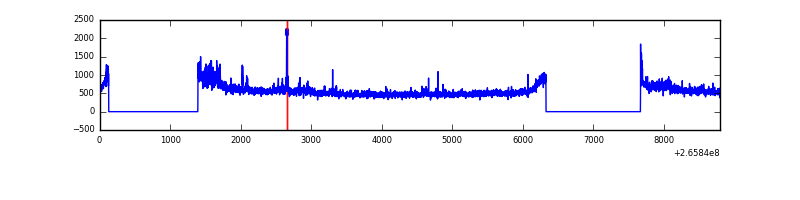 |
| B | 8791 | 6188 | 3 | 3 | 0.03% | 0.05% | 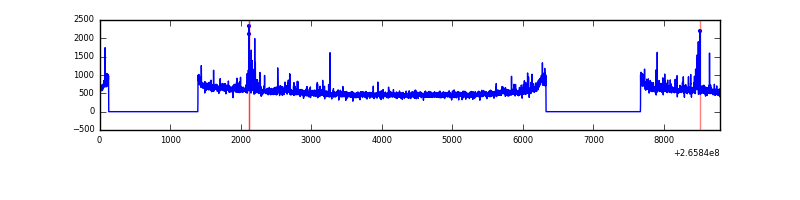 |
| C | 8791 | 6188 | 0 | 0 | 0.00% | 0.00% | 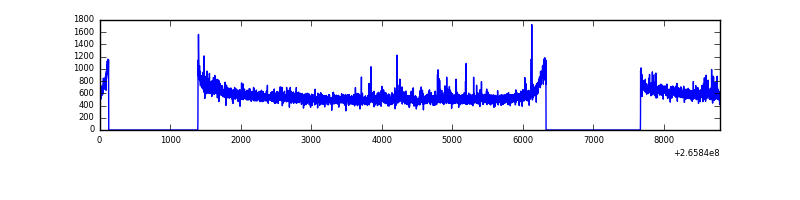 |
| D | 8791 | 6188 | 219 | 219 | 2.49% | 3.54% | 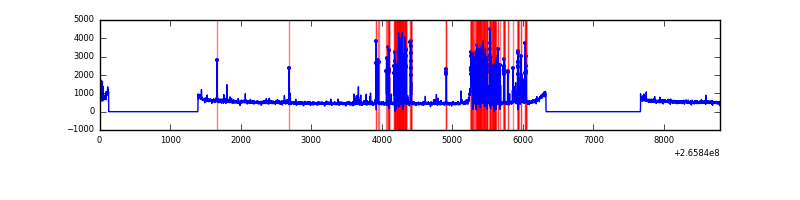 |
Top three noisy pixels from each quadrant. If the there are fewer than three noisy pixels in the level2.evt file, extra rows are filled as -1
| Pixel properties | Quadrant properties | ||||||
|---|---|---|---|---|---|---|---|
| Quadrant | DetID | PixID | Counts | Sigma | Mean | Median | Sigma |
| A | 8 | 15 | 297137 | 1758.46 | 840 | 823 | 168.5 |
| A | 12 | 189 | 37023 | 214.82 | 840 | 823 | 168.5 |
| A | 0 | 226 | 7474 | 39.47 | 840 | 823 | 168.5 |
| B | 0 | 189 | 61789 | 390.04 | 843 | 825 | 156.3 |
| B | 4 | 142 | 35412 | 221.28 | 843 | 825 | 156.3 |
| B | 0 | 197 | 22375 | 137.87 | 843 | 825 | 156.3 |
| C | 3 | 233 | 269688 | 1419.26 | 826 | 833 | 189.4 |
| C | 10 | 22 | 6408 | 29.43 | 826 | 833 | 189.4 |
| C | 13 | 61 | 5923 | 26.87 | 826 | 833 | 189.4 |
| D | 10 | 199 | 906406 | 4570.09 | 783 | 764 | 198.2 |
| D | 12 | 110 | 75580 | 377.54 | 783 | 764 | 198.2 |
| D | 10 | 70 | 27236 | 133.58 | 783 | 764 | 198.2 |
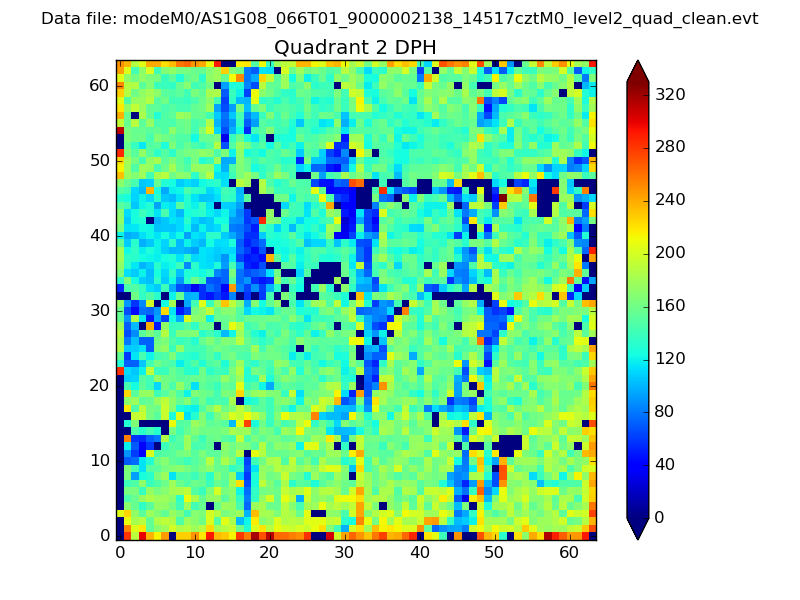
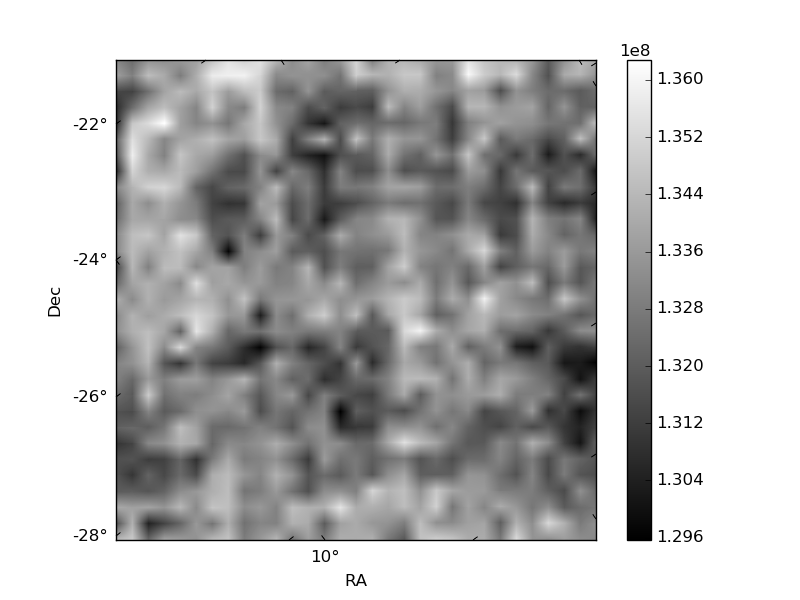
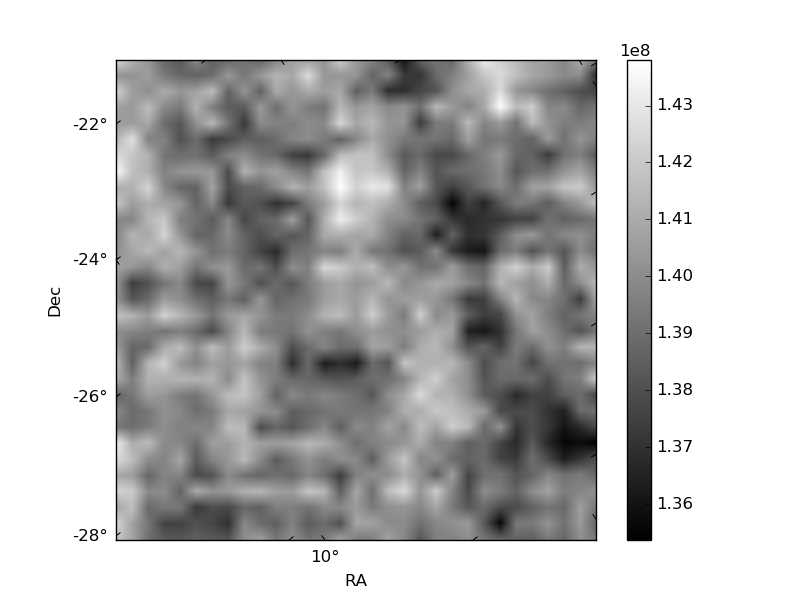
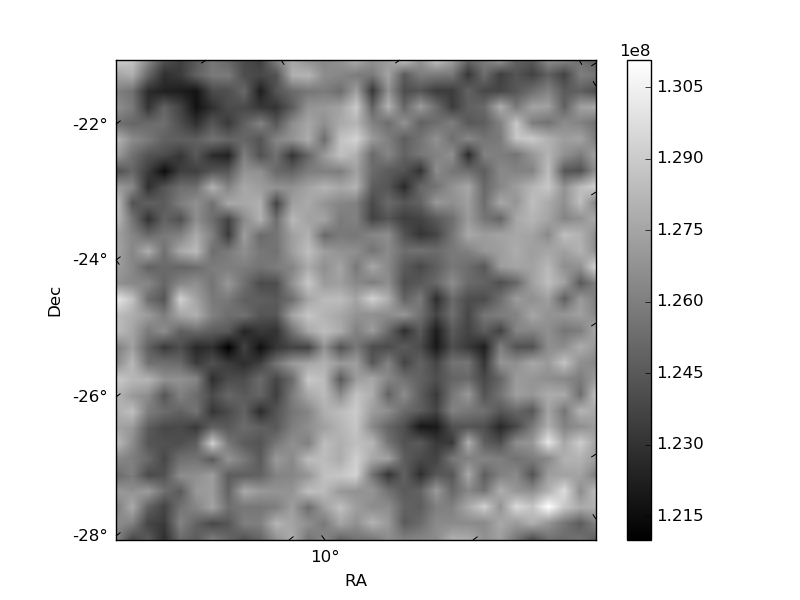
Histogram calculated using DETX and DETY for each event in the final _common_clean file
| Quadrant A | 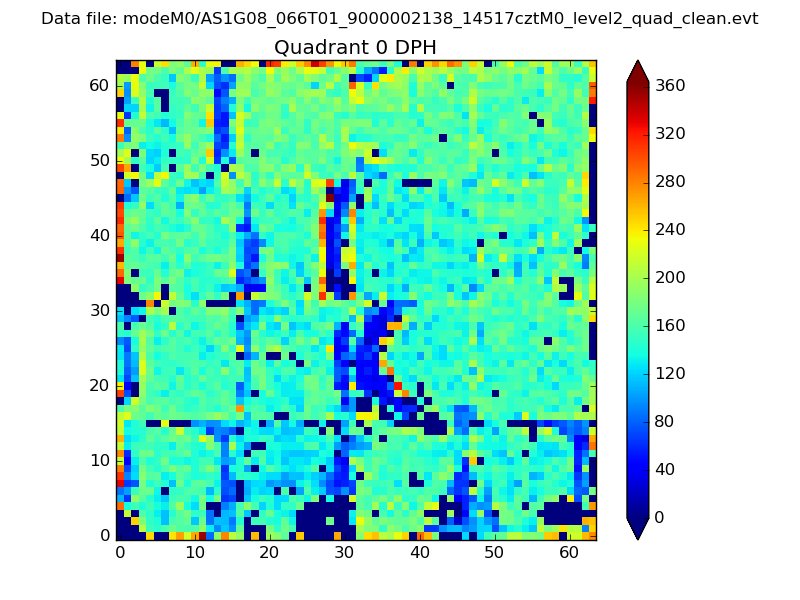 |
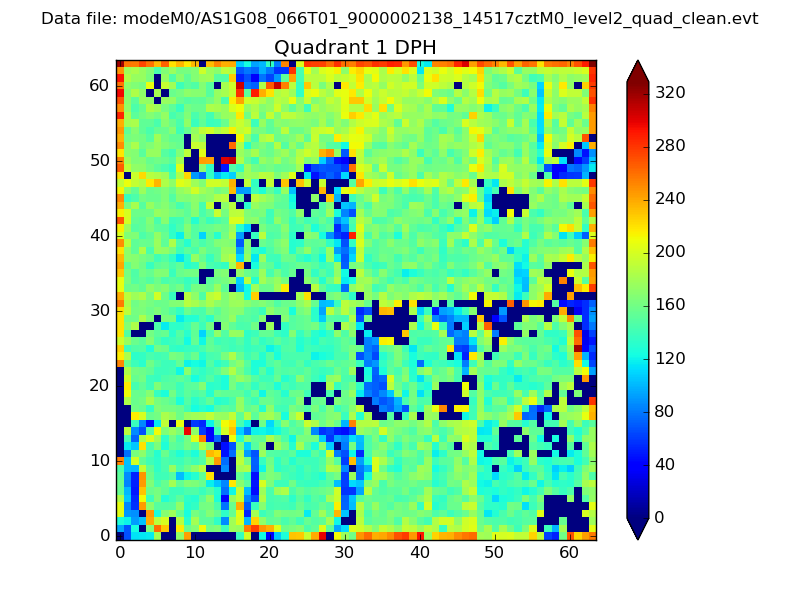 |
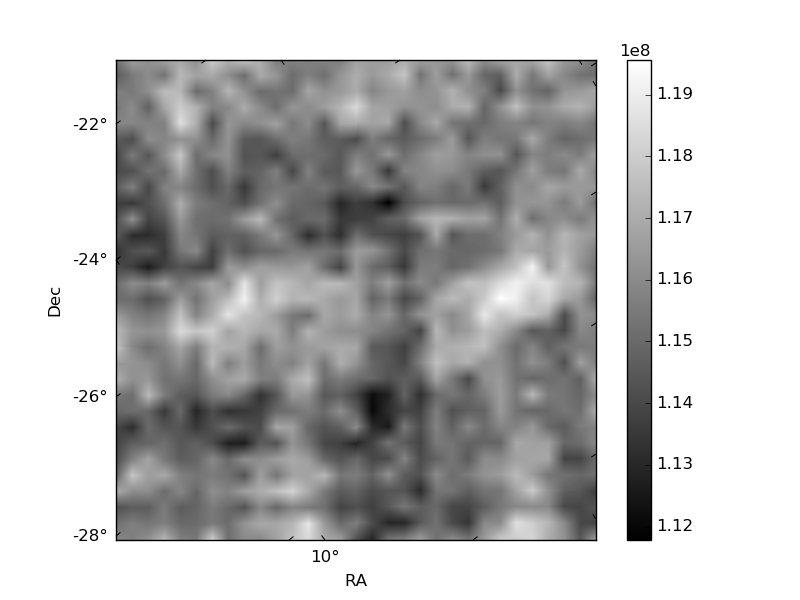
Quadrant B |
|---|---|---|---|
| Quadrant D | 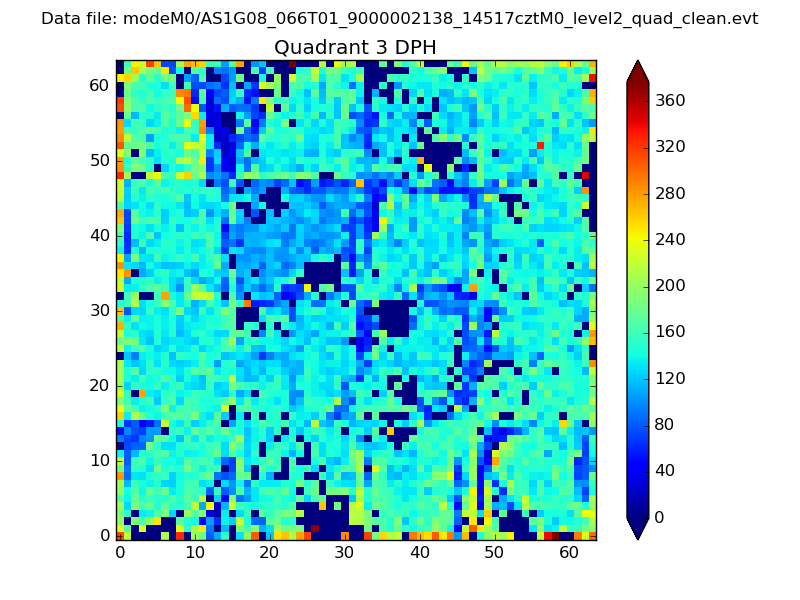 |
 |
Quadrant C |
| Plot type | Count rate plots | Images |
|---|---|---|
| Comparison with Poisson distribution Blue bars denote a histogram of data divided into 1 sec bins. Red curve is a Poisson curve with rate = median count rate of data. |
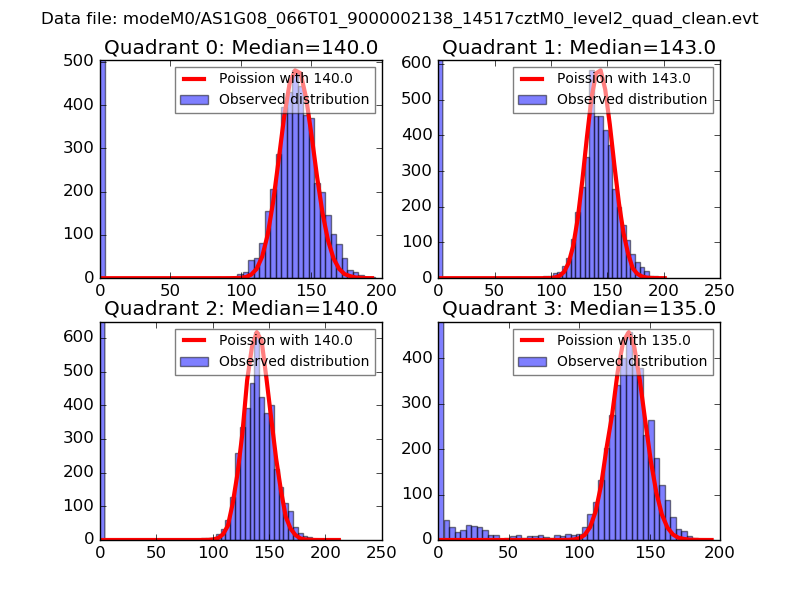 |
 |
| Quadrant-wise count rates Data is divided into 100 sec bins |
 |
|
| Module-wise count rates for Quadrant A Data is divided into 100 sec bins |
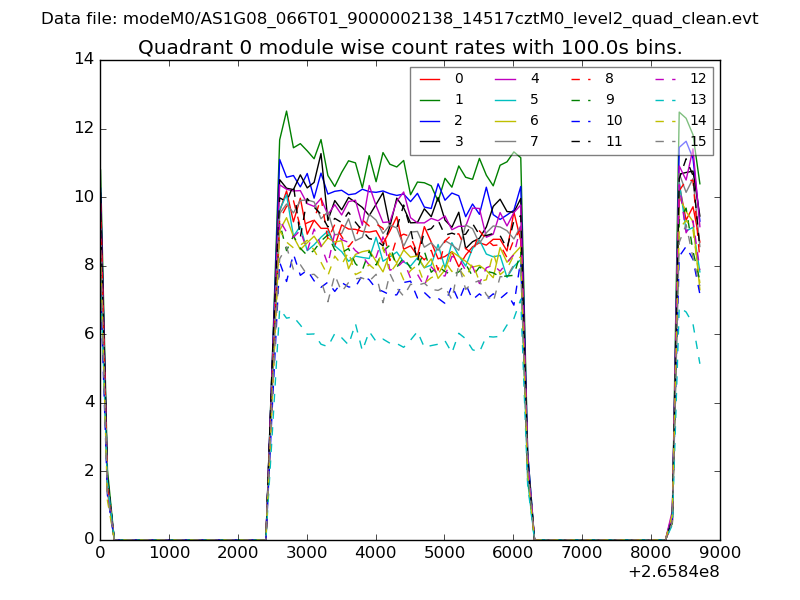 |
 |
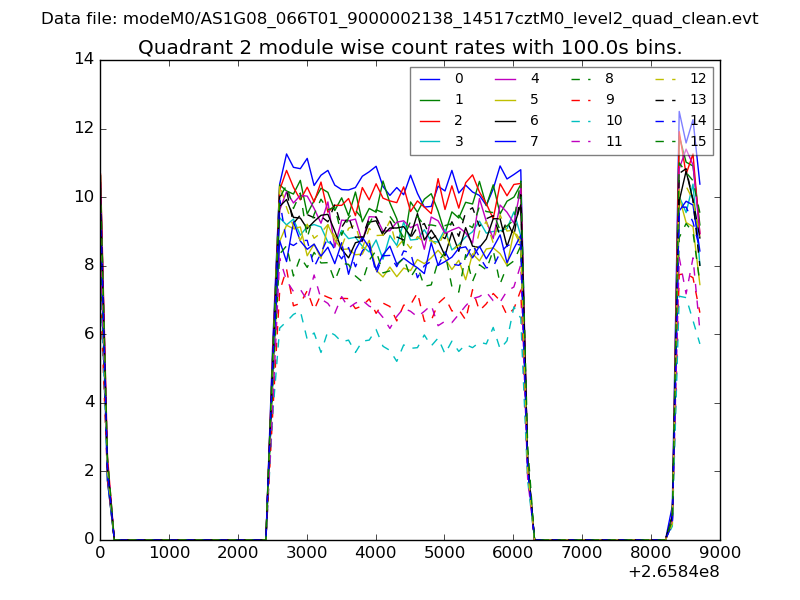
| Module-wise count rates for Quadrant B Data is divided into 100 sec bins |
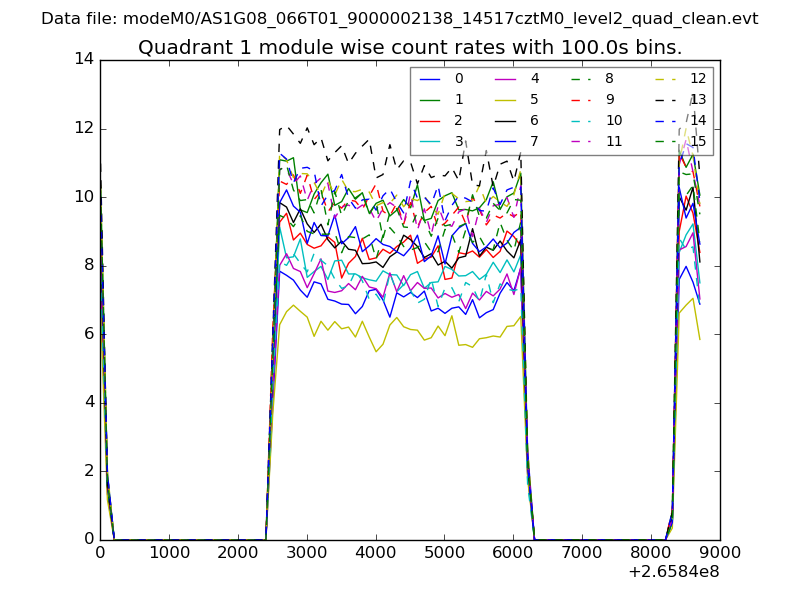 |
 |
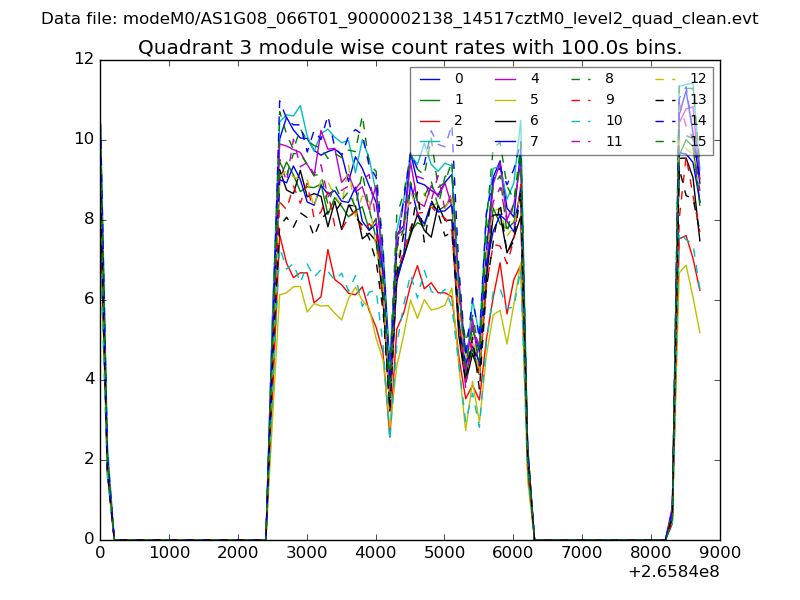
| Module-wise count rates for Quadrant C Data is divided into 100 sec bins |
 |
 |
| Module-wise count rates for Quadrant D Data is divided into 100 sec bins |
 |
 |
| Parameter | Plot |
|---|---|
| CZT HV Monitor | 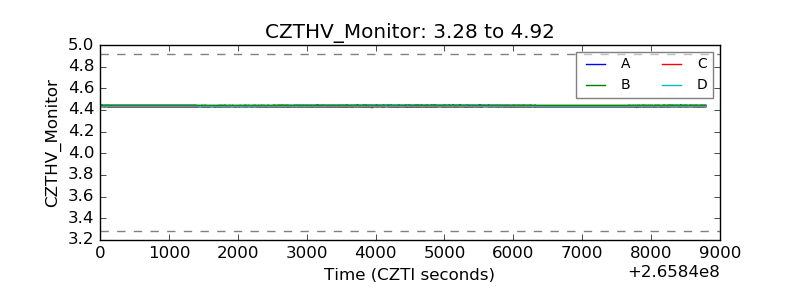 |
| D_VDD | 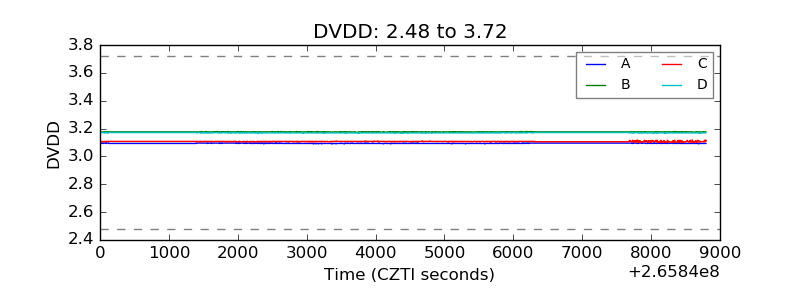 |
| Temperature 1 | 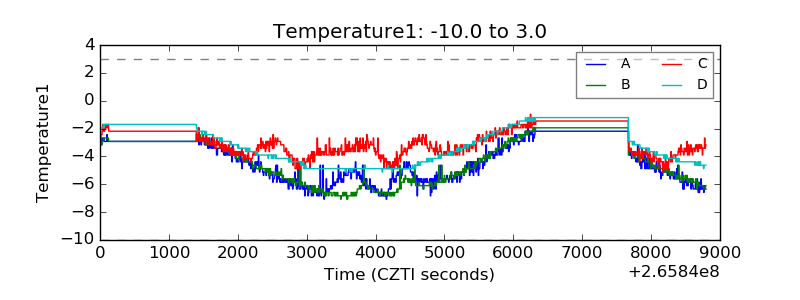 |
| Veto HV Monitor |  |
| Veto LLD | 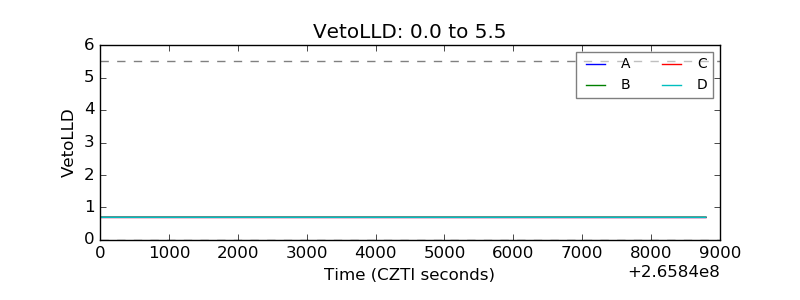 |
| Alpha Counter | 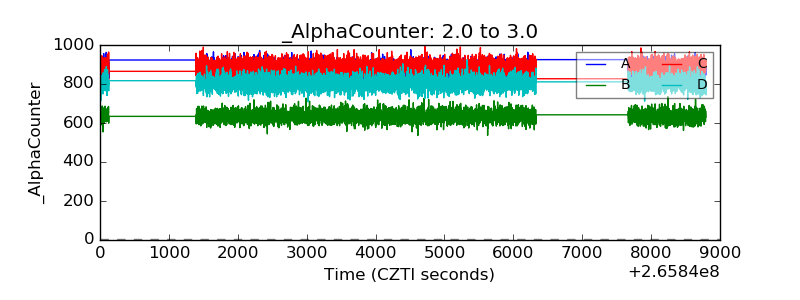 |
| _CPM_Rate | 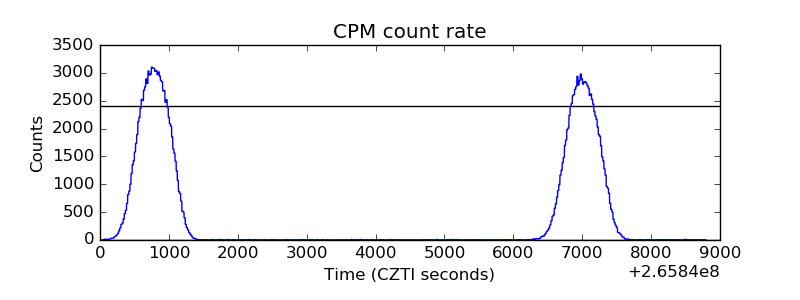 |
| CZT Counter |  |
| +2.5 Volts monitor |  |
| +5 Volts monitor |  |
| _ROLL_ROT | 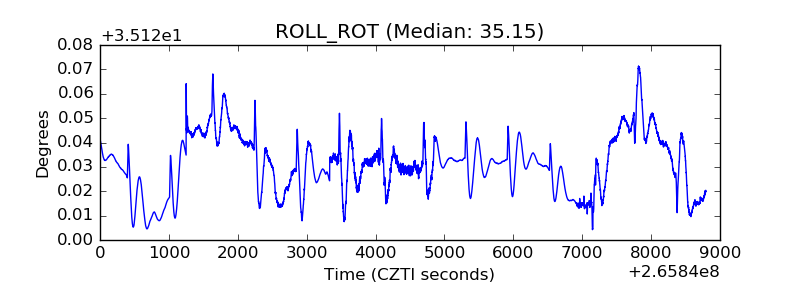 |
| _Roll_DEC |  |
| _Roll_RA |  |
| Veto Counter | 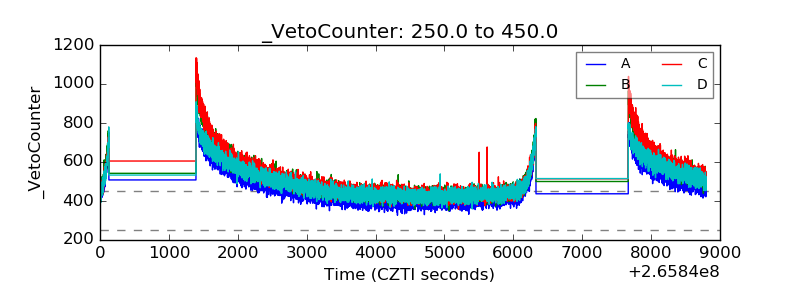 |