| Param | Original file | Final file |
|---|---|---|
| Filename | modeM0/AS1G08_066T01_9000002138_14521cztM0_level2.evt | modeM0/AS1G08_066T01_9000002138_14521cztM0_level2_quad_clean.evt |
| Size (bytes) | 457,502,400 | 88,902,720 |
| Size | 436.3 MB | 84.8 MB |
| Events in quadrant A | 3,254,530 | 557,864 |
| Events in quadrant B | 3,346,106 | 566,742 |
| Events in quadrant C | 3,356,070 | 560,708 |
| Events in quadrant D | 3,445,386 | 541,840 |
| Mode M9 | |||
|---|---|---|---|
| Quadrant | BADHDUFLAG | Total packets | Discarded packets |
| A | 0 | 5 | 0 |
| B | 0 | 5 | 0 |
| C | 0 | 5 | 0 |
| D | 0 | 5 | 0 |
| Mode SS | |||
|---|---|---|---|
| Quadrant | BADHDUFLAG | Total packets | Discarded packets |
| A | 0 | 136 | 0 |
| B | 0 | 136 | 0 |
| C | 0 | 136 | 0 |
| D | 0 | 136 | 0 |
| Mode M0 | |||
|---|---|---|---|
| Quadrant | BADHDUFLAG | Total packets | Discarded packets |
| A | 0 | 13972 | 2 |
| B | 0 | 14375 | 1 |
| C | 0 | 13940 | 1 |
| D | 0 | 14908 | 1 |
| Quadrant | Total seconds | Saturated seconds | Saturation percentage |
|---|---|---|---|
| A | 6675 | 91 | 1.363296% |
| B | 6675 | 137 | 2.052434% |
| C | 6675 | 98 | 1.468165% |
| D | 6675 | 162 | 2.426966% |
Noise dominated data is calculated using 1-second bins in cleaned event files. If a bin has >2000 counts, and if more than 50% of those come from <1% of pixels, then it is considered to be noise-dominated and hence unusable.
| Quadrant | # 1 sec bins | Bins with >0 counts | Bins with >2000 counts | High rate bins dominated by noise | Noise dominated (total time) | Noise dominated (detector-on time) | Marked lightcurve |
|---|---|---|---|---|---|---|---|
| A | 7106 | 6678 | 0 | 0 | 0.00% | 0.00% | 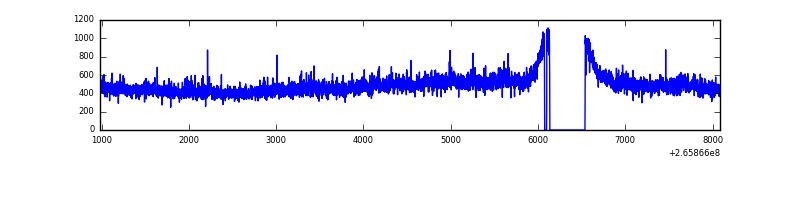 |
| B | 7106 | 6678 | 5 | 5 | 0.07% | 0.07% | 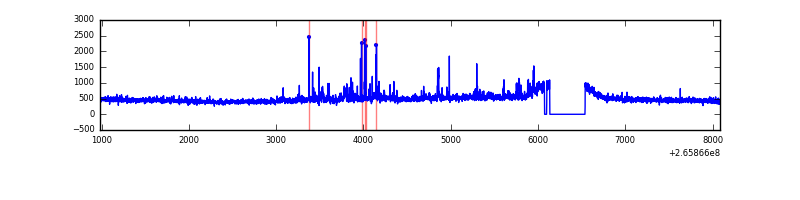 |
| C | 7106 | 6678 | 0 | 0 | 0.00% | 0.00% | 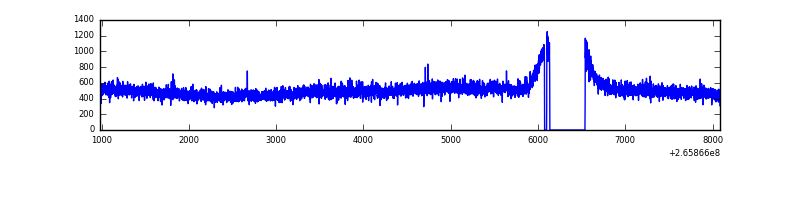 |
| D | 7106 | 6678 | 81 | 81 | 1.14% | 1.21% | 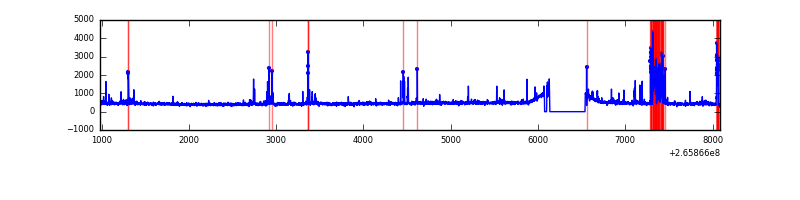 |
Top three noisy pixels from each quadrant. If the there are fewer than three noisy pixels in the level2.evt file, extra rows are filled as -1
| Pixel properties | Quadrant properties | ||||||
|---|---|---|---|---|---|---|---|
| Quadrant | DetID | PixID | Counts | Sigma | Mean | Median | Sigma |
| A | 8 | 15 | 113170 | 680.57 | 805 | 784 | 165.1 |
| A | 12 | 189 | 39438 | 234.07 | 805 | 784 | 165.1 |
| A | 0 | 226 | 7018 | 37.75 | 805 | 784 | 165.1 |
| B | 0 | 219 | 120749 | 772.7 | 803 | 783 | 155.3 |
| B | 0 | 189 | 54997 | 349.19 | 803 | 783 | 155.3 |
| B | 12 | 111 | 18260 | 112.57 | 803 | 783 | 155.3 |
| C | 3 | 233 | 265765 | 1434.46 | 792 | 797 | 184.7 |
| C | 13 | 61 | 5662 | 26.34 | 792 | 797 | 184.7 |
| C | 3 | 202 | 1855 | 5.73 | 792 | 797 | 184.7 |
| D | 10 | 199 | 354921 | 1834.49 | 788 | 768 | 193.1 |
| D | 12 | 110 | 39035 | 198.22 | 788 | 768 | 193.1 |
| D | 2 | 120 | 33014 | 167.03 | 788 | 768 | 193.1 |
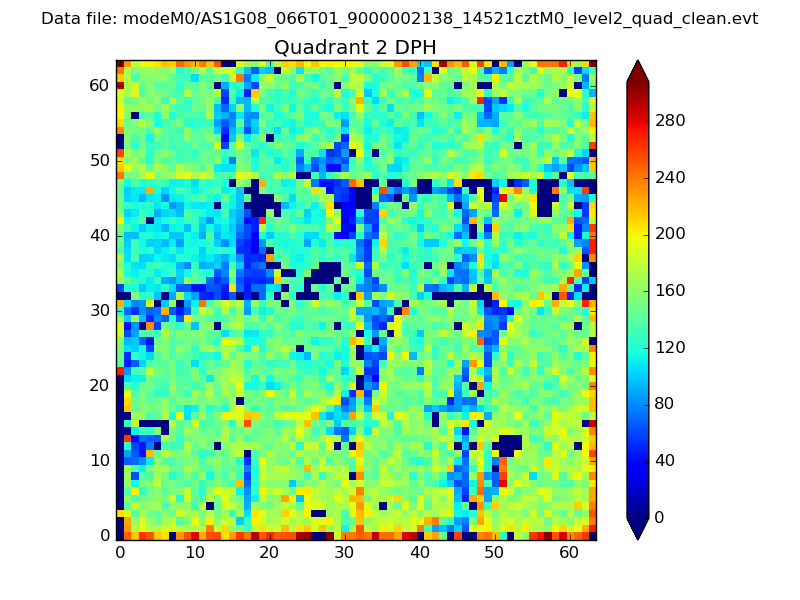
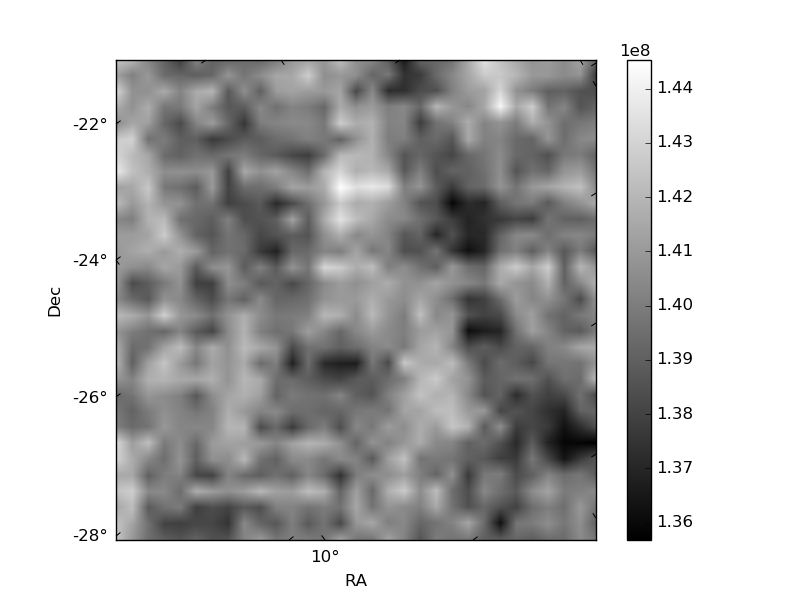
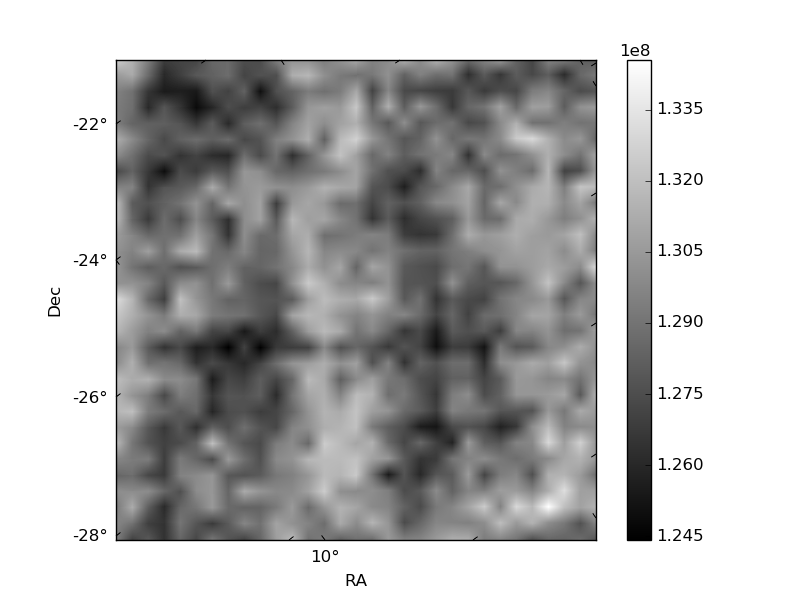
Histogram calculated using DETX and DETY for each event in the final _common_clean file
| Quadrant A | 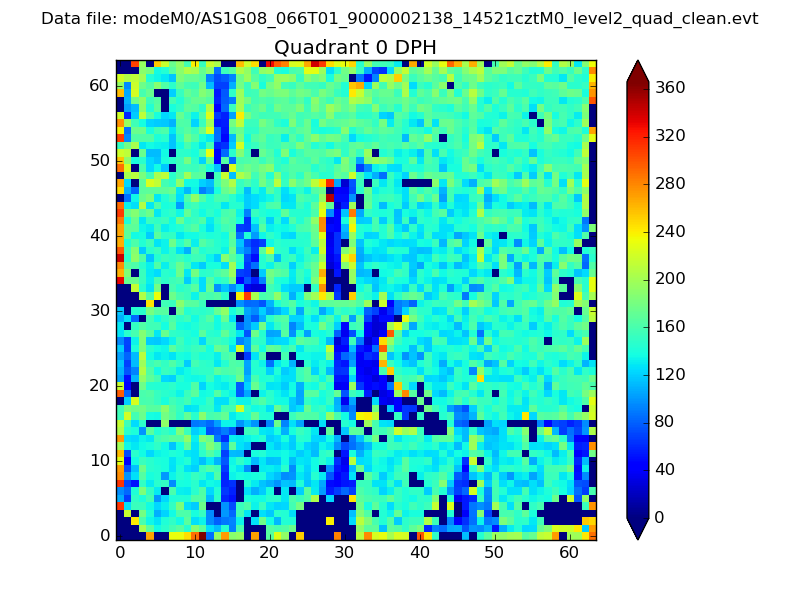 |
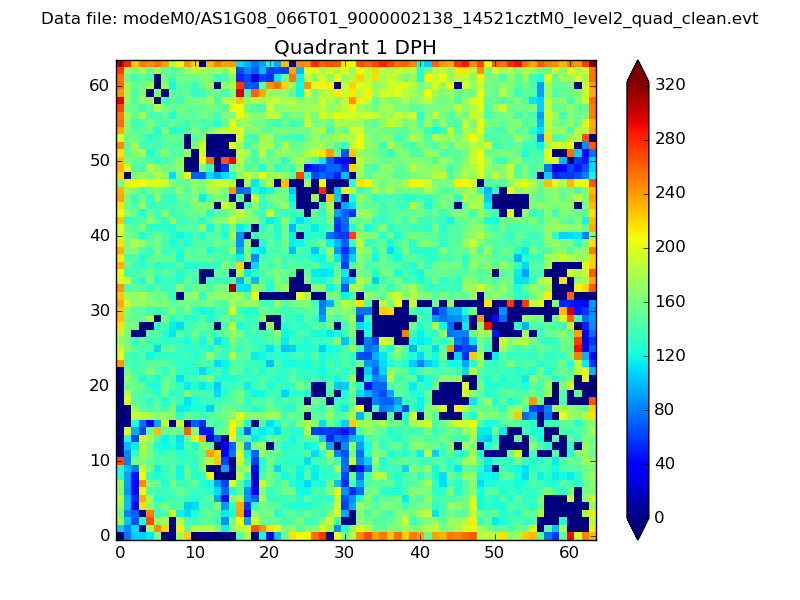 |
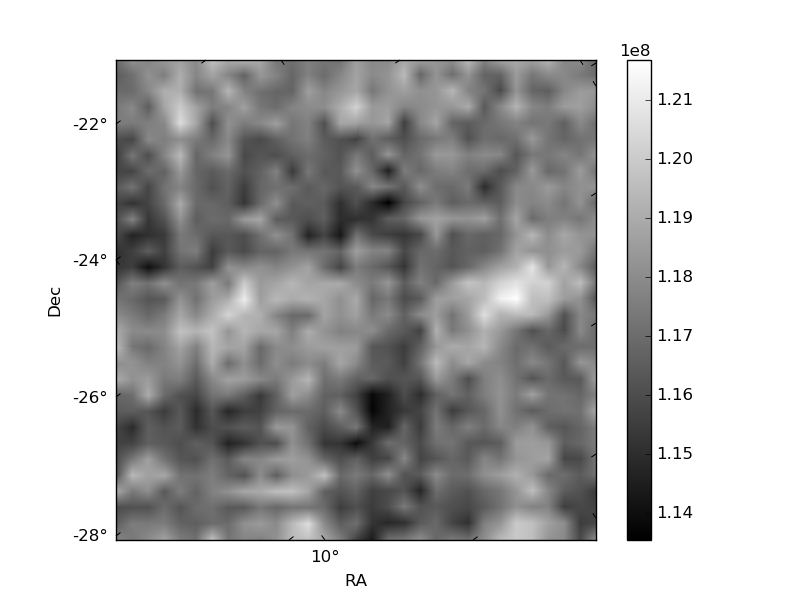
Quadrant B |
|---|---|---|---|
| Quadrant D | 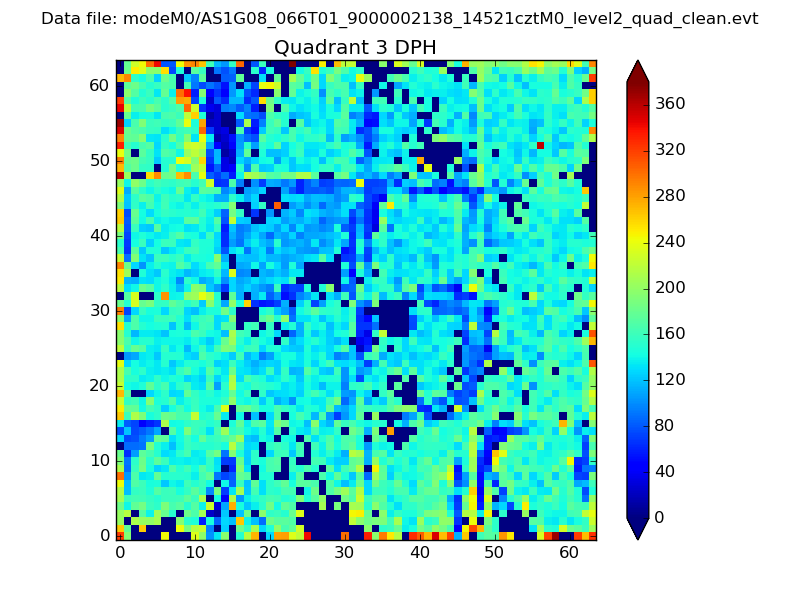 |
 |
Quadrant C |
| Plot type | Count rate plots | Images |
|---|---|---|
| Comparison with Poisson distribution Blue bars denote a histogram of data divided into 1 sec bins. Red curve is a Poisson curve with rate = median count rate of data. |
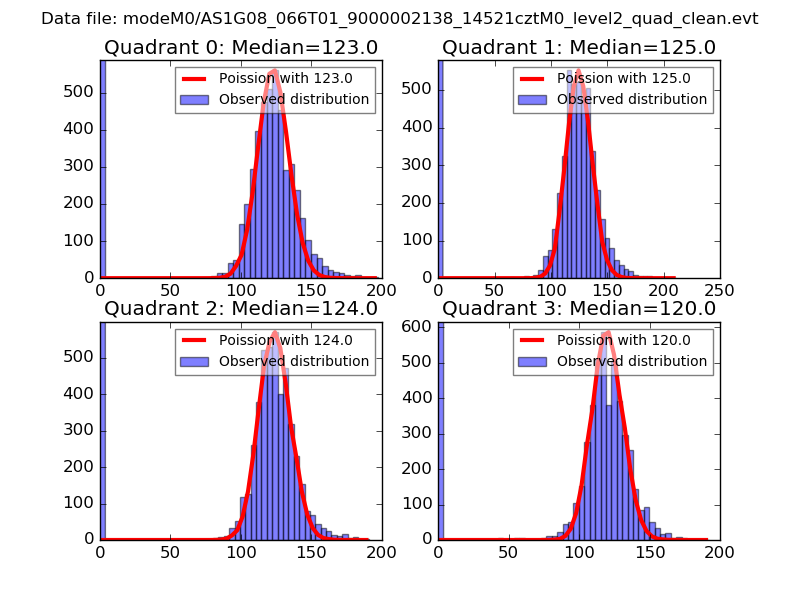 |
 |
| Quadrant-wise count rates Data is divided into 100 sec bins |
 |
|
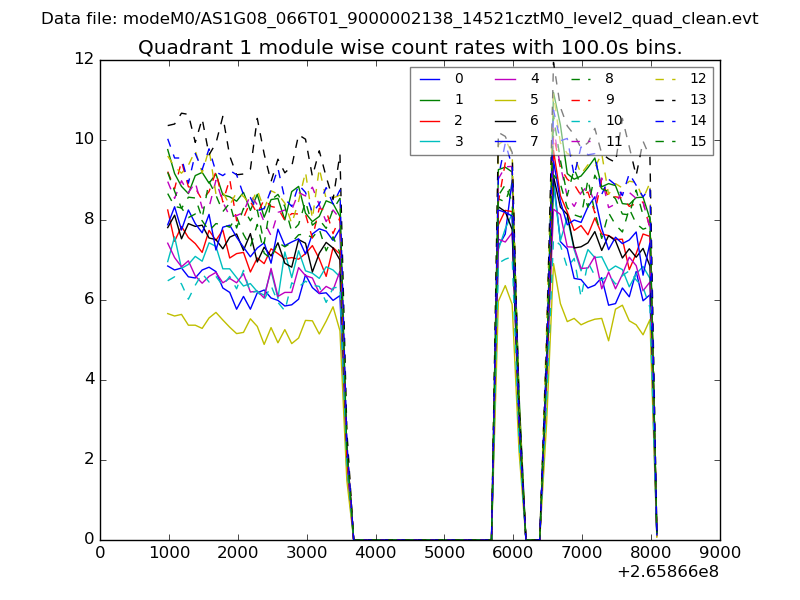
| Module-wise count rates for Quadrant A Data is divided into 100 sec bins |
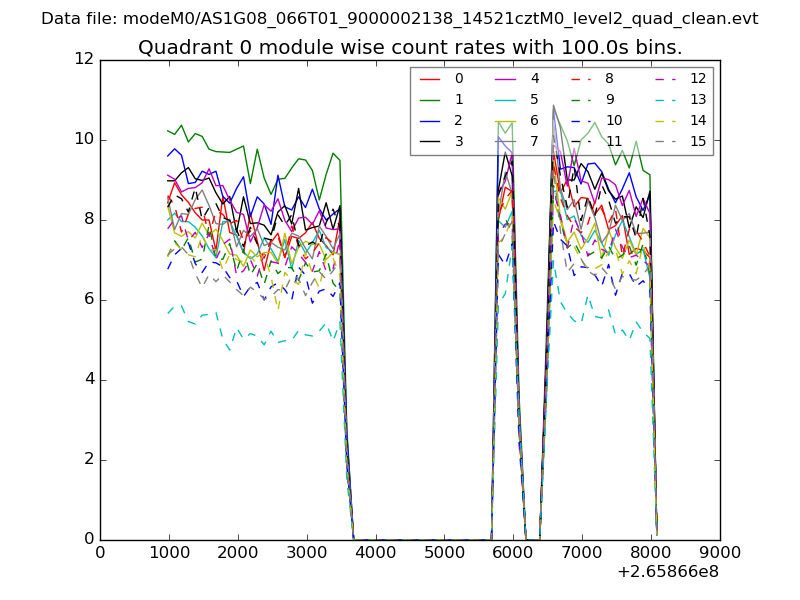 |
 |
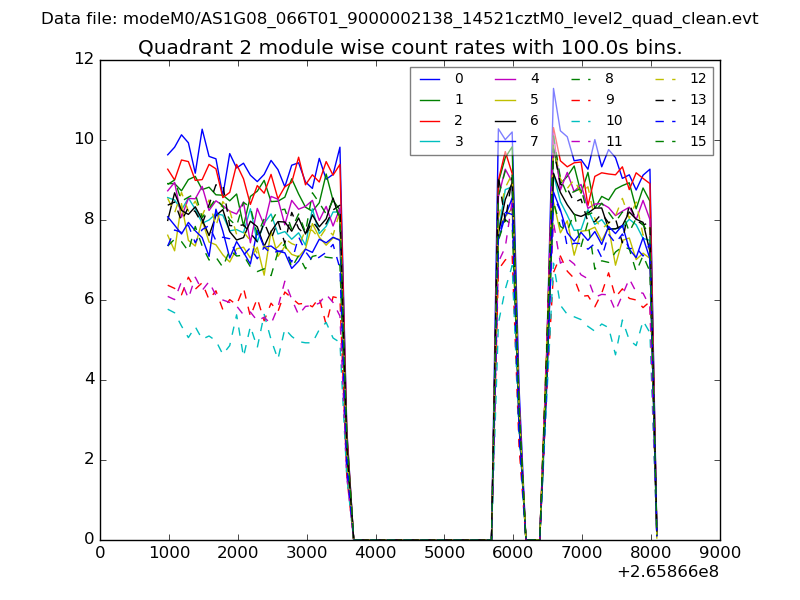
| Module-wise count rates for Quadrant B Data is divided into 100 sec bins |
 |
 |
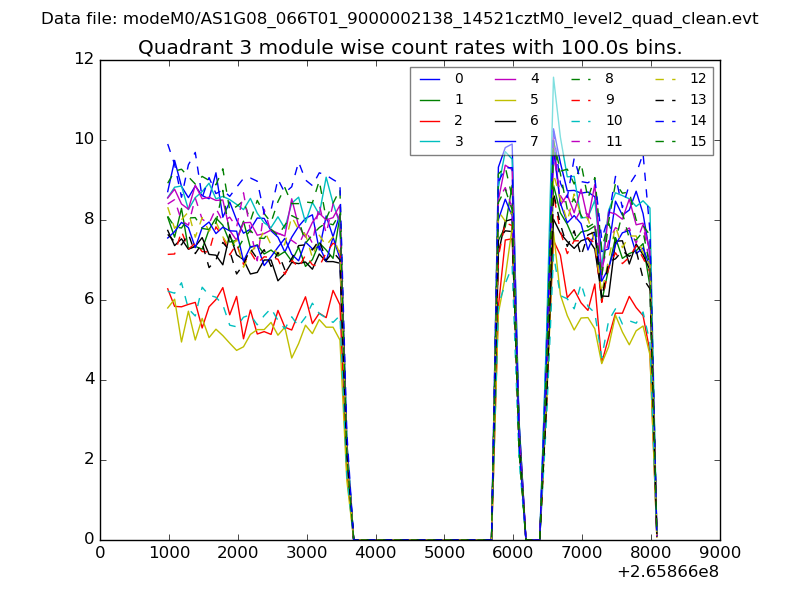
| Module-wise count rates for Quadrant C Data is divided into 100 sec bins |
 |
 |
| Module-wise count rates for Quadrant D Data is divided into 100 sec bins |
 |
 |
| Parameter | Plot |
|---|---|
| CZT HV Monitor | 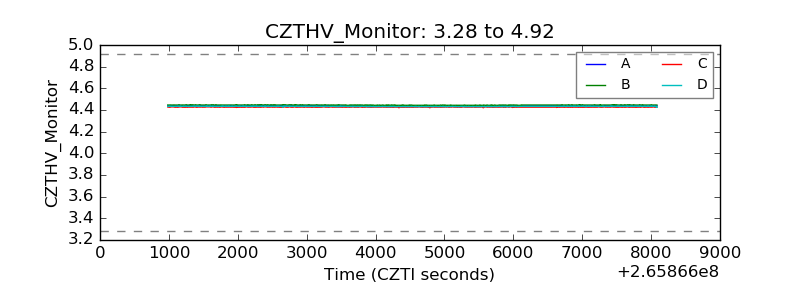 |
| D_VDD | 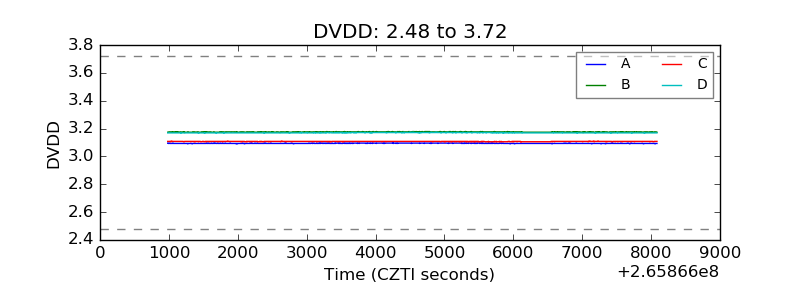 |
| Temperature 1 | 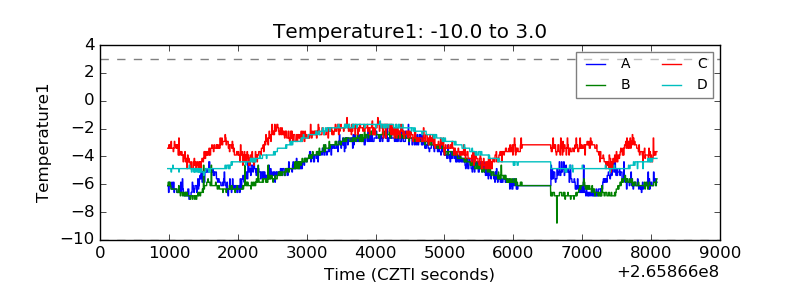 |
| Veto HV Monitor | 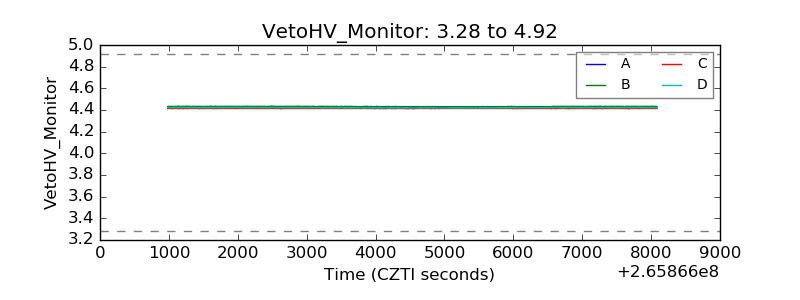 |
| Veto LLD | 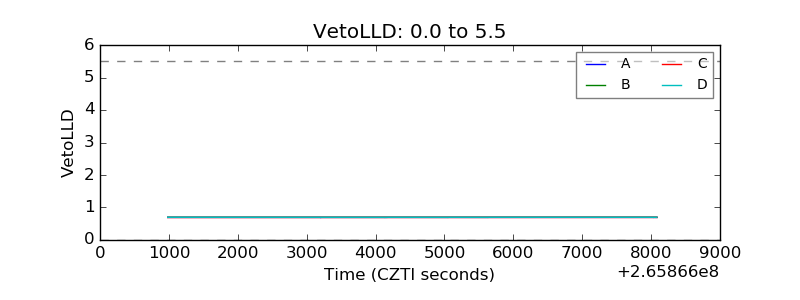 |
| Alpha Counter |  |
| _CPM_Rate |  |
| CZT Counter | 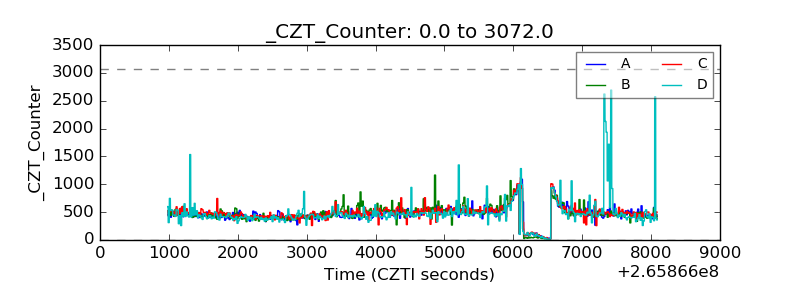 |
| +2.5 Volts monitor |  |
| +5 Volts monitor |  |
| _ROLL_ROT | 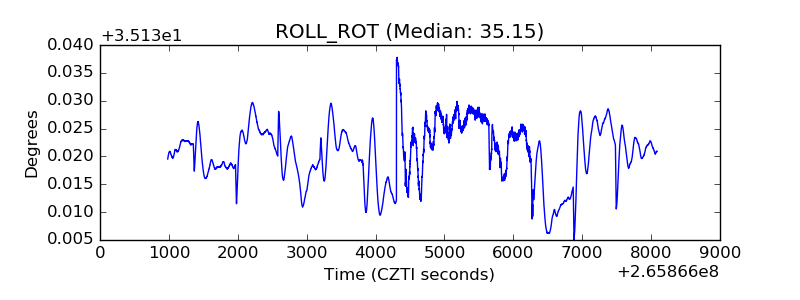 |
| _Roll_DEC | 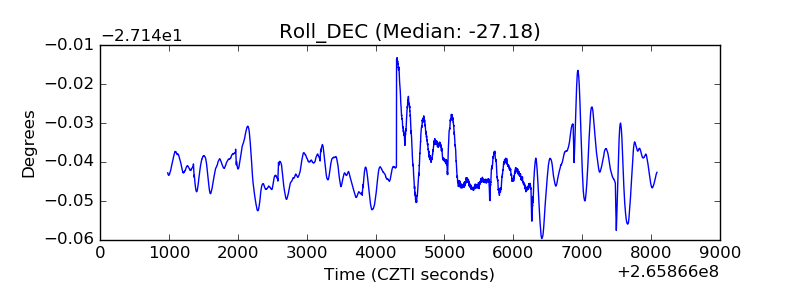 |
| _Roll_RA | 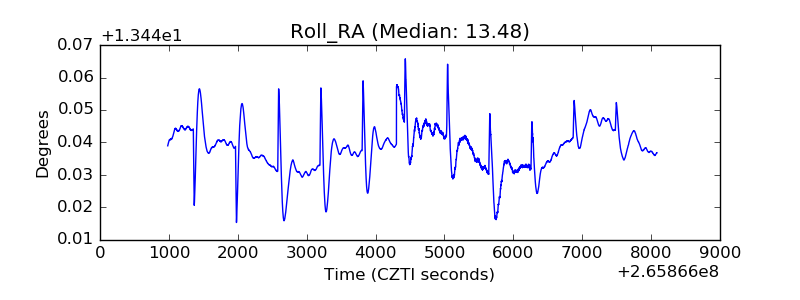 |
| Veto Counter | 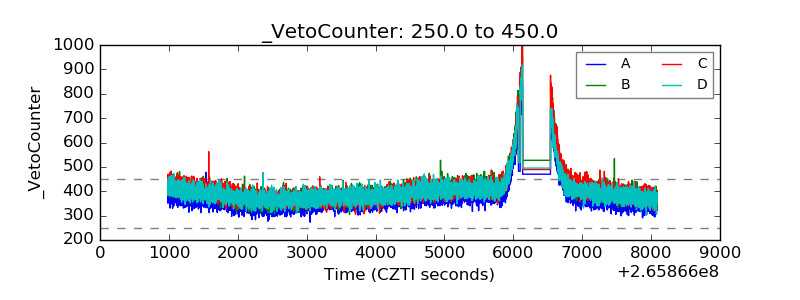 |