| Param | Original file | Final file |
|---|---|---|
| Filename | modeM0/AS1G08_066T01_9000002138_14526cztM0_level2.evt | modeM0/AS1G08_066T01_9000002138_14526cztM0_level2_quad_clean.evt |
| Size (bytes) | 678,075,840 | 116,075,520 |
| Size | 646.7 MB | 110.7 MB |
| Events in quadrant A | 4,663,622 | 705,193 |
| Events in quadrant B | 4,910,609 | 714,089 |
| Events in quadrant C | 4,894,344 | 708,971 |
| Events in quadrant D | 5,381,836 | 686,685 |
| Mode M9 | |||
|---|---|---|---|
| Quadrant | BADHDUFLAG | Total packets | Discarded packets |
| A | 0 | 5 | 0 |
| B | 0 | 5 | 0 |
| C | 0 | 5 | 0 |
| D | 0 | 5 | 0 |
| Mode SS | |||
|---|---|---|---|
| Quadrant | BADHDUFLAG | Total packets | Discarded packets |
| A | 0 | 204 | 0 |
| B | 0 | 204 | 0 |
| C | 0 | 204 | 0 |
| D | 0 | 204 | 0 |
| Mode M0 | |||
|---|---|---|---|
| Quadrant | BADHDUFLAG | Total packets | Discarded packets |
| A | 0 | 20463 | 1 |
| B | 0 | 21119 | 1 |
| C | 0 | 20643 | 1 |
| D | 0 | 22864 | 1 |
| Quadrant | Total seconds | Saturated seconds | Saturation percentage |
|---|---|---|---|
| A | 10107 | 63 | 0.623330% |
| B | 10107 | 82 | 0.811319% |
| C | 10107 | 45 | 0.445236% |
| D | 10107 | 138 | 1.365390% |
Noise dominated data is calculated using 1-second bins in cleaned event files. If a bin has >2000 counts, and if more than 50% of those come from <1% of pixels, then it is considered to be noise-dominated and hence unusable.
| Quadrant | # 1 sec bins | Bins with >0 counts | Bins with >2000 counts | High rate bins dominated by noise | Noise dominated (total time) | Noise dominated (detector-on time) | Marked lightcurve |
|---|---|---|---|---|---|---|---|
| A | 10563 | 10109 | 0 | 0 | 0.00% | 0.00% | 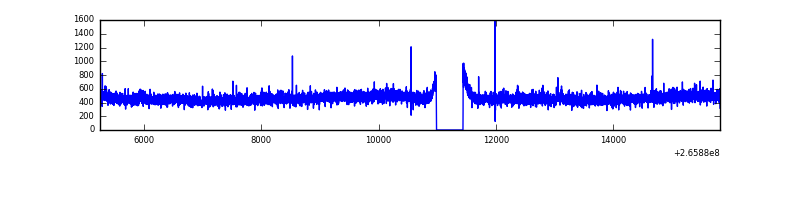 |
| B | 10563 | 10109 | 3 | 3 | 0.03% | 0.03% | 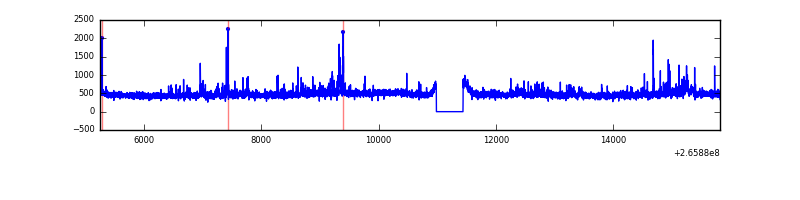 |
| C | 10563 | 10109 | 0 | 0 | 0.00% | 0.00% | 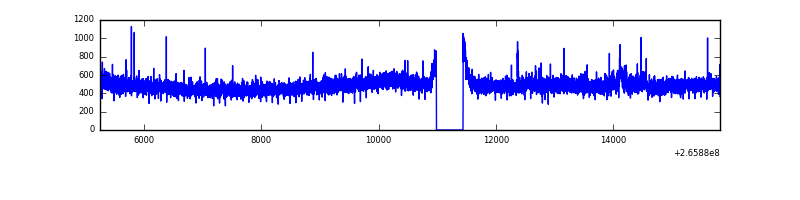 |
| D | 10563 | 10109 | 89 | 89 | 0.84% | 0.88% | 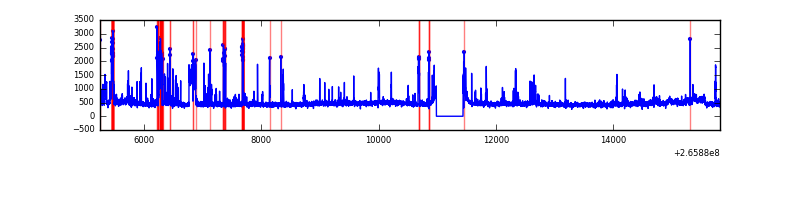 |
Top three noisy pixels from each quadrant. If the there are fewer than three noisy pixels in the level2.evt file, extra rows are filled as -1
| Pixel properties | Quadrant properties | ||||||
|---|---|---|---|---|---|---|---|
| Quadrant | DetID | PixID | Counts | Sigma | Mean | Median | Sigma |
| A | 8 | 15 | 88055 | 361.71 | 1176 | 1149 | 240.3 |
| A | 12 | 189 | 28193 | 112.56 | 1176 | 1149 | 240.3 |
| A | 0 | 226 | 10776 | 40.07 | 1176 | 1149 | 240.3 |
| B | 0 | 189 | 134308 | 595.59 | 1171 | 1142 | 223.6 |
| B | 0 | 219 | 58709 | 257.47 | 1171 | 1142 | 223.6 |
| B | 3 | 209 | 47817 | 208.75 | 1171 | 1142 | 223.6 |
| C | 3 | 233 | 395041 | 1479.68 | 1142 | 1146 | 266.2 |
| C | 8 | 128 | 18094 | 63.67 | 1142 | 1146 | 266.2 |
| C | 0 | 207 | 9688 | 32.09 | 1142 | 1146 | 266.2 |
| D | 12 | 110 | 388203 | 1402.49 | 1143 | 1114 | 276.0 |
| D | 10 | 199 | 253536 | 914.57 | 1143 | 1114 | 276.0 |
| D | 13 | 122 | 151222 | 543.87 | 1143 | 1114 | 276.0 |
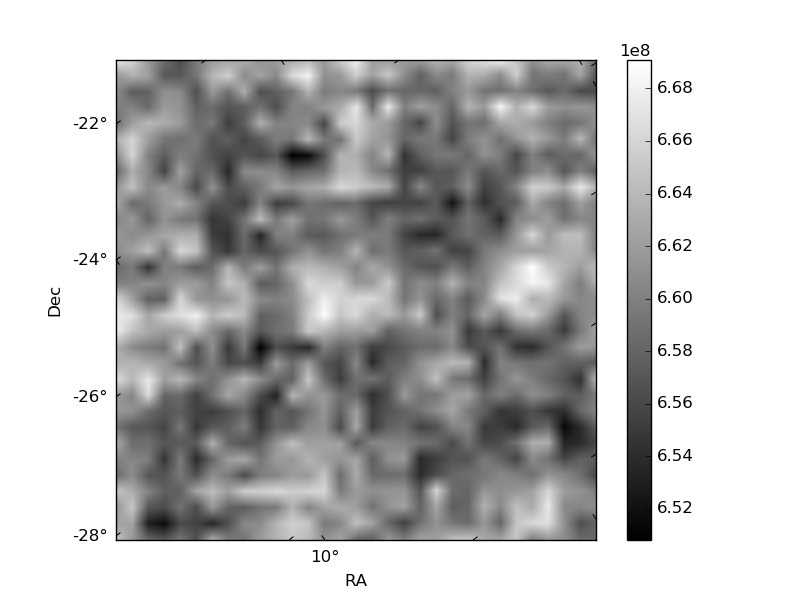
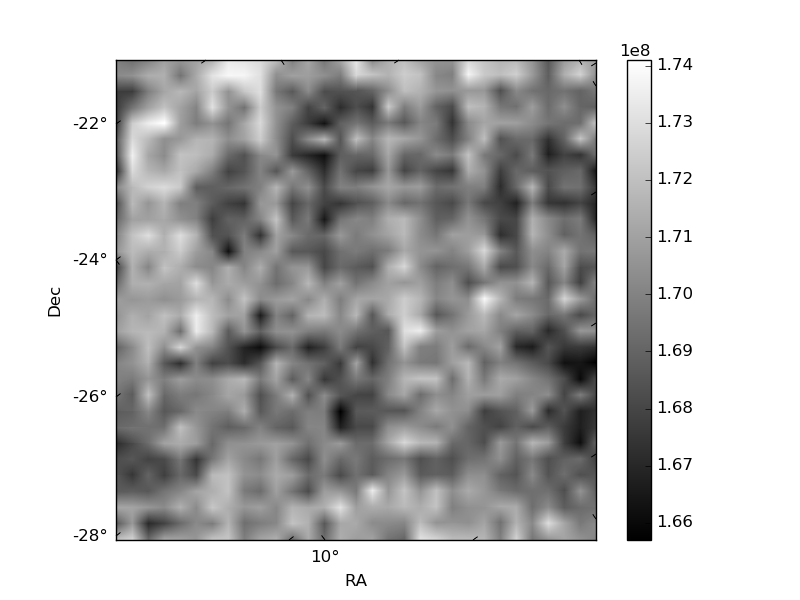
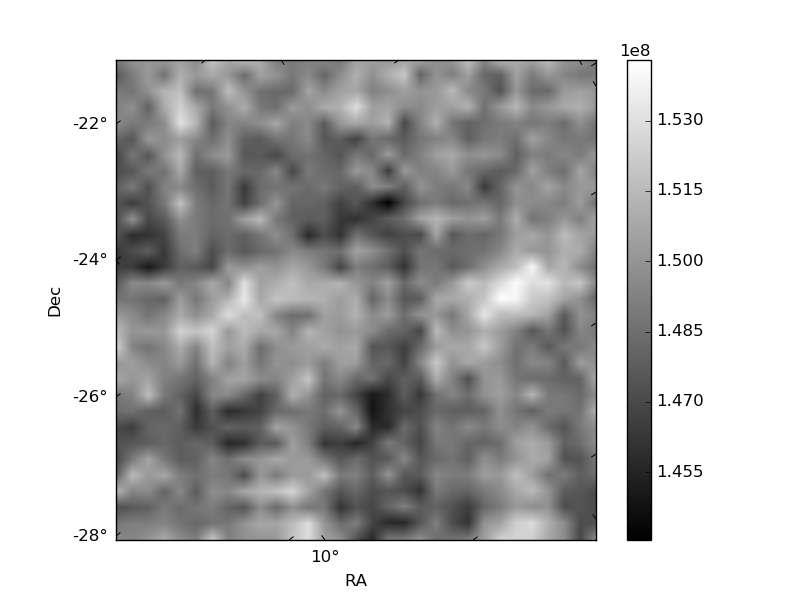
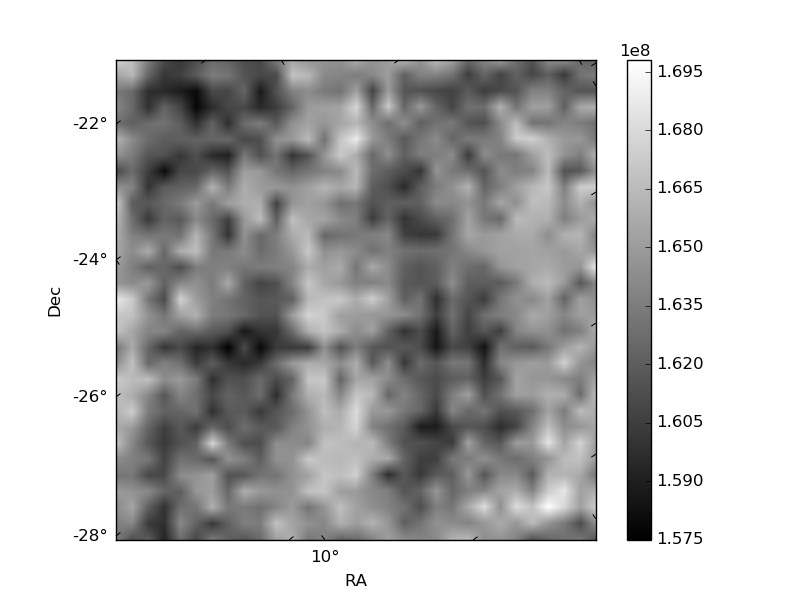
Histogram calculated using DETX and DETY for each event in the final _common_clean file
| Quadrant A | 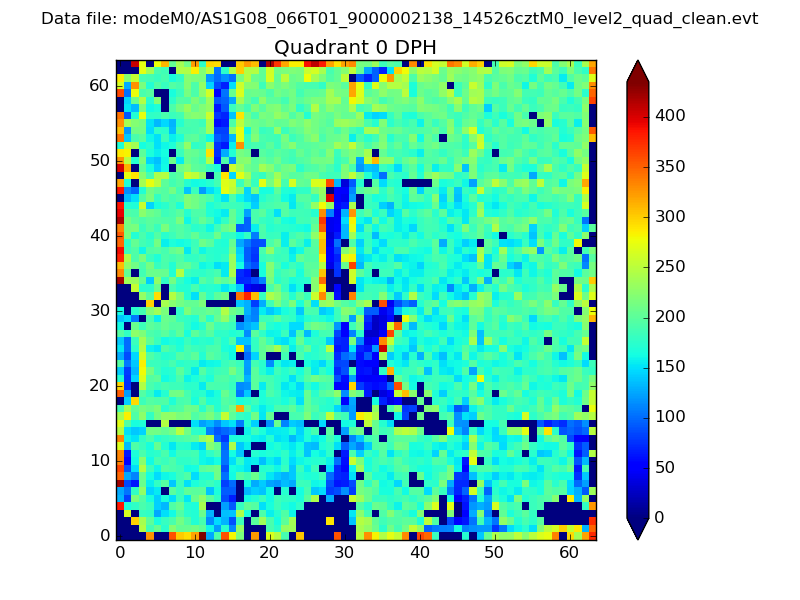 |
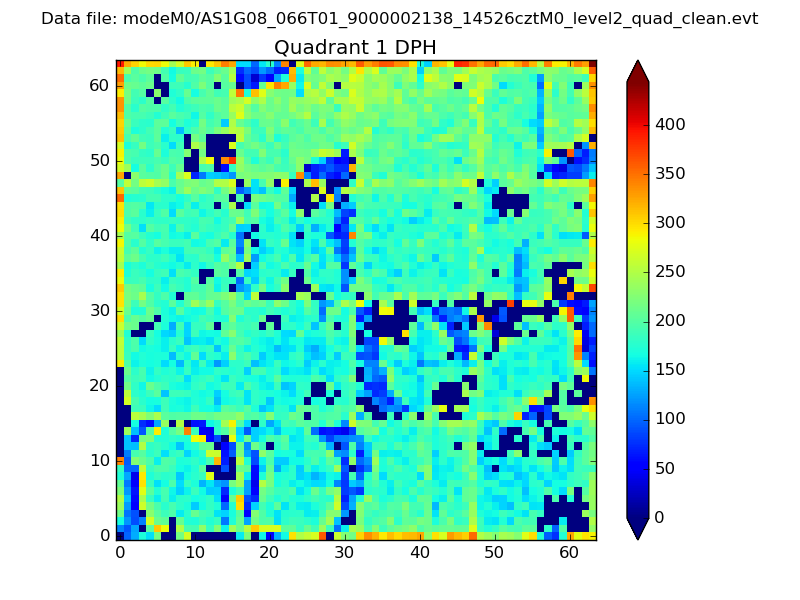 |
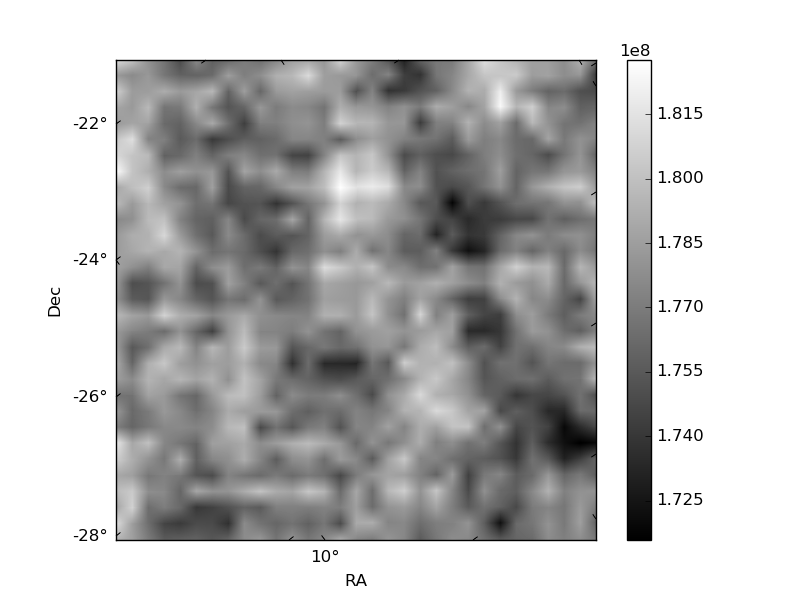
Quadrant B |
|---|---|---|---|
| Quadrant D | 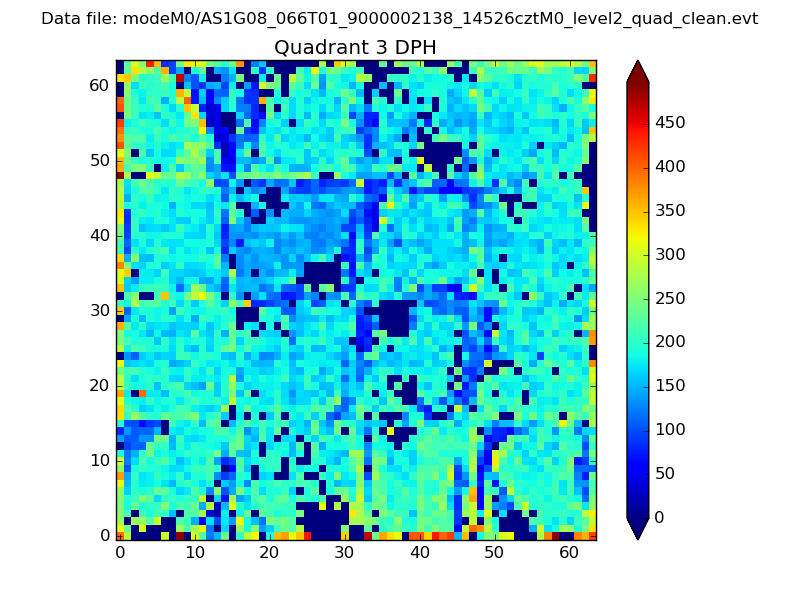 |
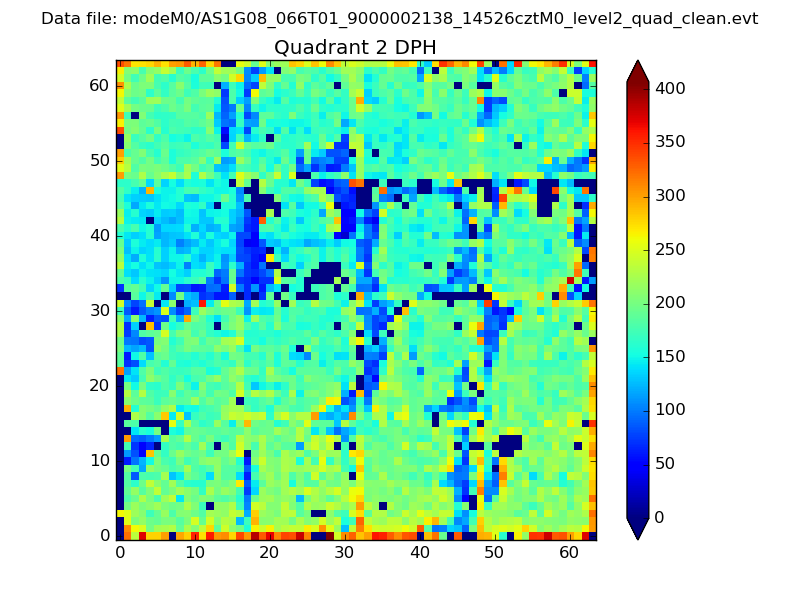 |
Quadrant C |
| Plot type | Count rate plots | Images |
|---|---|---|
| Comparison with Poisson distribution Blue bars denote a histogram of data divided into 1 sec bins. Red curve is a Poisson curve with rate = median count rate of data. |
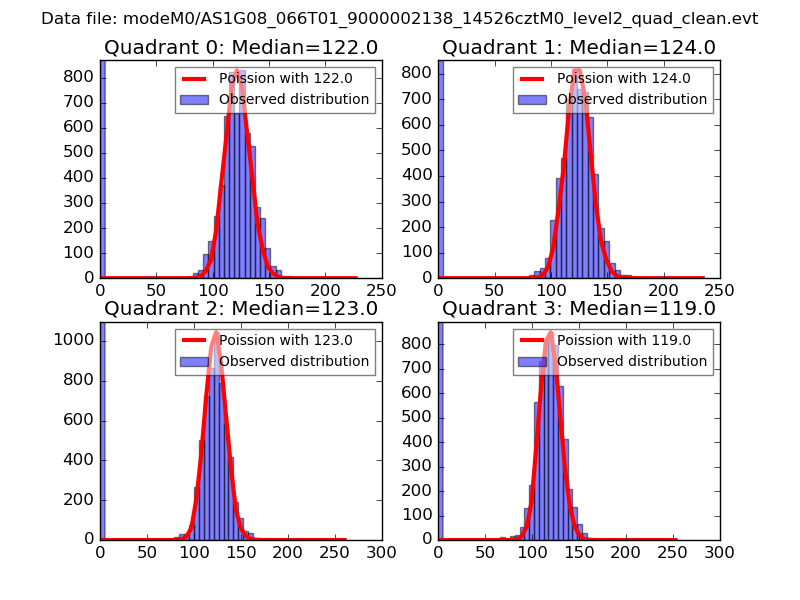 |
 |
| Quadrant-wise count rates Data is divided into 100 sec bins |
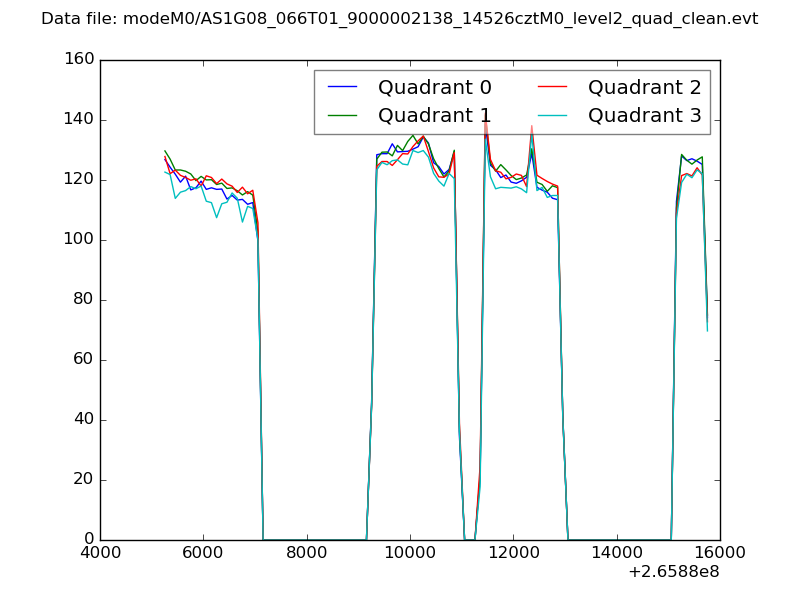 |
|
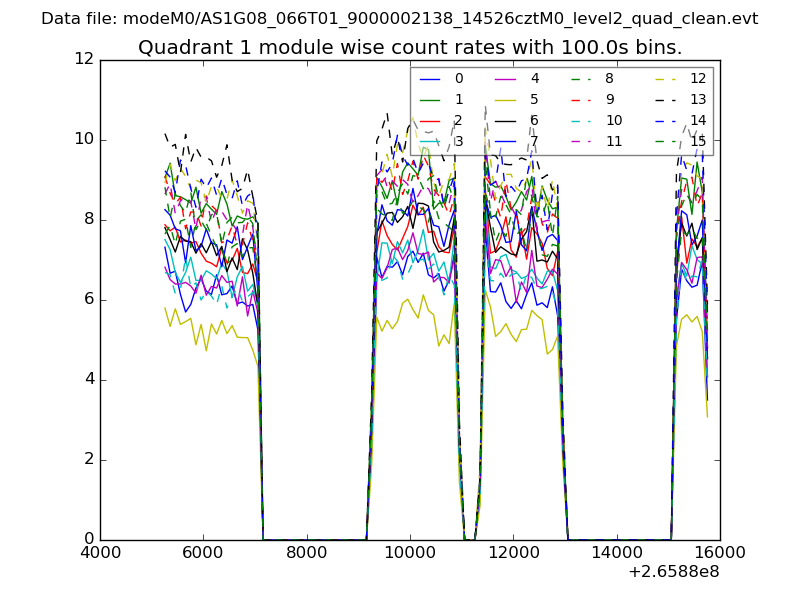
| Module-wise count rates for Quadrant A Data is divided into 100 sec bins |
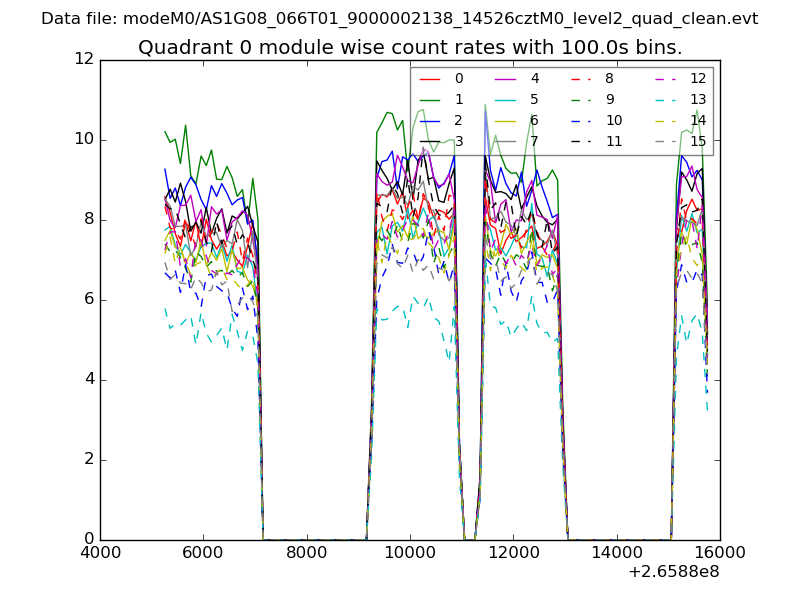 |
 |
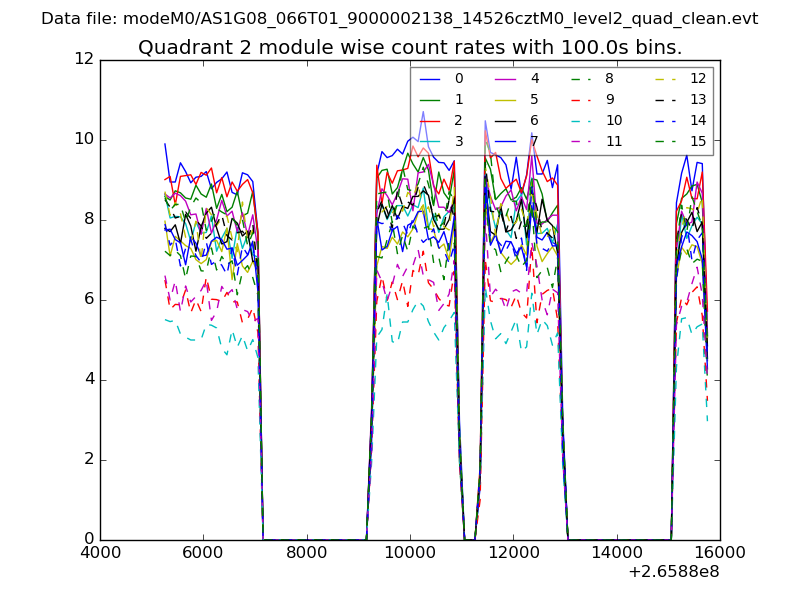
| Module-wise count rates for Quadrant B Data is divided into 100 sec bins |
 |
 |
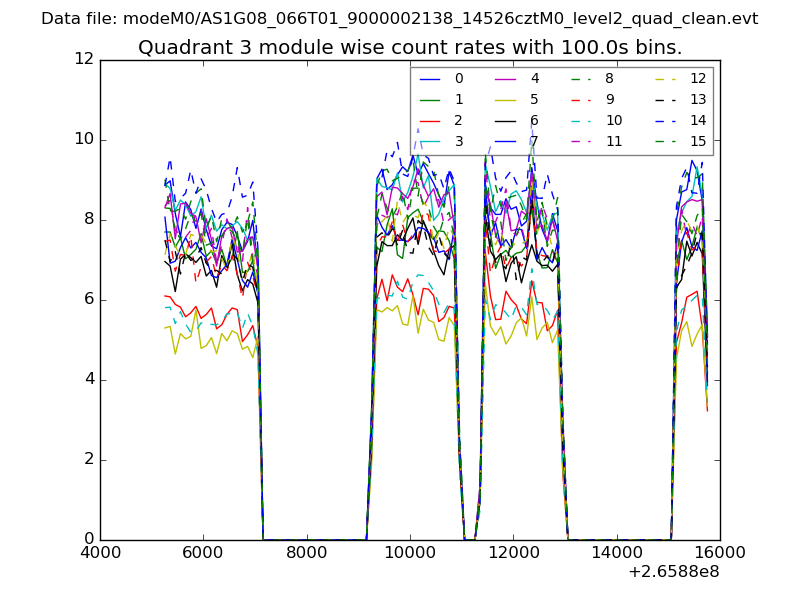
| Module-wise count rates for Quadrant C Data is divided into 100 sec bins |
 |
 |
| Module-wise count rates for Quadrant D Data is divided into 100 sec bins |
 |
 |
| Parameter | Plot |
|---|---|
| CZT HV Monitor | 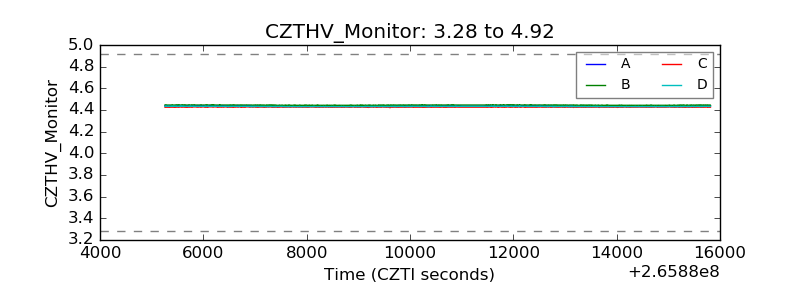 |
| D_VDD | 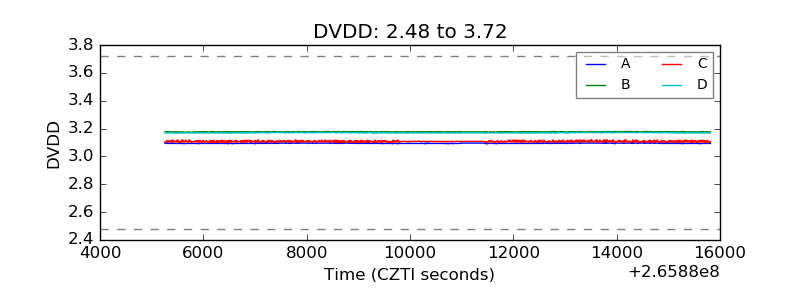 |
| Temperature 1 | 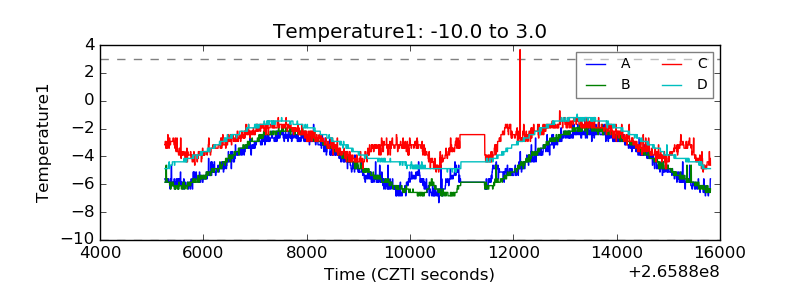 |
| Veto HV Monitor | 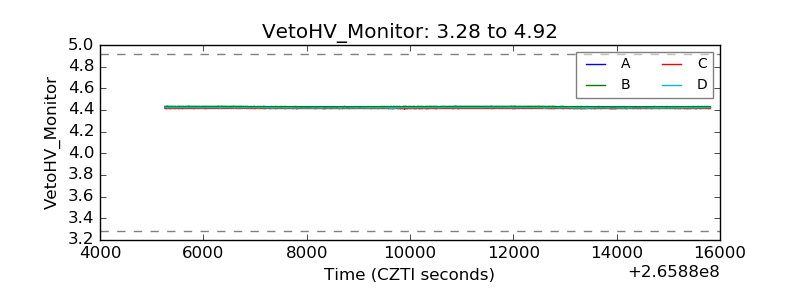 |
| Veto LLD | 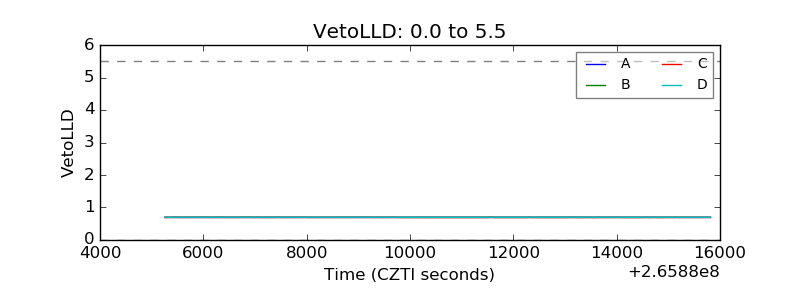 |
| Alpha Counter | 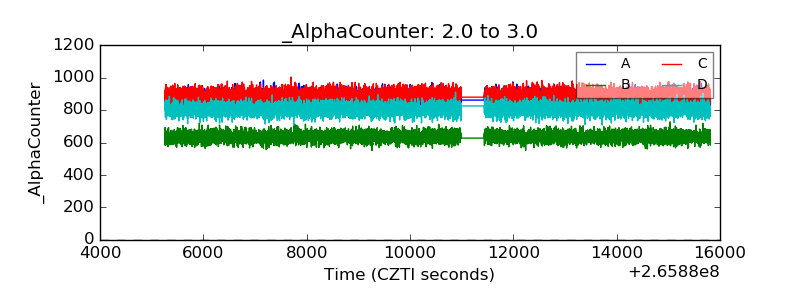 |
| _CPM_Rate | 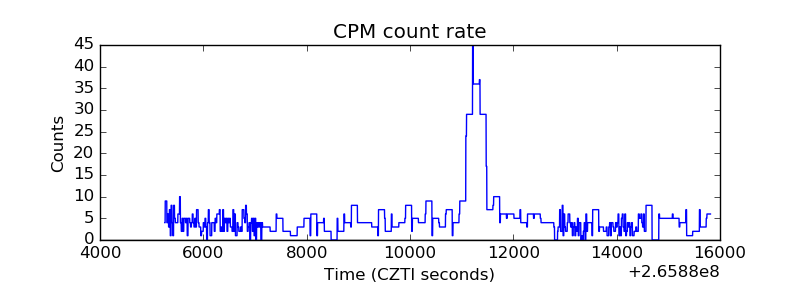 |
| CZT Counter | 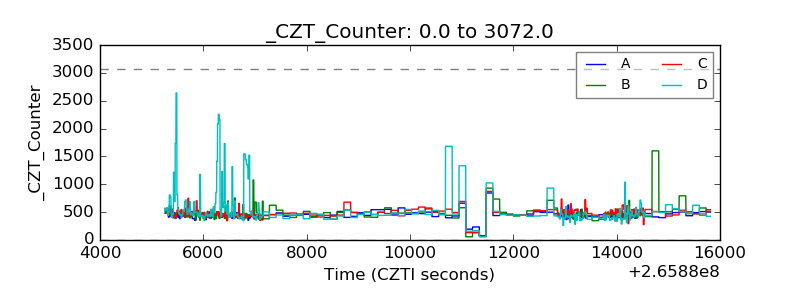 |
| +2.5 Volts monitor |  |
| +5 Volts monitor |  |
| _ROLL_ROT | 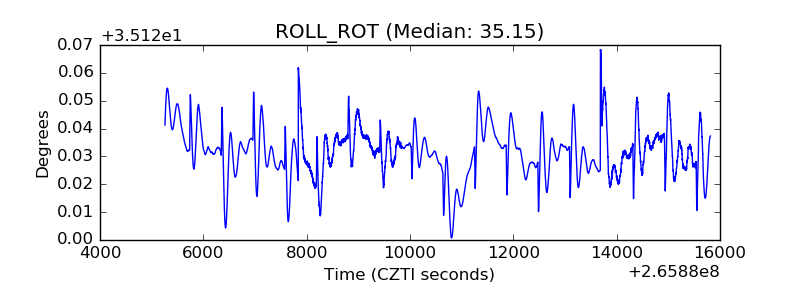 |
| _Roll_DEC | 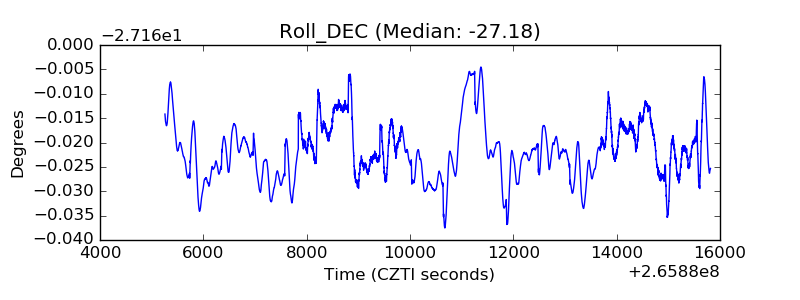 |
| _Roll_RA | 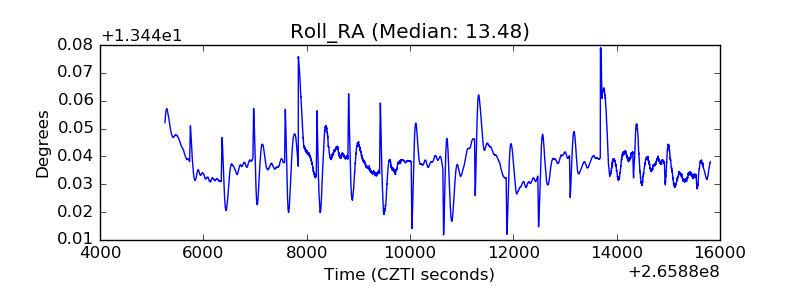 |
| Veto Counter | 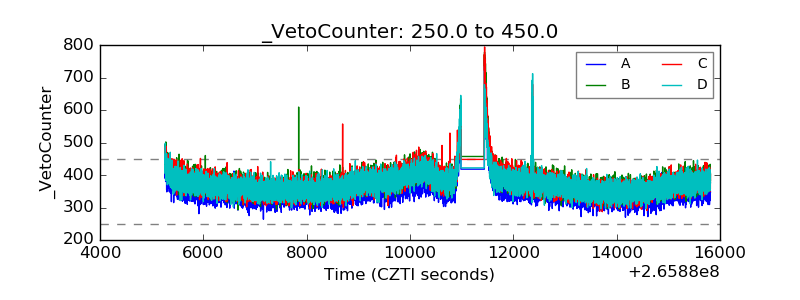 |