| Param | Original file | Final file |
|---|---|---|
| Filename | modeM0/AS1A04_212T02_9000002140cztM0_level2.fits | modeM0/AS1A04_212T02_9000002140cztM0_level2_quad_clean.evt |
| Size (bytes) | 77,863,680 | 92,217,600 |
| Size | 74.3 MB | 87.9 MB |
| Events in quadrant A | 461,664 | 575,930 |
| Events in quadrant B | 444,828 | 564,247 |
| Events in quadrant C | 459,958 | 548,168 |
| Events in quadrant D | 398,592 | 510,624 |
| Mode M9 | |||
|---|---|---|---|
| Quadrant | BADHDUFLAG | Total packets | Discarded packets |
| A | 0 | 13 | 0 |
| B | 0 | 13 | 0 |
| C | 0 | 13 | 0 |
| D | 0 | 13 | 0 |
| Mode SS | |||
|---|---|---|---|
| Quadrant | BADHDUFLAG | Total packets | Discarded packets |
| A | 0 | 172 | 0 |
| B | 0 | 172 | 0 |
| C | 0 | 172 | 0 |
| D | 0 | 172 | 0 |
| Mode M0 | |||
|---|---|---|---|
| Quadrant | BADHDUFLAG | Total packets | Discarded packets |
| A | 0 | 18452 | 0 |
| B | 0 | 18930 | 0 |
| C | 0 | 18165 | 0 |
| D | 0 | 19256 | 0 |
| Quadrant | Total seconds | Saturated seconds | Saturation percentage |
|---|---|---|---|
| A | 8547 | 56 | 0.655201% |
| B | 8547 | 102 | 1.193401% |
| C | 8547 | 42 | 0.491400% |
| D | 8547 | 152 | 1.778402% |
Noise dominated data is calculated using 1-second bins in cleaned event files. If a bin has >2000 counts, and if more than 50% of those come from <1% of pixels, then it is considered to be noise-dominated and hence unusable.
| Quadrant | # 1 sec bins | Bins with >0 counts | Bins with >2000 counts | High rate bins dominated by noise | Noise dominated (total time) | Noise dominated (detector-on time) | Marked lightcurve |
|---|---|---|---|---|---|---|---|
| A | 9351 | 8546 | 0 | 0 | 0.00% | 0.00% | 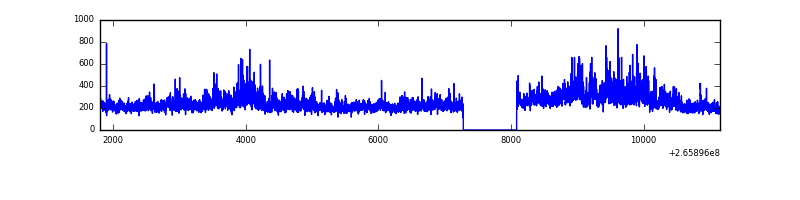 |
| B | 9351 | 8546 | 0 | 0 | 0.00% | 0.00% |  |
| C | 9351 | 8546 | 0 | 0 | 0.00% | 0.00% |  |
| D | 9351 | 8546 | 0 | 0 | 0.00% | 0.00% | 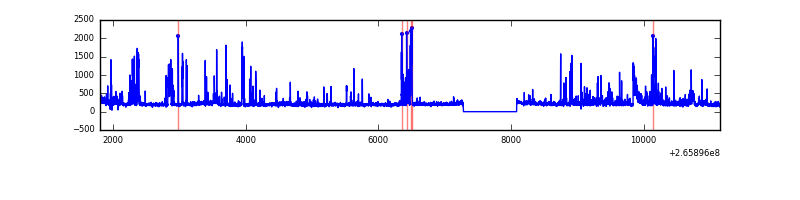 |
Top three noisy pixels from each quadrant. If the there are fewer than three noisy pixels in the level2.evt file, extra rows are filled as -1
| Pixel properties | Quadrant properties | ||||||
|---|---|---|---|---|---|---|---|
| Quadrant | DetID | PixID | Counts | Sigma | Mean | Median | Sigma |
| A | 0 | 29 | 489 | 11.78 | 120 | 113 | 31.9 |
| A | 7 | 110 | 386 | 8.56 | 120 | 113 | 31.9 |
| A | 0 | 30 | 379 | 8.34 | 120 | 113 | 31.9 |
| B | 2 | 9 | 407 | 11.38 | 117 | 112 | 25.9 |
| B | 14 | 254 | 314 | 7.79 | 117 | 112 | 25.9 |
| B | 3 | 17 | 305 | 7.45 | 117 | 112 | 25.9 |
| C | 12 | 241 | 327 | 6.51 | 121 | 113 | 32.9 |
| C | 4 | 254 | 326 | 6.48 | 121 | 113 | 32.9 |
| C | 2 | 191 | 320 | 6.3 | 121 | 113 | 32.9 |
| D | 1 | 3 | 312 | 6.68 | 113 | 102 | 31.4 |
| D | 4 | 246 | 309 | 6.58 | 113 | 102 | 31.4 |
| D | 6 | 231 | 308 | 6.55 | 113 | 102 | 31.4 |
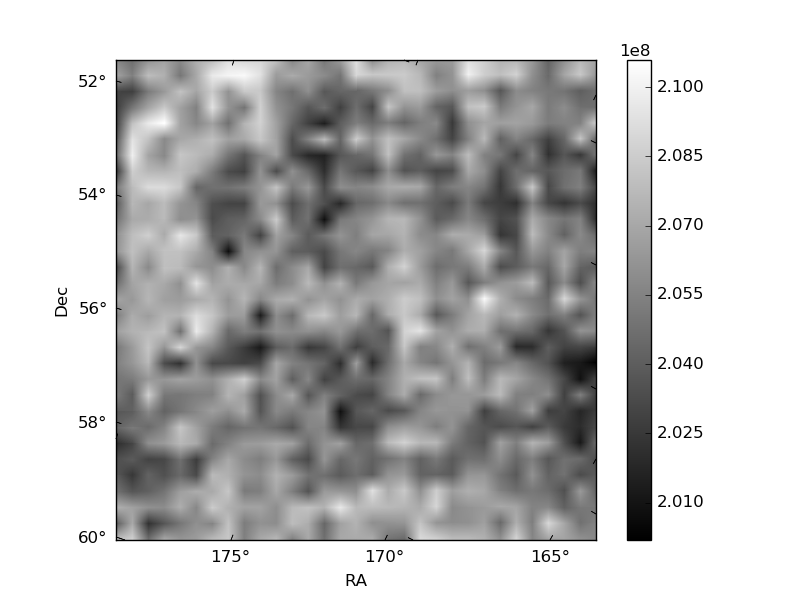
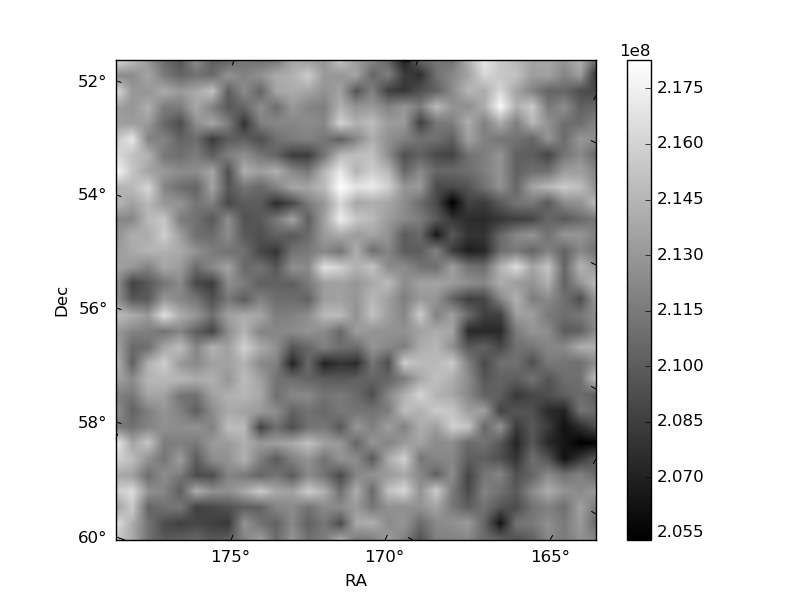
Histogram calculated using DETX and DETY for each event in the final _common_clean file
| Quadrant A | 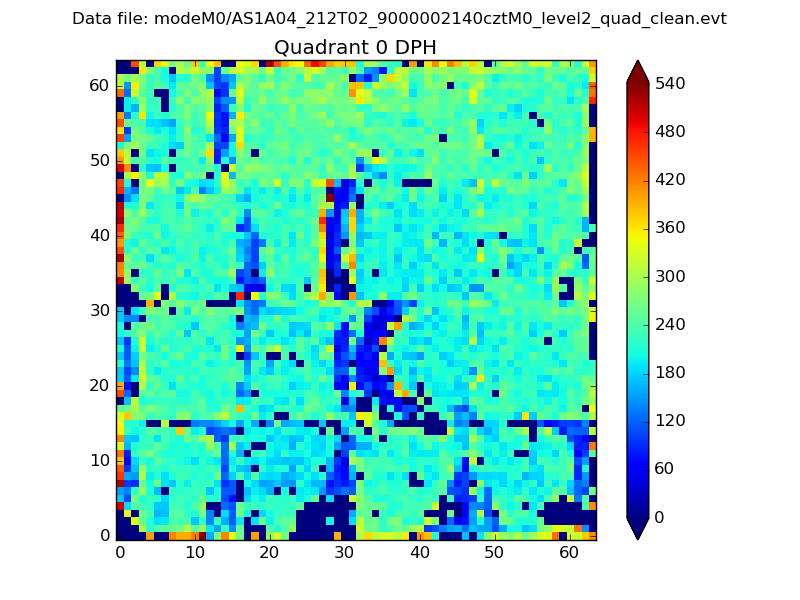 |
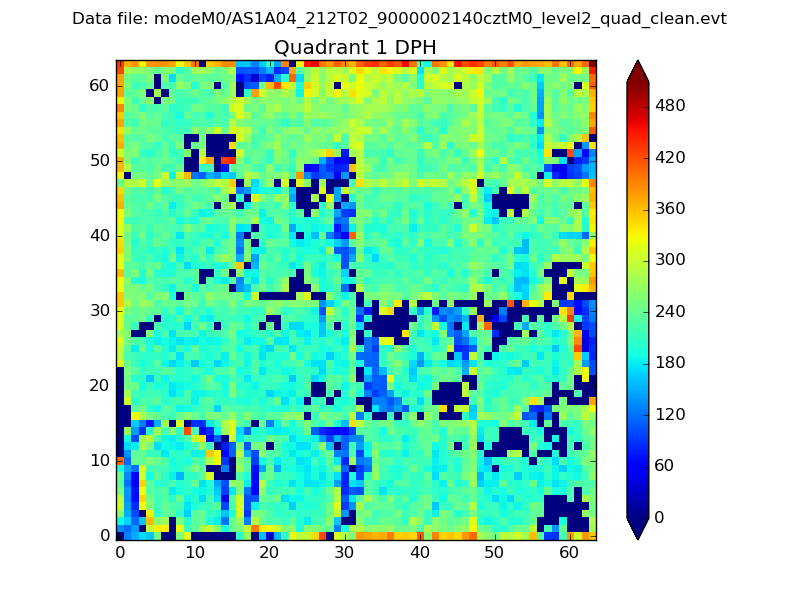 |
Quadrant B |
|---|---|---|---|
| Quadrant D |  |
 |
Quadrant C |
| Plot type | Count rate plots | Images |
|---|---|---|
| Comparison with Poisson distribution Blue bars denote a histogram of data divided into 1 sec bins. Red curve is a Poisson curve with rate = median count rate of data. |
 |
 |
| Quadrant-wise count rates Data is divided into 100 sec bins |
 |
|
| Module-wise count rates for Quadrant A Data is divided into 100 sec bins |
 |
 |
| Module-wise count rates for Quadrant B Data is divided into 100 sec bins |
 |
 |
| Module-wise count rates for Quadrant C Data is divided into 100 sec bins |
 |
 |
| Module-wise count rates for Quadrant D Data is divided into 100 sec bins |
 |
 |
| Parameter | Plot |
|---|---|
| CZT HV Monitor |  |
| D_VDD | 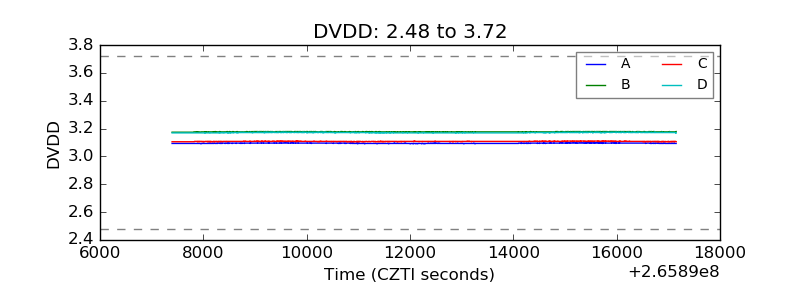 |
| Temperature 1 |  |
| Veto HV Monitor |  |
| Veto LLD |  |
| Alpha Counter |  |
| _CPM_Rate | 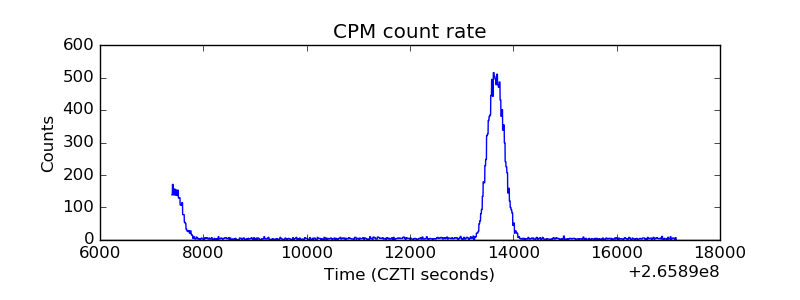 |
| CZT Counter | 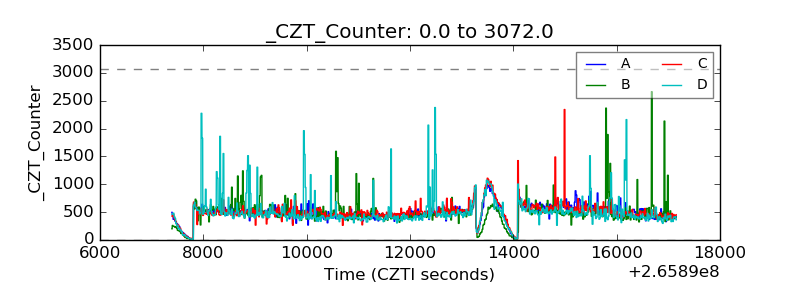 |
| +2.5 Volts monitor |  |
| +5 Volts monitor |  |
| _ROLL_ROT |  |
| _Roll_DEC |  |
| _Roll_RA |  |
| Veto Counter |  |