| Param | Original file | Final file |
|---|---|---|
| Filename | modeM0/AS1A04_212T02_9000002140_14526cztM0_level2.evt | modeM0/AS1A04_212T02_9000002140_14526cztM0_level2_quad_clean.evt |
| Size (bytes) | 490,858,560 | 102,669,120 |
| Size | 468.1 MB | 97.9 MB |
| Events in quadrant A | 3,545,026 | 663,287 |
| Events in quadrant B | 3,641,781 | 665,447 |
| Events in quadrant C | 3,596,232 | 658,998 |
| Events in quadrant D | 3,612,766 | 639,460 |
| Mode M9 | |||
|---|---|---|---|
| Quadrant | BADHDUFLAG | Total packets | Discarded packets |
| A | 0 | 13 | 0 |
| B | 0 | 13 | 0 |
| C | 0 | 13 | 0 |
| D | 0 | 13 | 0 |
| Mode SS | |||
|---|---|---|---|
| Quadrant | BADHDUFLAG | Total packets | Discarded packets |
| A | 0 | 140 | 0 |
| B | 0 | 140 | 0 |
| C | 0 | 140 | 0 |
| D | 0 | 140 | 0 |
| Mode M0 | |||
|---|---|---|---|
| Quadrant | BADHDUFLAG | Total packets | Discarded packets |
| A | 0 | 15004 | 3 |
| B | 0 | 15227 | 2 |
| C | 0 | 14784 | 2 |
| D | 0 | 15572 | 2 |
| Quadrant | Total seconds | Saturated seconds | Saturation percentage |
|---|---|---|---|
| A | 6922 | 55 | 0.794568% |
| B | 6922 | 79 | 1.141289% |
| C | 6922 | 42 | 0.606761% |
| D | 6922 | 138 | 1.993643% |
Noise dominated data is calculated using 1-second bins in cleaned event files. If a bin has >2000 counts, and if more than 50% of those come from <1% of pixels, then it is considered to be noise-dominated and hence unusable.
| Quadrant | # 1 sec bins | Bins with >0 counts | Bins with >2000 counts | High rate bins dominated by noise | Noise dominated (total time) | Noise dominated (detector-on time) | Marked lightcurve |
|---|---|---|---|---|---|---|---|
| A | 7728 | 6924 | 0 | 0 | 0.00% | 0.00% | 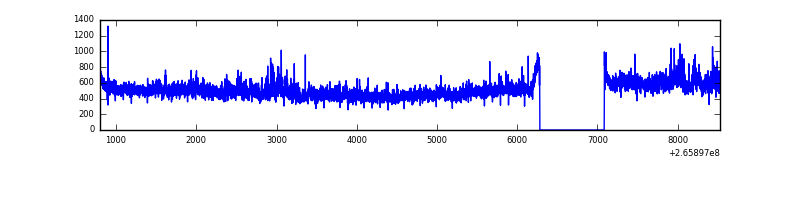 |
| B | 7728 | 6924 | 17 | 17 | 0.22% | 0.25% | 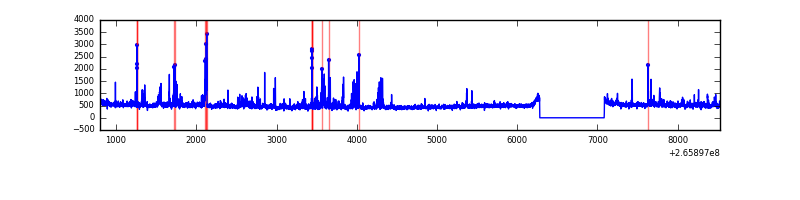 |
| C | 7728 | 6924 | 4 | 4 | 0.05% | 0.06% | 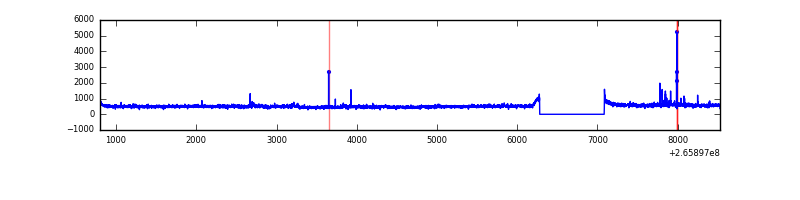 |
| D | 7728 | 6924 | 51 | 51 | 0.66% | 0.74% | 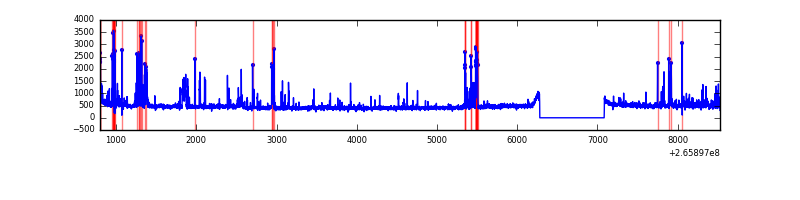 |
Top three noisy pixels from each quadrant. If the there are fewer than three noisy pixels in the level2.evt file, extra rows are filled as -1
| Pixel properties | Quadrant properties | ||||||
|---|---|---|---|---|---|---|---|
| Quadrant | DetID | PixID | Counts | Sigma | Mean | Median | Sigma |
| A | 8 | 15 | 296670 | 1770.77 | 818 | 797 | 167.1 |
| A | 12 | 189 | 53134 | 313.23 | 818 | 797 | 167.1 |
| A | 0 | 23 | 17134 | 97.78 | 818 | 797 | 167.1 |
| B | 0 | 219 | 105116 | 668.33 | 814 | 794 | 156.1 |
| B | 0 | 189 | 71886 | 455.45 | 814 | 794 | 156.1 |
| B | 10 | 16 | 48032 | 302.63 | 814 | 794 | 156.1 |
| C | 3 | 233 | 452801 | 2454.88 | 796 | 798 | 184.1 |
| C | 0 | 207 | 35011 | 185.81 | 796 | 798 | 184.1 |
| C | 14 | 234 | 5666 | 26.44 | 796 | 798 | 184.1 |
| D | 10 | 199 | 237988 | 1200.07 | 792 | 768 | 197.7 |
| D | 12 | 110 | 194750 | 981.33 | 792 | 768 | 197.7 |
| D | 12 | 233 | 32042 | 158.21 | 792 | 768 | 197.7 |
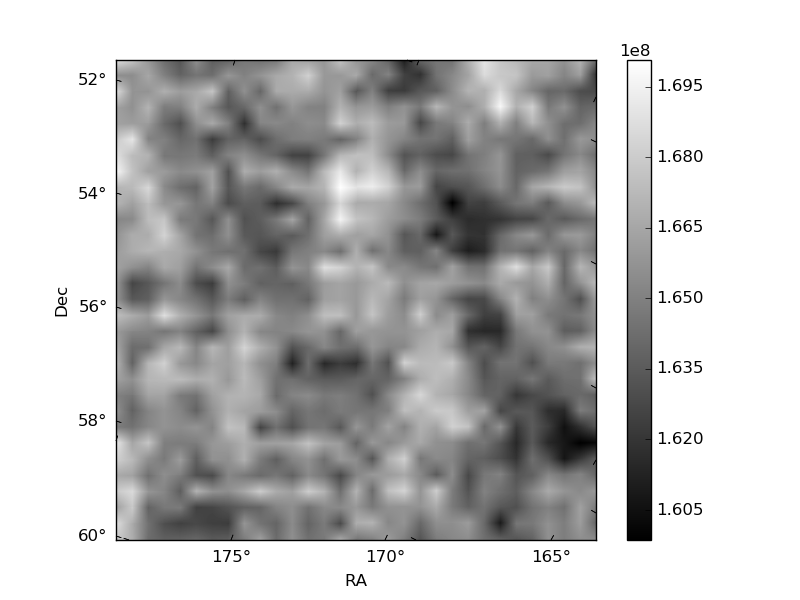
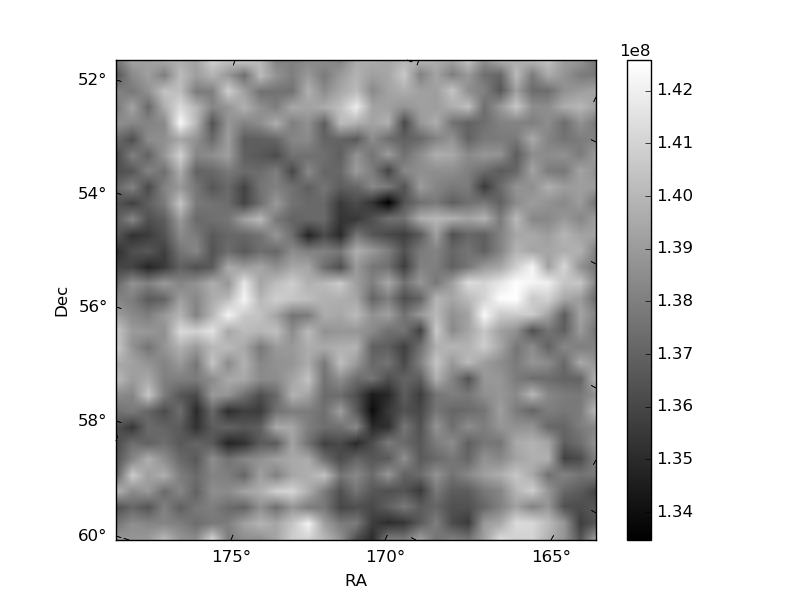
Histogram calculated using DETX and DETY for each event in the final _common_clean file
| Quadrant A | 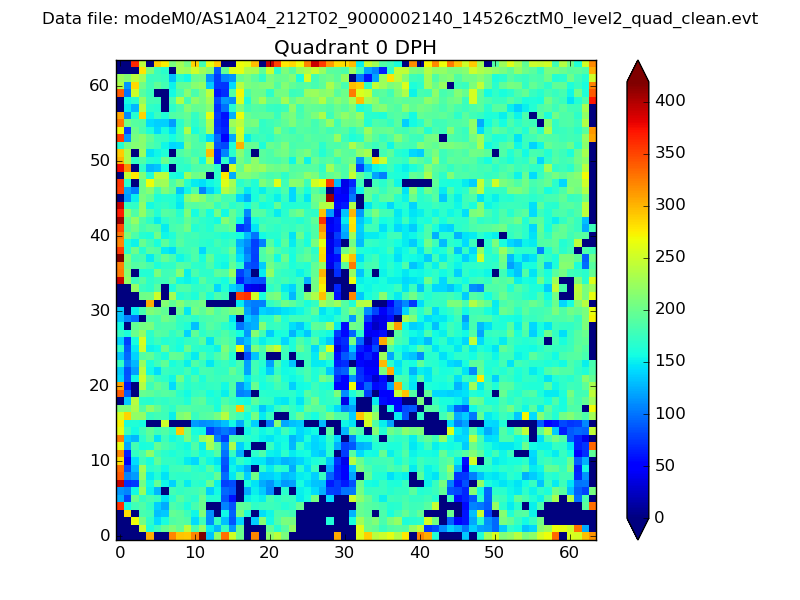 |
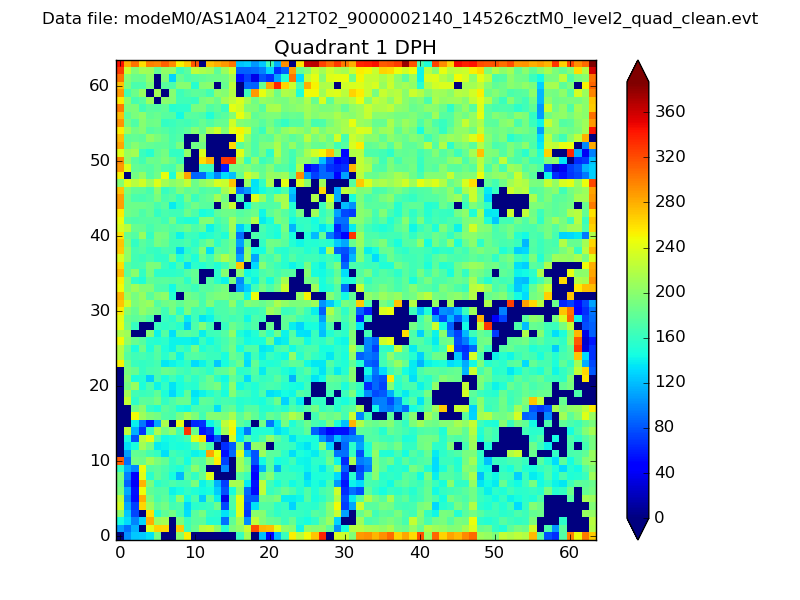 |
Quadrant B |
|---|---|---|---|
| Quadrant D | 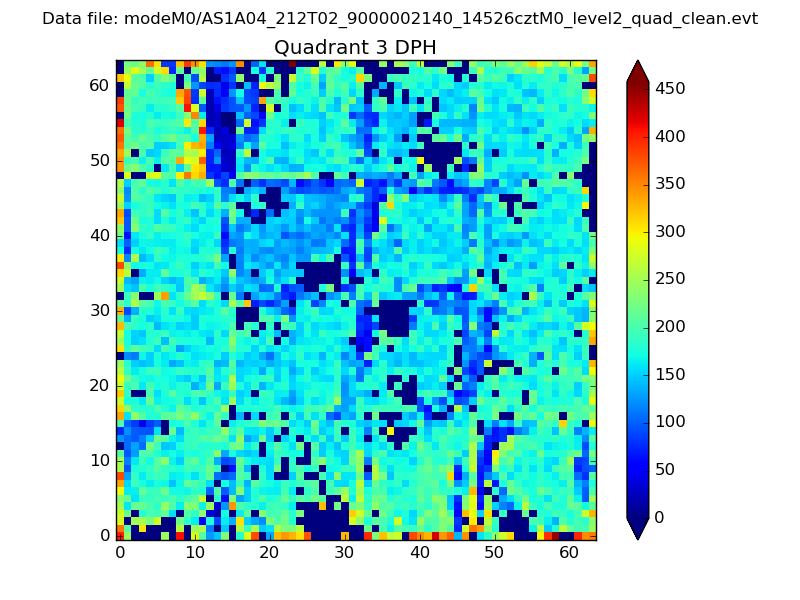 |
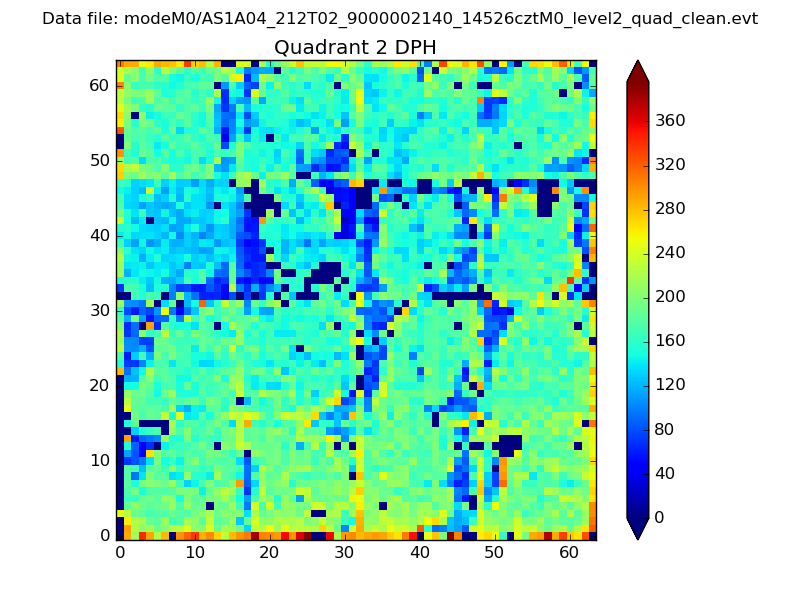 |
Quadrant C |
| Plot type | Count rate plots | Images |
|---|---|---|
| Comparison with Poisson distribution Blue bars denote a histogram of data divided into 1 sec bins. Red curve is a Poisson curve with rate = median count rate of data. |
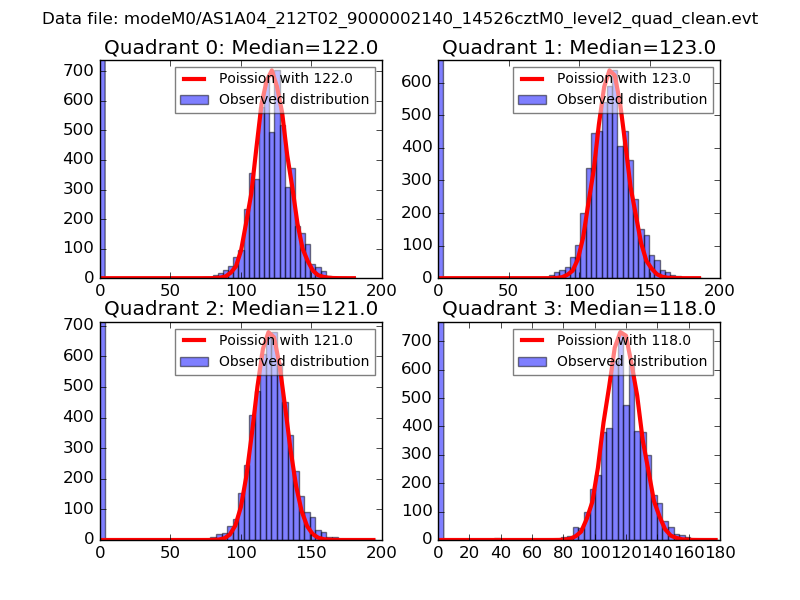 |
 |
| Quadrant-wise count rates Data is divided into 100 sec bins |
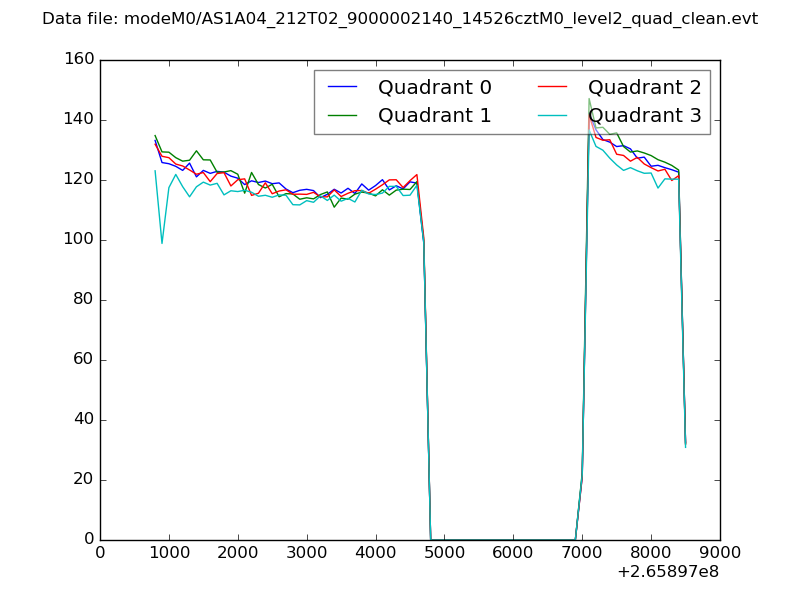 |
|
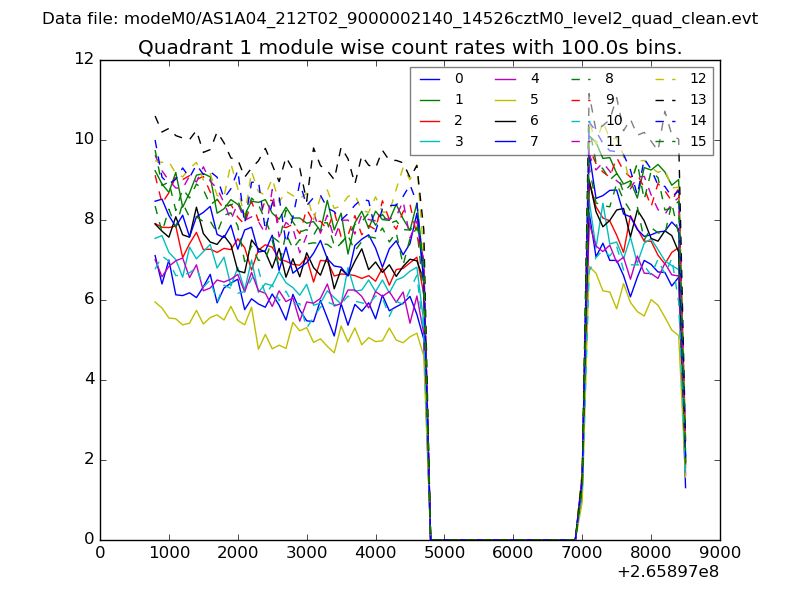
| Module-wise count rates for Quadrant A Data is divided into 100 sec bins |
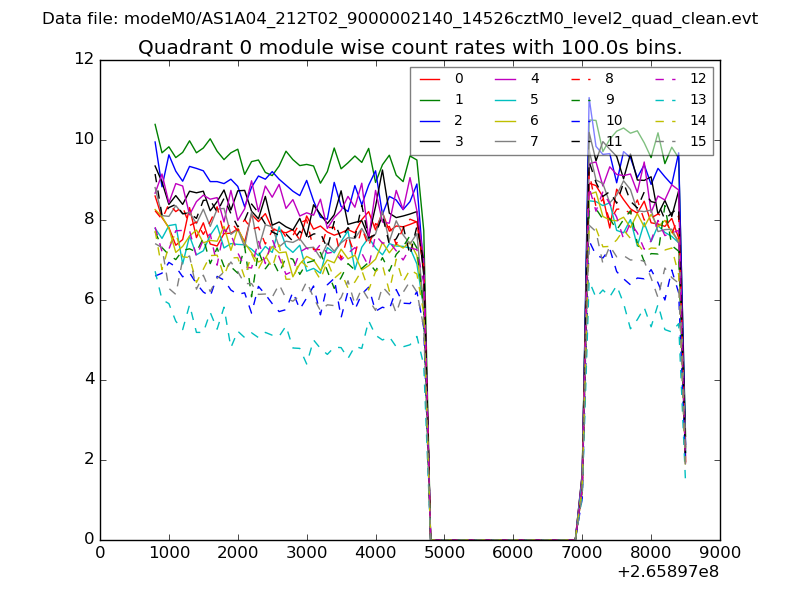 |
 |
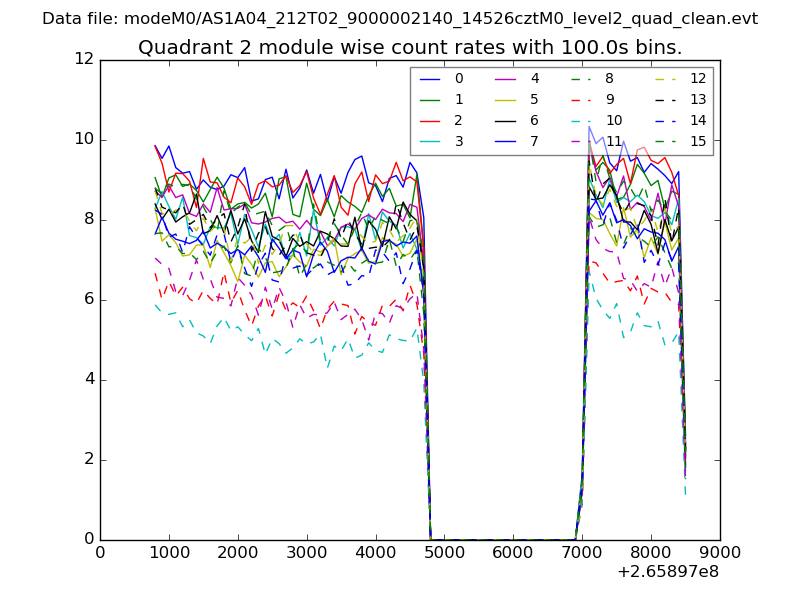
| Module-wise count rates for Quadrant B Data is divided into 100 sec bins |
 |
 |
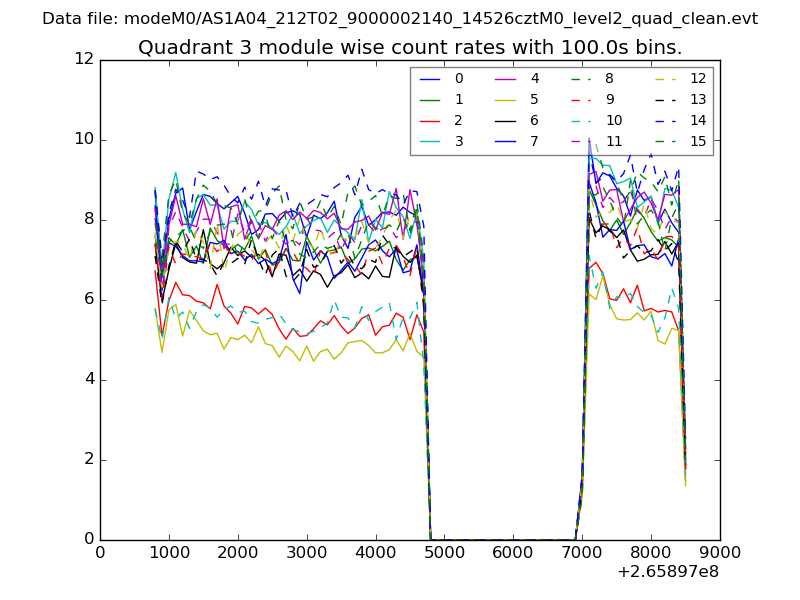
| Module-wise count rates for Quadrant C Data is divided into 100 sec bins |
 |
 |
| Module-wise count rates for Quadrant D Data is divided into 100 sec bins |
 |
 |
| Parameter | Plot |
|---|---|
| CZT HV Monitor | 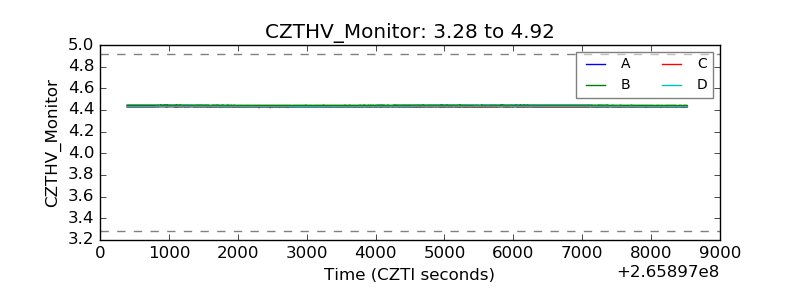 |
| D_VDD | 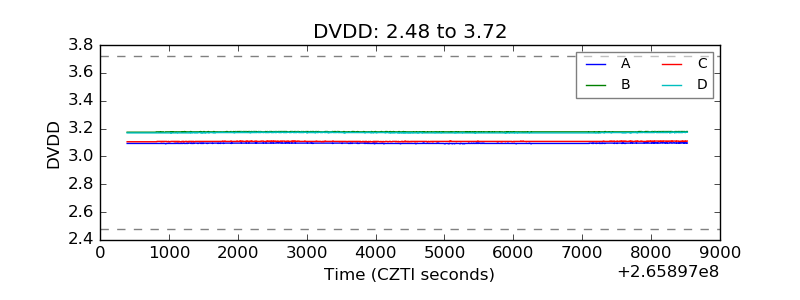 |
| Temperature 1 |  |
| Veto HV Monitor | 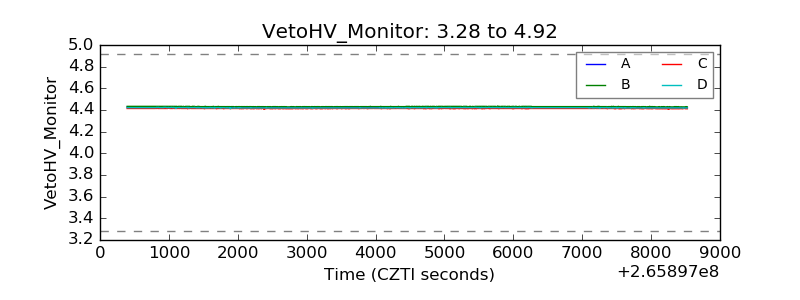 |
| Veto LLD | 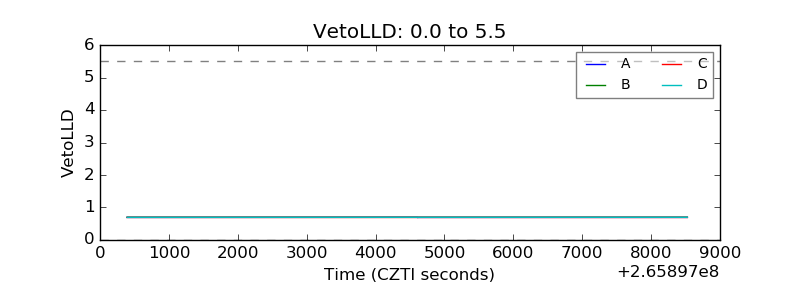 |
| Alpha Counter | 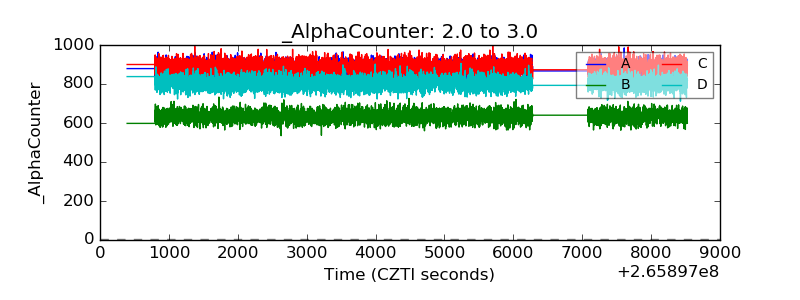 |
| _CPM_Rate | 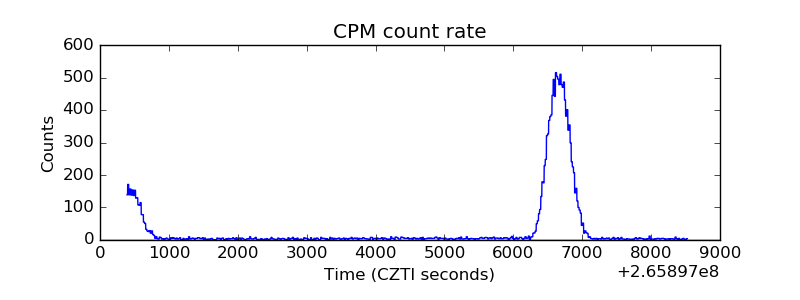 |
| CZT Counter |  |
| +2.5 Volts monitor |  |
| +5 Volts monitor | 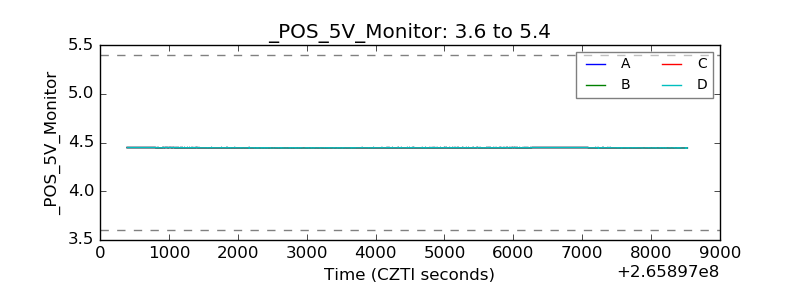 |
| _ROLL_ROT | 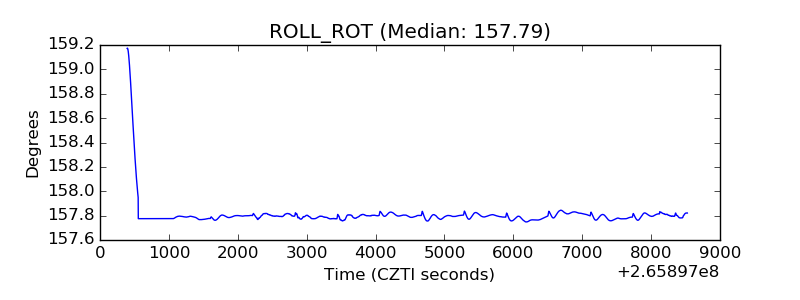 |
| _Roll_DEC | 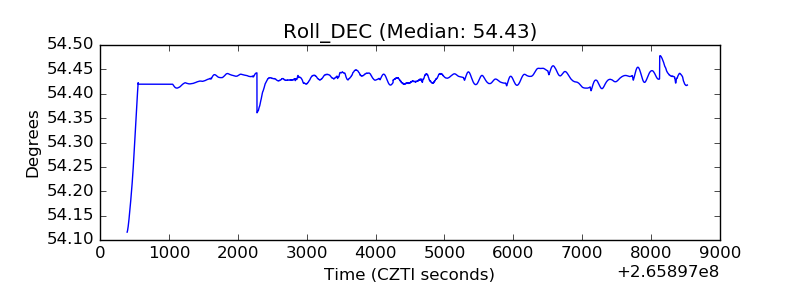 |
| _Roll_RA |  |
| Veto Counter | 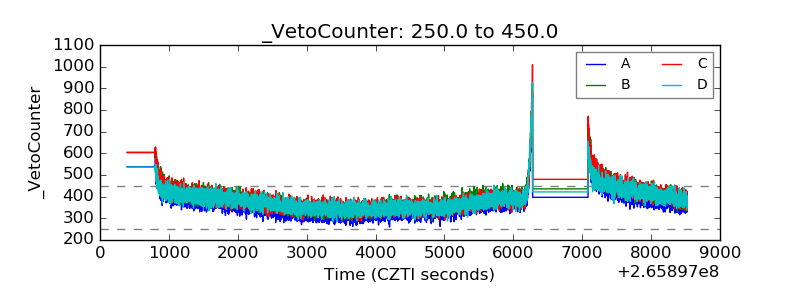 |