| Param | Original file | Final file |
|---|---|---|
| Filename | modeM0/AS1A04_212T02_9000002140_14527cztM0_level2.evt | modeM0/AS1A04_212T02_9000002140_14527cztM0_level2_quad_clean.evt |
| Size (bytes) | 200,007,360 | 50,241,600 |
| Size | 190.7 MB | 47.9 MB |
| Events in quadrant A | 1,479,130 | 334,352 |
| Events in quadrant B | 1,466,481 | 333,953 |
| Events in quadrant C | 1,463,430 | 332,252 |
| Events in quadrant D | 1,458,794 | 323,450 |
| Mode SS | |||
|---|---|---|---|
| Quadrant | BADHDUFLAG | Total packets | Discarded packets |
| A | 0 | 54 | 0 |
| B | 0 | 54 | 0 |
| C | 0 | 54 | 0 |
| D | 0 | 54 | 0 |
| Mode M0 | |||
|---|---|---|---|
| Quadrant | BADHDUFLAG | Total packets | Discarded packets |
| A | 0 | 6336 | 0 |
| B | 0 | 6183 | 0 |
| C | 0 | 6076 | 0 |
| D | 0 | 6199 | 0 |
| Quadrant | Total seconds | Saturated seconds | Saturation percentage |
|---|---|---|---|
| A | 2759 | 6 | 0.217470% |
| B | 2759 | 29 | 1.051105% |
| C | 2759 | 3 | 0.108735% |
| D | 2759 | 24 | 0.869880% |
Noise dominated data is calculated using 1-second bins in cleaned event files. If a bin has >2000 counts, and if more than 50% of those come from <1% of pixels, then it is considered to be noise-dominated and hence unusable.
| Quadrant | # 1 sec bins | Bins with >0 counts | Bins with >2000 counts | High rate bins dominated by noise | Noise dominated (total time) | Noise dominated (detector-on time) | Marked lightcurve |
|---|---|---|---|---|---|---|---|
| A | 2760 | 2760 | 0 | 0 | 0.00% | 0.00% | 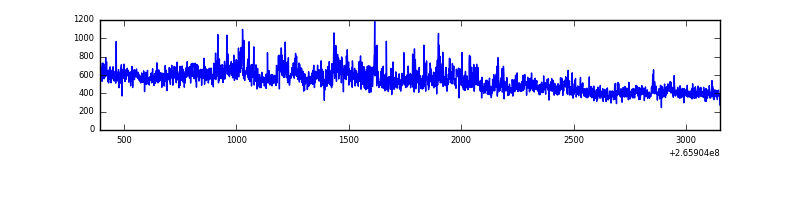 |
| B | 2760 | 2760 | 19 | 19 | 0.69% | 0.69% | 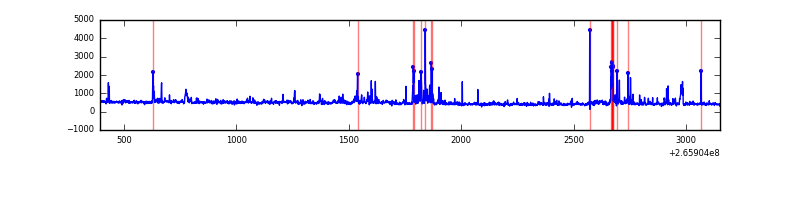 |
| C | 2760 | 2760 | 3 | 3 | 0.11% | 0.11% | 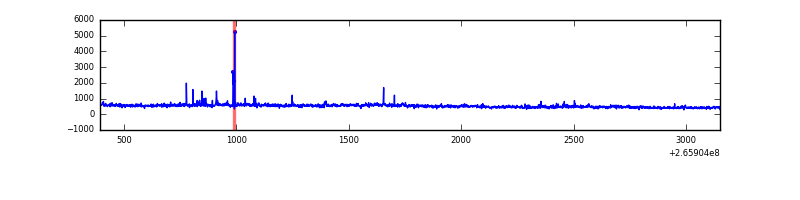 |
| D | 2760 | 2760 | 14 | 14 | 0.51% | 0.51% | 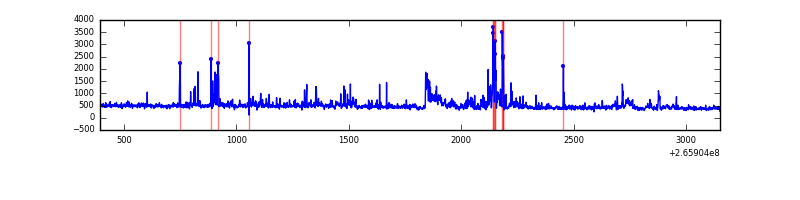 |
Top three noisy pixels from each quadrant. If the there are fewer than three noisy pixels in the level2.evt file, extra rows are filled as -1
| Pixel properties | Quadrant properties | ||||||
|---|---|---|---|---|---|---|---|
| Quadrant | DetID | PixID | Counts | Sigma | Mean | Median | Sigma |
| A | 8 | 15 | 249433 | 3984.91 | 307 | 301 | 62.5 |
| A | 0 | 23 | 19198 | 302.26 | 307 | 301 | 62.5 |
| A | 12 | 189 | 16636 | 261.28 | 307 | 301 | 62.5 |
| B | 0 | 228 | 74264 | 1256.95 | 306 | 298 | 58.8 |
| B | 0 | 245 | 45840 | 773.92 | 306 | 298 | 58.8 |
| B | 0 | 219 | 32557 | 548.2 | 306 | 298 | 58.8 |
| C | 3 | 233 | 249004 | 3527.36 | 301 | 302 | 70.5 |
| C | 0 | 207 | 37235 | 523.82 | 301 | 302 | 70.5 |
| C | 13 | 61 | 2146 | 26.15 | 301 | 302 | 70.5 |
| D | 2 | 136 | 94421 | 1159.27 | 300 | 293 | 81.2 |
| D | 12 | 110 | 72012 | 883.29 | 300 | 293 | 81.2 |
| D | 12 | 233 | 31166 | 380.23 | 300 | 293 | 81.2 |
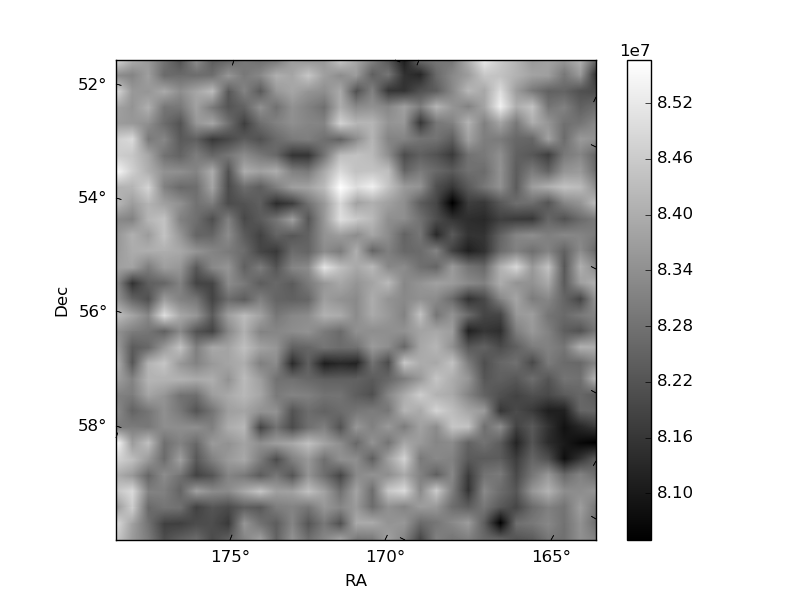
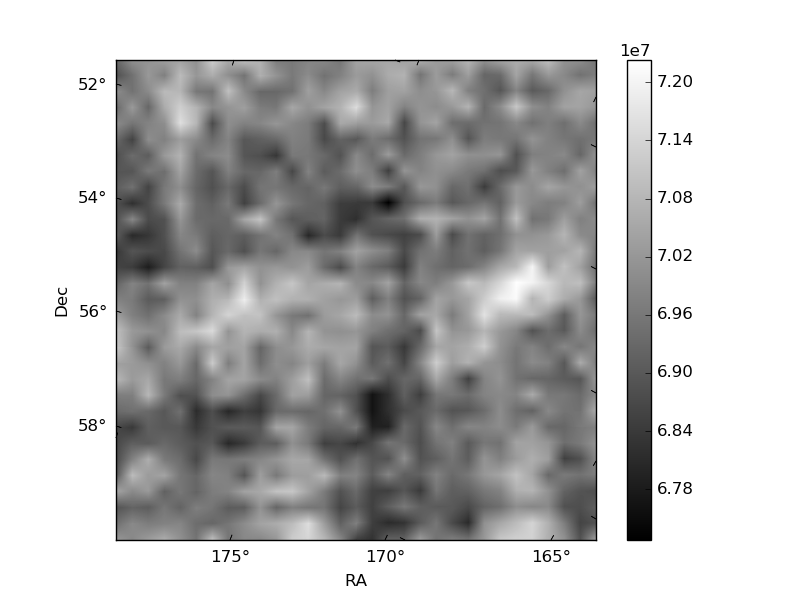
Histogram calculated using DETX and DETY for each event in the final _common_clean file
| Quadrant A | 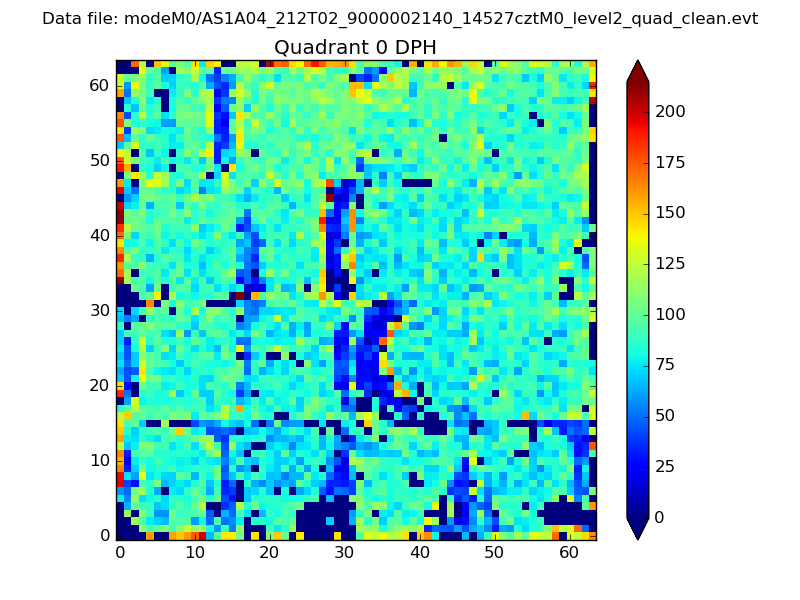 |
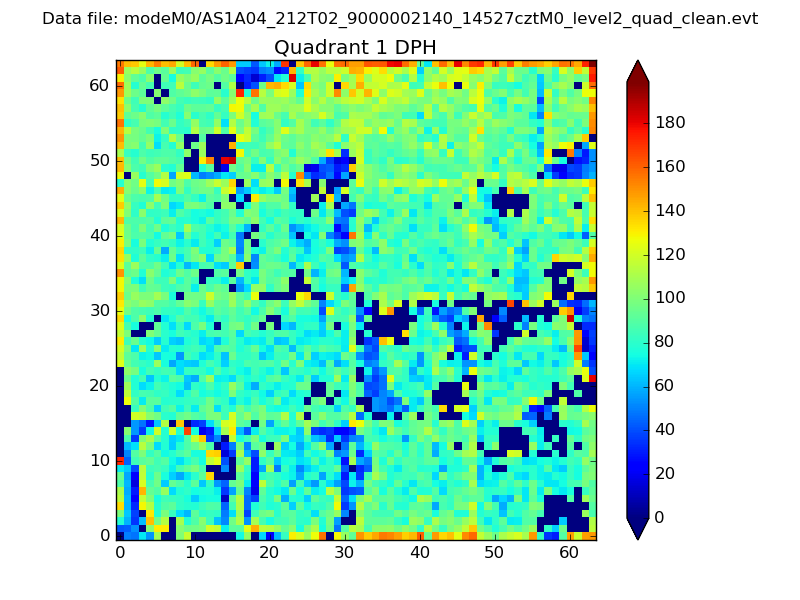 |
Quadrant B |
|---|---|---|---|
| Quadrant D | 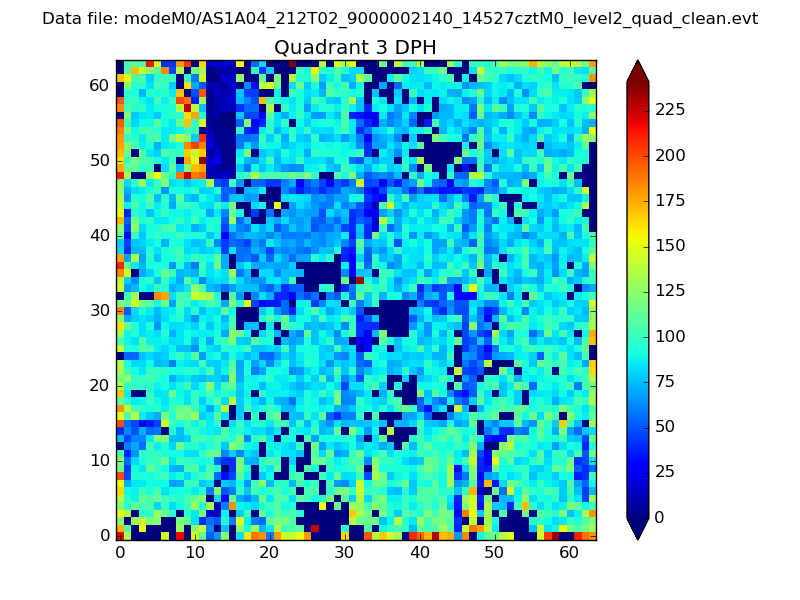 |
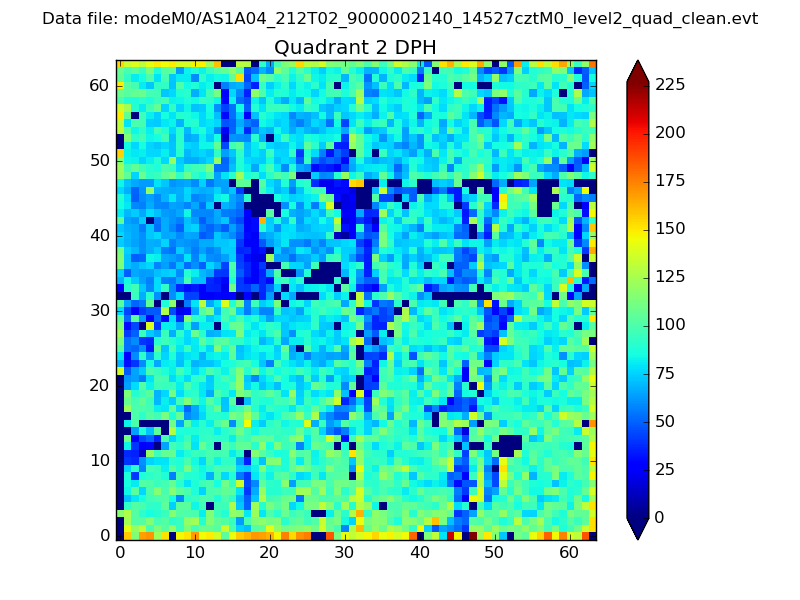 |
Quadrant C |
| Plot type | Count rate plots | Images |
|---|---|---|
| Comparison with Poisson distribution Blue bars denote a histogram of data divided into 1 sec bins. Red curve is a Poisson curve with rate = median count rate of data. |
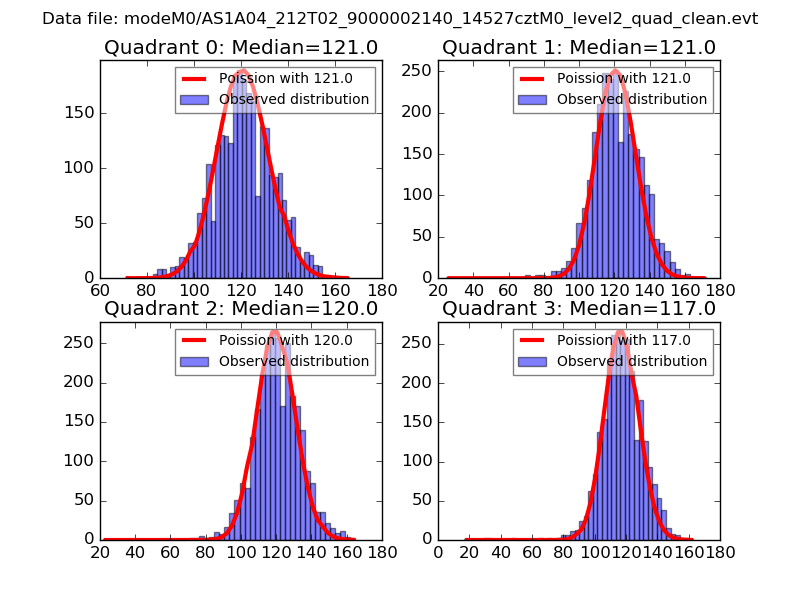 |
 |
| Quadrant-wise count rates Data is divided into 100 sec bins |
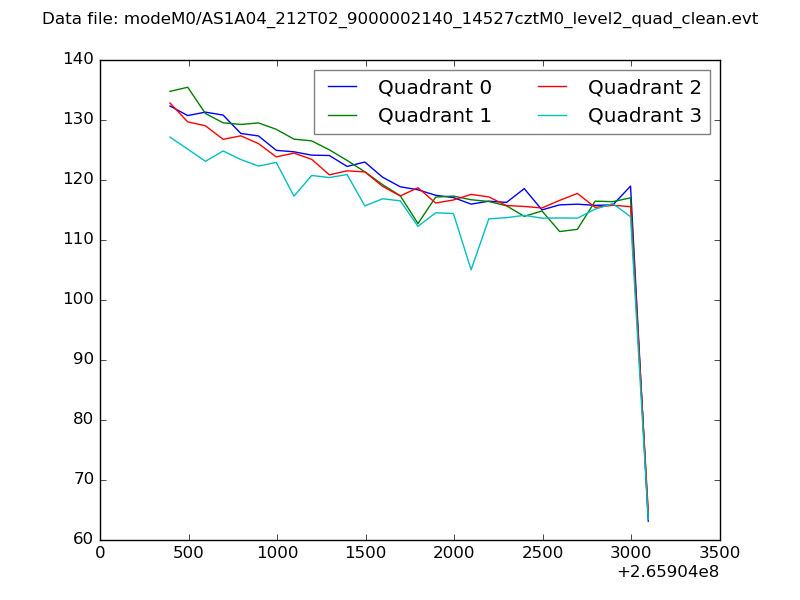 |
|
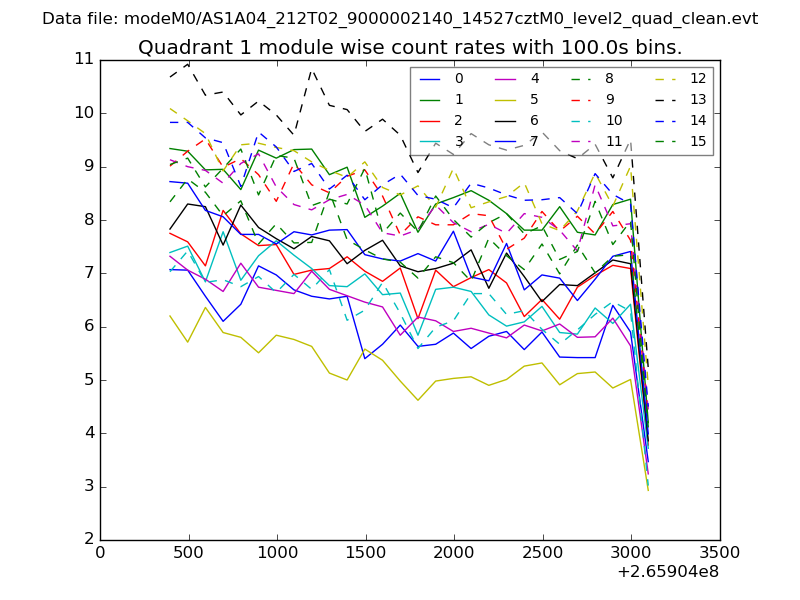
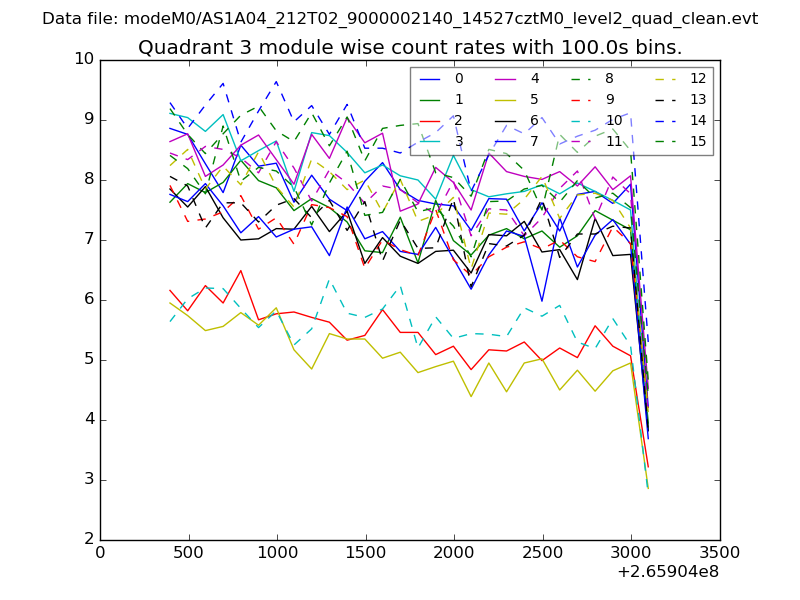
| Module-wise count rates for Quadrant A Data is divided into 100 sec bins |
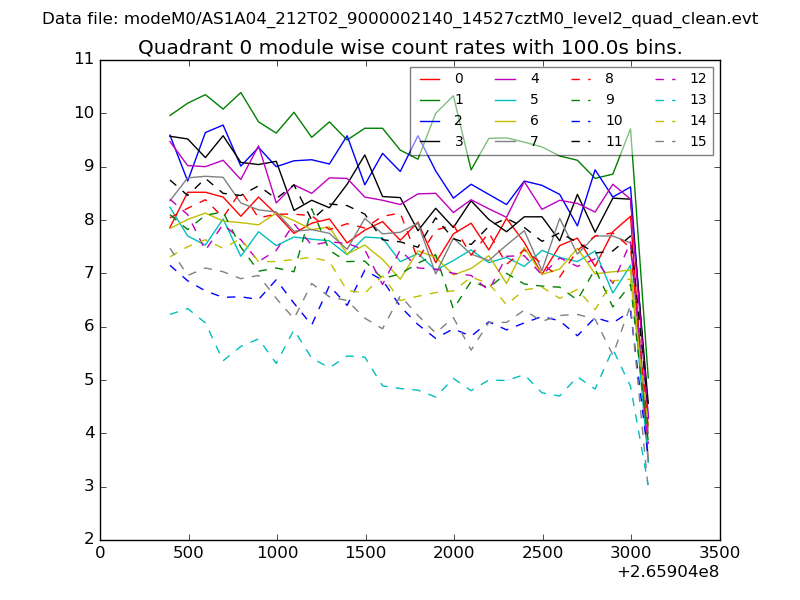 |
 |
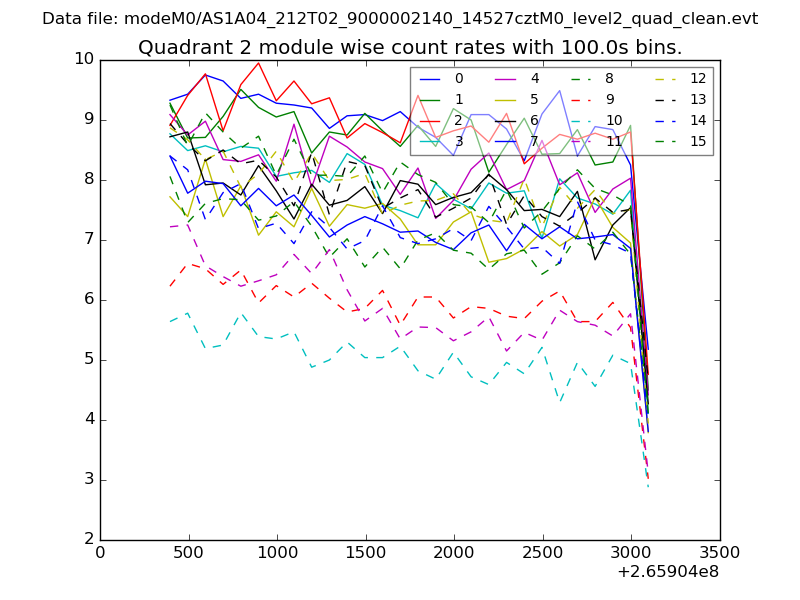
| Module-wise count rates for Quadrant B Data is divided into 100 sec bins |
 |
 |
| Module-wise count rates for Quadrant C Data is divided into 100 sec bins |
 |
 |
| Module-wise count rates for Quadrant D Data is divided into 100 sec bins |
 |
 |
| Parameter | Plot |
|---|---|
| CZT HV Monitor | 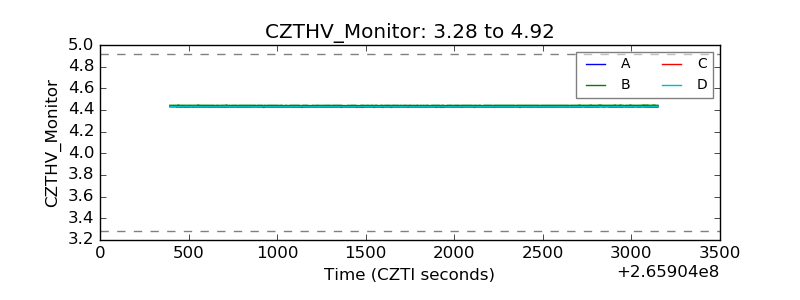 |
| D_VDD | 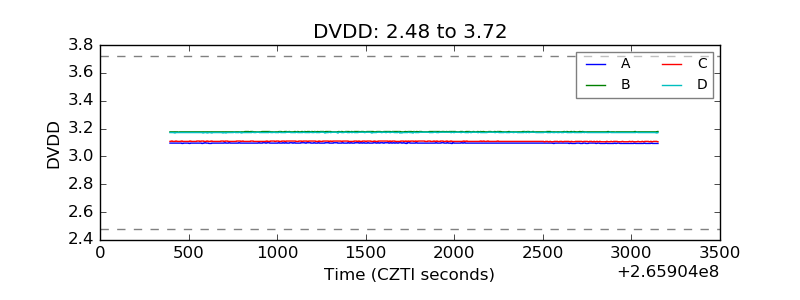 |
| Temperature 1 | 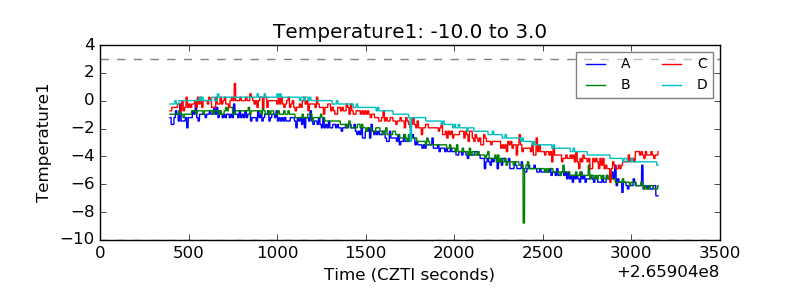 |
| Veto HV Monitor | 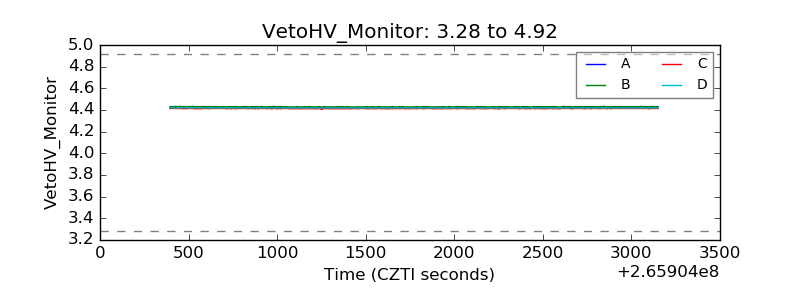 |
| Veto LLD | 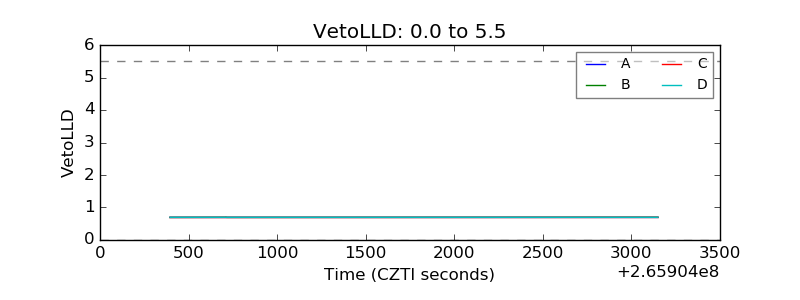 |
| Alpha Counter | 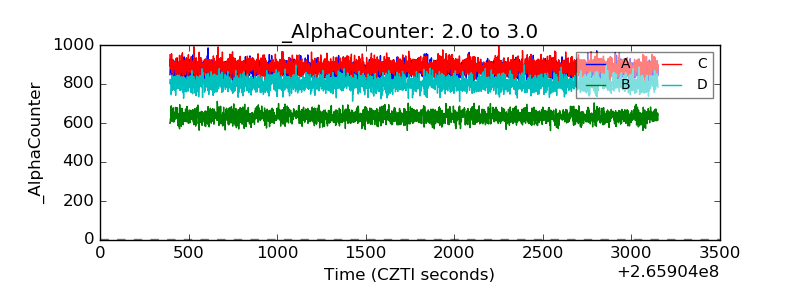 |
| _CPM_Rate | 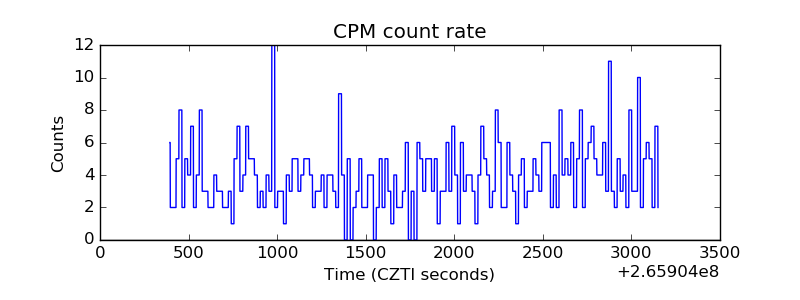 |
| CZT Counter |  |
| +2.5 Volts monitor |  |
| +5 Volts monitor |  |
| _ROLL_ROT | 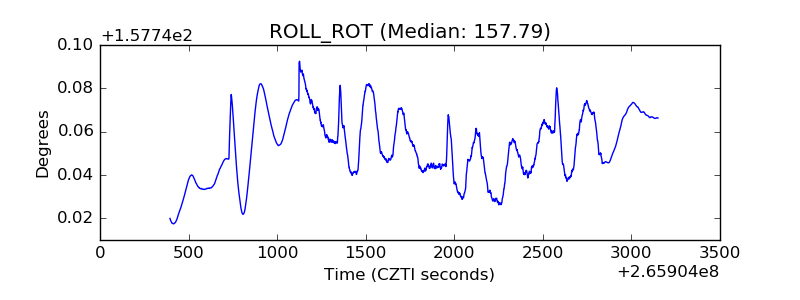 |
| _Roll_DEC | 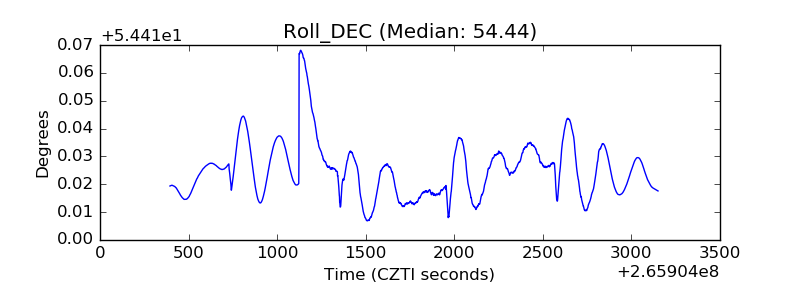 |
| _Roll_RA |  |
| Veto Counter | 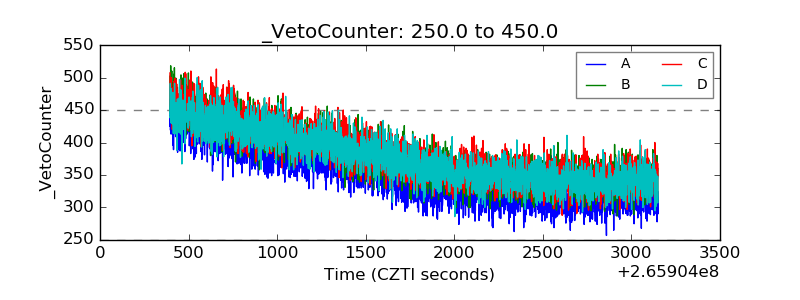 |