| Param | Original file | Final file |
|---|---|---|
| Filename | modeM0/AS1T02_049T01_9000002142cztM0_level2.fits | modeM0/AS1T02_049T01_9000002142cztM0_level2_quad_clean.evt |
| Size (bytes) | 618,687,360 | 751,086,720 |
| Size | 590.0 MB | 716.3 MB |
| Events in quadrant A | 3,702,294 | 4,748,133 |
| Events in quadrant B | 3,616,248 | 4,712,885 |
| Events in quadrant C | 3,711,894 | 4,575,090 |
| Events in quadrant D | 3,181,618 | 4,188,856 |
| Mode M0 | |||
|---|---|---|---|
| Quadrant | BADHDUFLAG | Total packets | Discarded packets |
| A | 0 | 160723 | 0 |
| B | 0 | 143353 | 0 |
| C | 0 | 142872 | 0 |
| D | 0 | 155954 | 0 |
| Mode M9 | |||
|---|---|---|---|
| Quadrant | BADHDUFLAG | Total packets | Discarded packets |
| A | 0 | 101 | 0 |
| B | 0 | 101 | 0 |
| C | 0 | 101 | 0 |
| D | 0 | 101 | 0 |
| Mode SS | |||
|---|---|---|---|
| Quadrant | BADHDUFLAG | Total packets | Discarded packets |
| A | 0 | 1350 | 0 |
| B | 0 | 1350 | 0 |
| C | 0 | 1350 | 0 |
| D | 0 | 1350 | 0 |
| Quadrant | Total seconds | Saturated seconds | Saturation percentage |
|---|---|---|---|
| A | 65945 | 1528 | 2.317082% |
| B | 65945 | 864 | 1.310183% |
| C | 65945 | 533 | 0.808249% |
| D | 65945 | 1512 | 2.292820% |
Noise dominated data is calculated using 1-second bins in cleaned event files. If a bin has >2000 counts, and if more than 50% of those come from <1% of pixels, then it is considered to be noise-dominated and hence unusable.
| Quadrant | # 1 sec bins | Bins with >0 counts | Bins with >2000 counts | High rate bins dominated by noise | Noise dominated (total time) | Noise dominated (detector-on time) | Marked lightcurve |
|---|---|---|---|---|---|---|---|
| A | 76380 | 65945 | 0 | 0 | 0.00% | 0.00% |  |
| B | 76380 | 65944 | 0 | 0 | 0.00% | 0.00% |  |
| C | 76380 | 65945 | 0 | 0 | 0.00% | 0.00% |  |
| D | 76380 | 65940 | 0 | 0 | 0.00% | 0.00% |  |
Top three noisy pixels from each quadrant. If the there are fewer than three noisy pixels in the level2.evt file, extra rows are filled as -1
| Pixel properties | Quadrant properties | ||||||
|---|---|---|---|---|---|---|---|
| Quadrant | DetID | PixID | Counts | Sigma | Mean | Median | Sigma |
| A | 0 | 29 | 3597 | 11.24 | 963 | 904 | 239.5 |
| A | 7 | 110 | 2928 | 8.45 | 963 | 904 | 239.5 |
| A | 0 | 30 | 2776 | 7.82 | 963 | 904 | 239.5 |
| B | 2 | 9 | 3143 | 12.05 | 955 | 914 | 185.0 |
| B | 5 | 128 | 2399 | 8.03 | 955 | 914 | 185.0 |
| B | 2 | 8 | 2389 | 7.97 | 955 | 914 | 185.0 |
| C | 12 | 241 | 2642 | 6.86 | 981 | 918 | 251.3 |
| C | 2 | 191 | 2538 | 6.45 | 981 | 918 | 251.3 |
| C | 3 | 126 | 2503 | 6.31 | 981 | 918 | 251.3 |
| D | 6 | 231 | 2338 | 6.16 | 909 | 826 | 245.5 |
| D | 10 | 189 | 2277 | 5.91 | 909 | 826 | 245.5 |
| D | 7 | 3 | 2271 | 5.89 | 909 | 826 | 245.5 |
Histogram calculated using DETX and DETY for each event in the final _common_clean file
| Quadrant A | 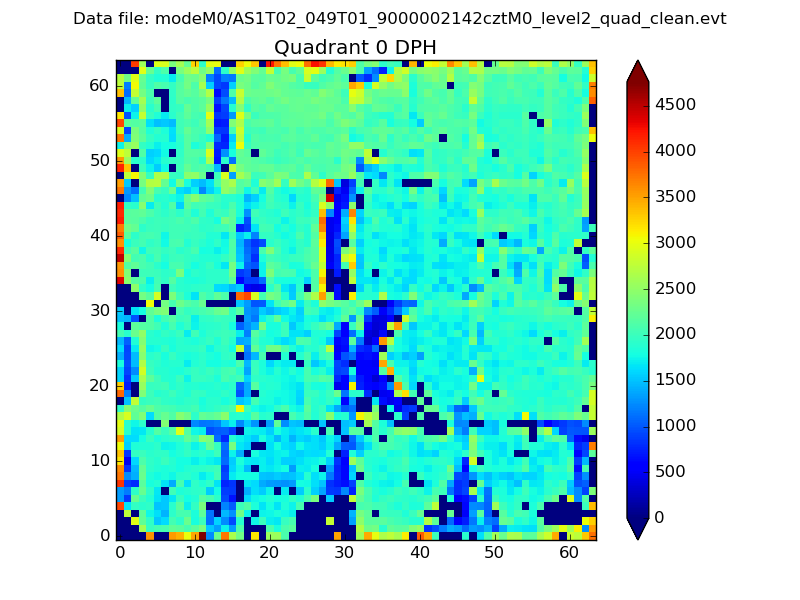 |
 |
Quadrant B |
|---|---|---|---|
| Quadrant D |  |
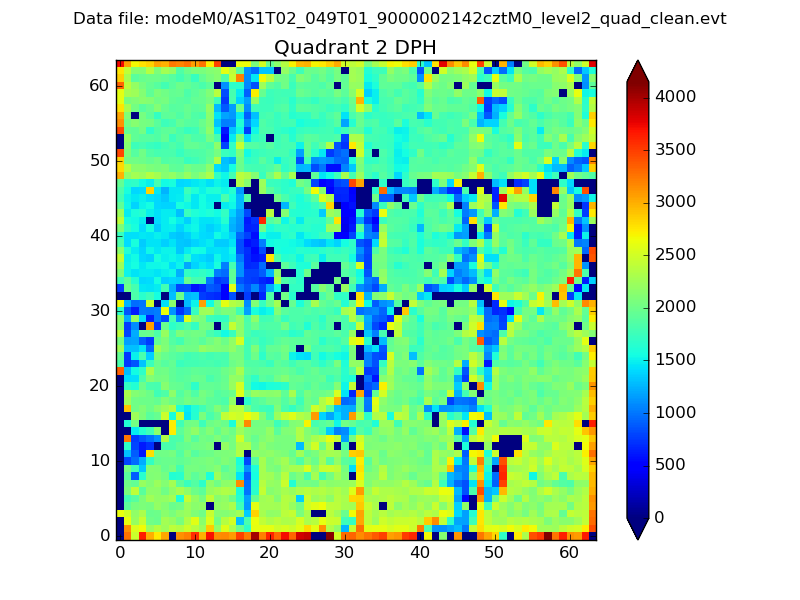 |
Quadrant C |
| Plot type | Count rate plots | Images |
|---|---|---|
| Comparison with Poisson distribution Blue bars denote a histogram of data divided into 1 sec bins. Red curve is a Poisson curve with rate = median count rate of data. |
 |
 |
| Quadrant-wise count rates Data is divided into 100 sec bins |
 |
|
| Module-wise count rates for Quadrant A Data is divided into 100 sec bins |
 |
 |
| Module-wise count rates for Quadrant B Data is divided into 100 sec bins |
 |
 |
| Module-wise count rates for Quadrant C Data is divided into 100 sec bins |
 |
 |
| Module-wise count rates for Quadrant D Data is divided into 100 sec bins |
 |
 |
| Parameter | Plot |
|---|---|
| CZT HV Monitor |  |
| D_VDD |  |
| Temperature 1 |  |
| Veto HV Monitor |  |
| Veto LLD |  |
| Alpha Counter |  |
| _CPM_Rate |  |
| CZT Counter |  |
| +2.5 Volts monitor |  |
| +5 Volts monitor |  |
| _ROLL_ROT |  |
| _Roll_DEC |  |
| _Roll_RA |  |
| Veto Counter |  |