| Param | Original file | Final file |
|---|---|---|
| Filename | modeM0/AS1T02_049T01_9000002142_14527cztM0_level2.evt | modeM0/AS1T02_049T01_9000002142_14527cztM0_level2_quad_clean.evt |
| Size (bytes) | 253,742,400 | 58,924,800 |
| Size | 242.0 MB | 56.2 MB |
| Events in quadrant A | 2,495,143 | 386,889 |
| Events in quadrant B | 1,619,523 | 396,886 |
| Events in quadrant C | 1,642,563 | 396,739 |
| Events in quadrant D | 1,713,540 | 381,521 |
| Mode M0 | |||
|---|---|---|---|
| Quadrant | BADHDUFLAG | Total packets | Discarded packets |
| A | 0 | 9608 | 2 |
| B | 0 | 6819 | 1 |
| C | 0 | 6910 | 1 |
| D | 0 | 7294 | 1 |
| Mode M9 | |||
|---|---|---|---|
| Quadrant | BADHDUFLAG | Total packets | Discarded packets |
| A | 0 | 9 | 0 |
| B | 0 | 9 | 0 |
| C | 0 | 9 | 0 |
| D | 0 | 9 | 0 |
| Mode SS | |||
|---|---|---|---|
| Quadrant | BADHDUFLAG | Total packets | Discarded packets |
| A | 0 | 66 | 0 |
| B | 0 | 66 | 0 |
| C | 0 | 66 | 0 |
| D | 0 | 66 | 0 |
| Quadrant | Total seconds | Saturated seconds | Saturation percentage |
|---|---|---|---|
| A | 3119 | 98 | 3.142033% |
| B | 3119 | 41 | 1.314524% |
| C | 3119 | 29 | 0.929785% |
| D | 3119 | 84 | 2.693171% |
Noise dominated data is calculated using 1-second bins in cleaned event files. If a bin has >2000 counts, and if more than 50% of those come from <1% of pixels, then it is considered to be noise-dominated and hence unusable.
| Quadrant | # 1 sec bins | Bins with >0 counts | Bins with >2000 counts | High rate bins dominated by noise | Noise dominated (total time) | Noise dominated (detector-on time) | Marked lightcurve |
|---|---|---|---|---|---|---|---|
| A | 4095 | 3121 | 19 | 19 | 0.46% | 0.61% | 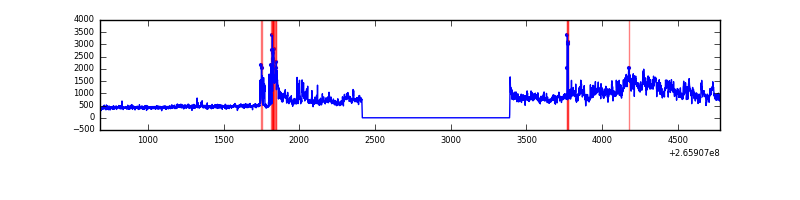 |
| B | 4095 | 3121 | 1 | 1 | 0.02% | 0.03% | 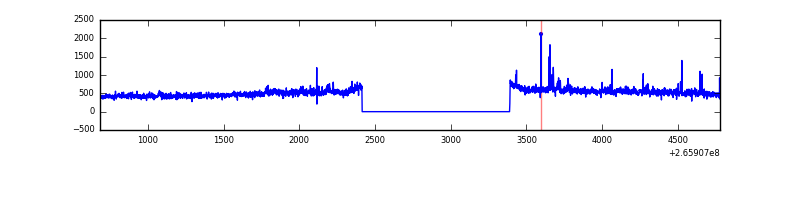 |
| C | 4095 | 3121 | 0 | 0 | 0.00% | 0.00% | 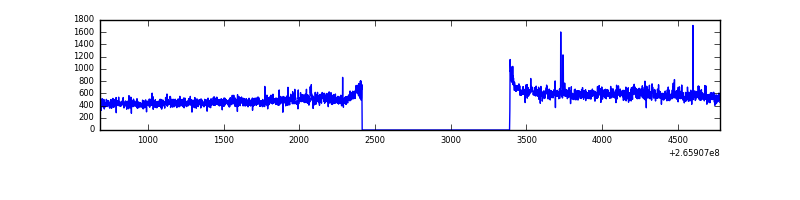 |
| D | 4095 | 3121 | 33 | 33 | 0.81% | 1.06% | 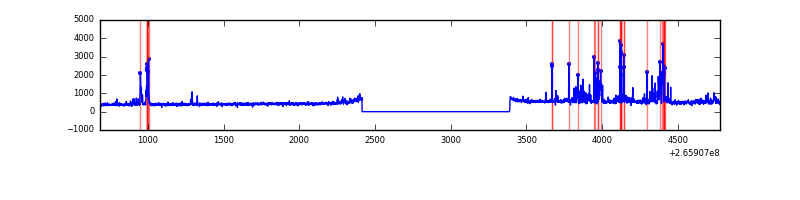 |
Top three noisy pixels from each quadrant. If the there are fewer than three noisy pixels in the level2.evt file, extra rows are filled as -1
| Pixel properties | Quadrant properties | ||||||
|---|---|---|---|---|---|---|---|
| Quadrant | DetID | PixID | Counts | Sigma | Mean | Median | Sigma |
| A | 8 | 15 | 955544 | 12176.38 | 384 | 375 | 78.4 |
| A | 12 | 189 | 39208 | 495.04 | 384 | 375 | 78.4 |
| A | 15 | 69 | 14027 | 174.03 | 384 | 375 | 78.4 |
| B | 4 | 48 | 40458 | 534.98 | 387 | 376 | 74.9 |
| B | 3 | 209 | 13055 | 169.23 | 387 | 376 | 74.9 |
| B | 0 | 182 | 11571 | 149.42 | 387 | 376 | 74.9 |
| C | 3 | 233 | 171059 | 1961.68 | 375 | 377 | 87.0 |
| C | 0 | 207 | 5680 | 60.95 | 375 | 377 | 87.0 |
| C | 13 | 61 | 2830 | 28.19 | 375 | 377 | 87.0 |
| D | 12 | 233 | 95437 | 966.54 | 372 | 363 | 98.4 |
| D | 2 | 136 | 76662 | 775.67 | 372 | 363 | 98.4 |
| D | 10 | 199 | 56829 | 574.05 | 372 | 363 | 98.4 |
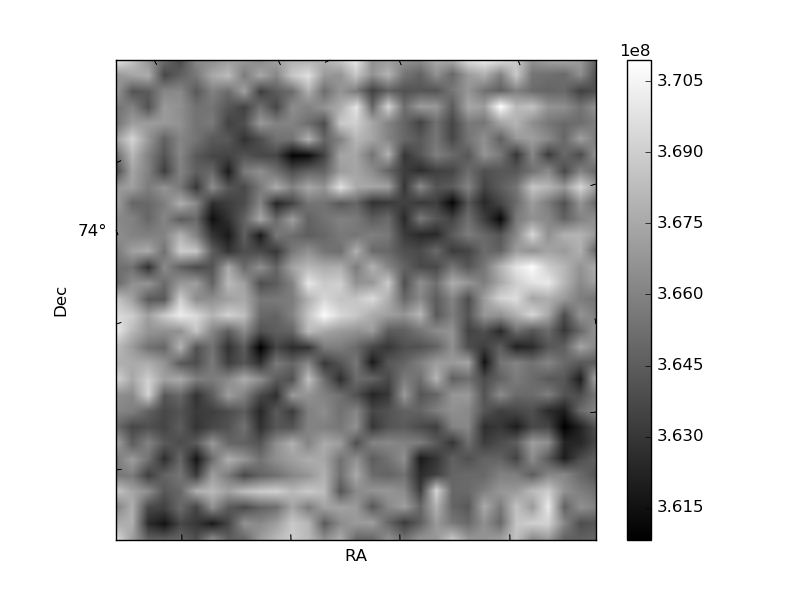
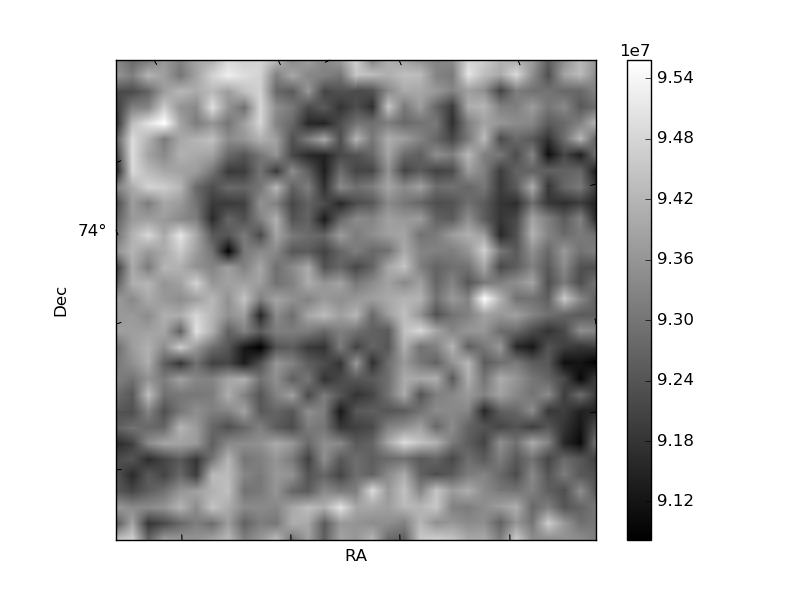
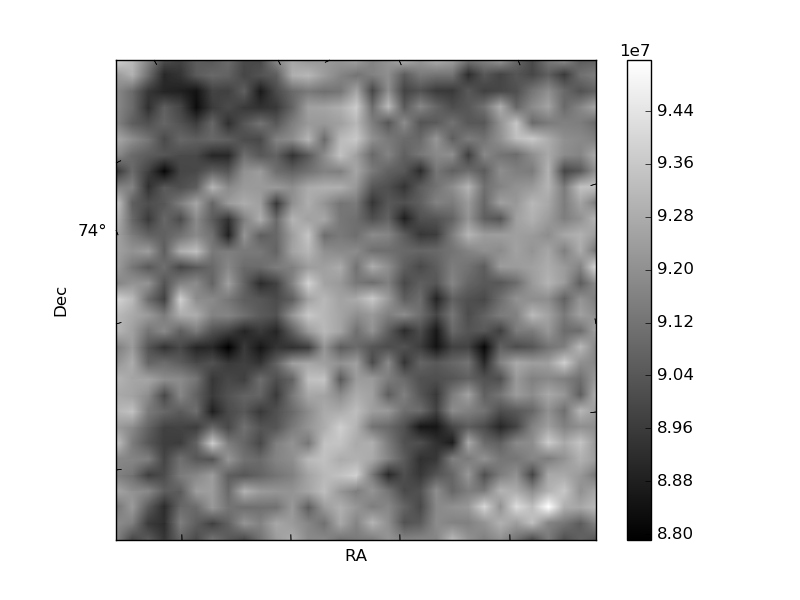
Histogram calculated using DETX and DETY for each event in the final _common_clean file
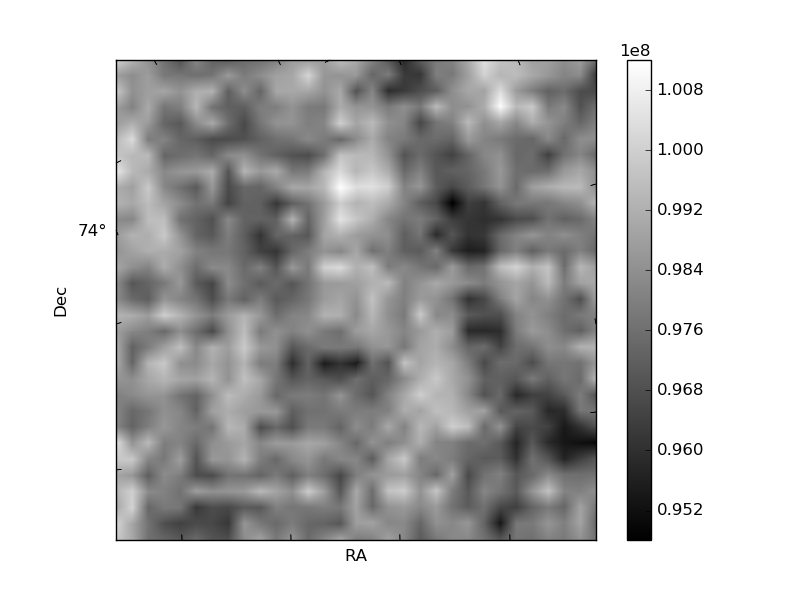
| Quadrant A | 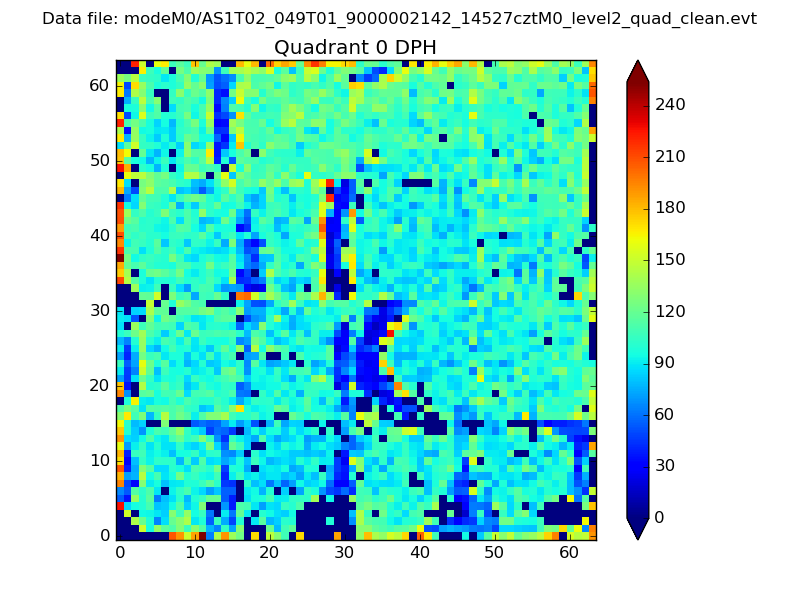 |
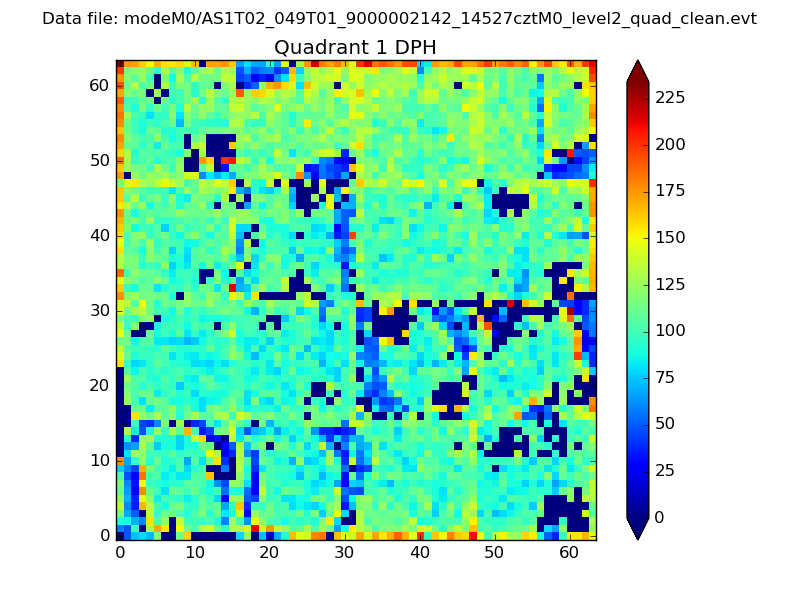 |
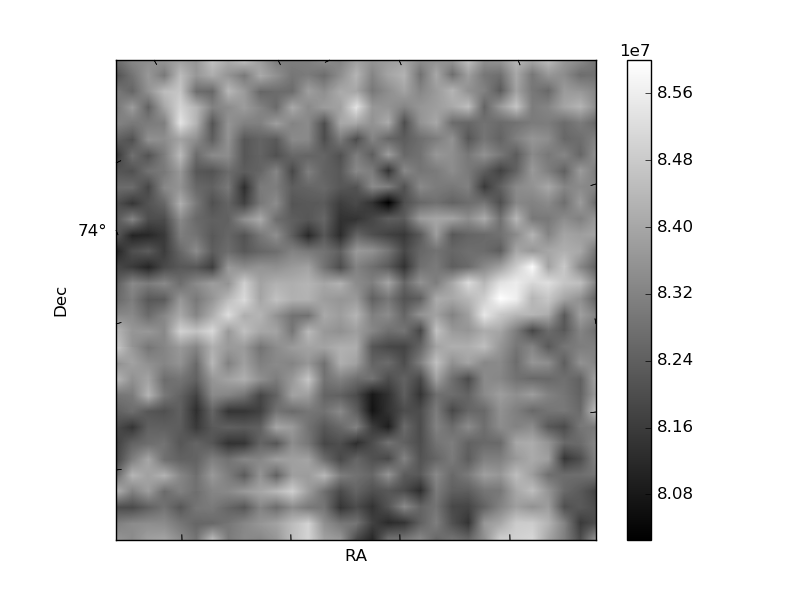
Quadrant B |
|---|---|---|---|
| Quadrant D | 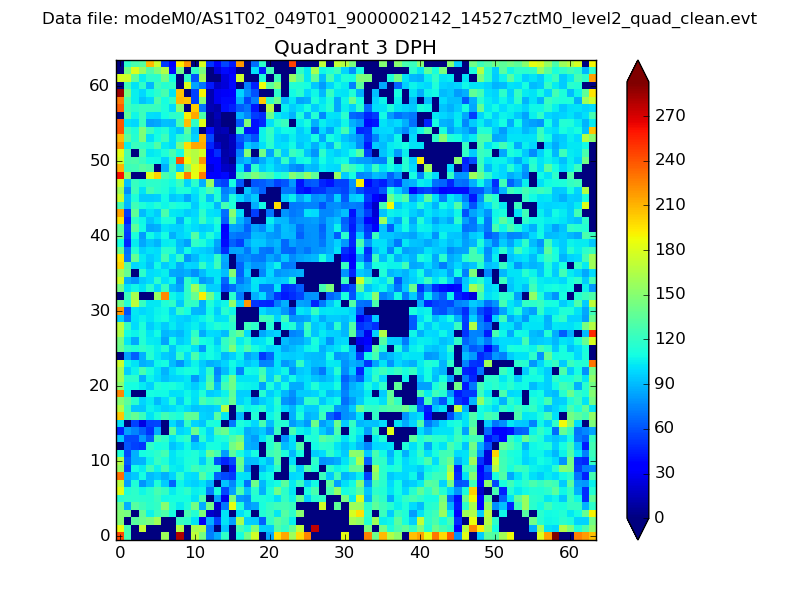 |
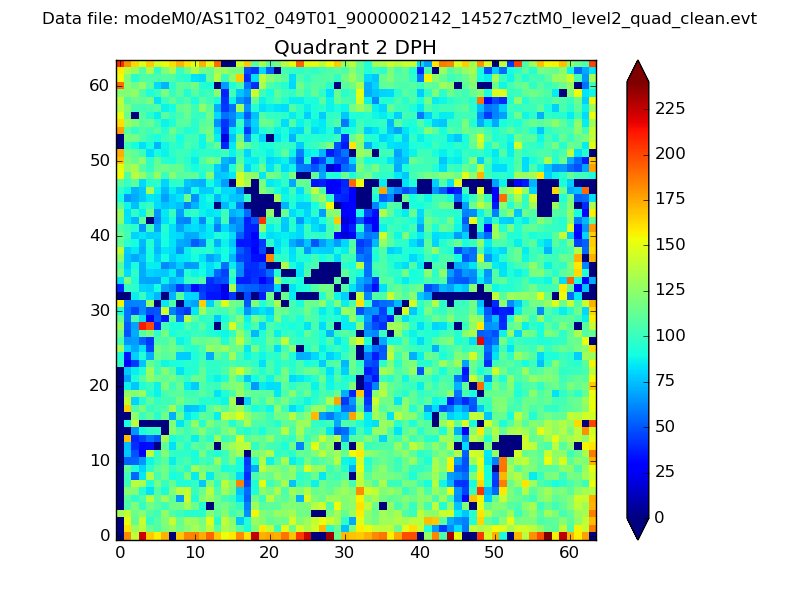 |
Quadrant C |
| Plot type | Count rate plots | Images |
|---|---|---|
| Comparison with Poisson distribution Blue bars denote a histogram of data divided into 1 sec bins. Red curve is a Poisson curve with rate = median count rate of data. |
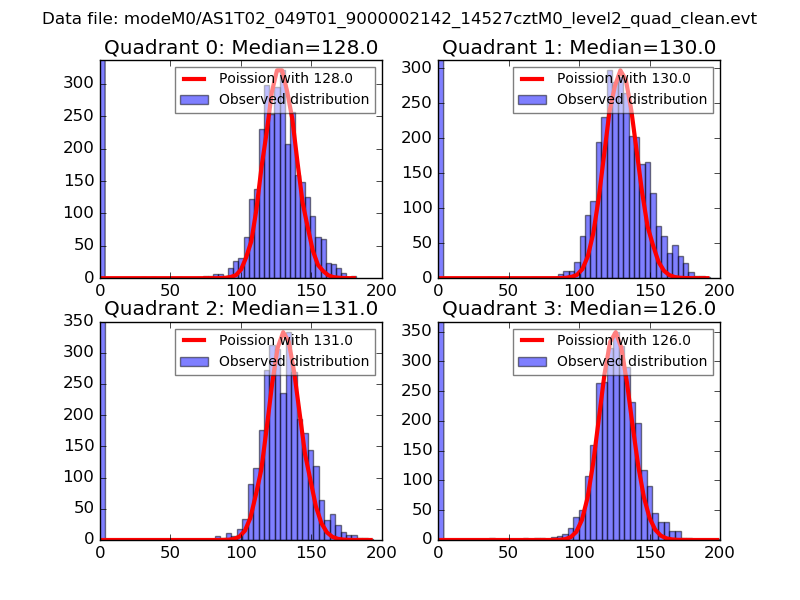 |
 |
| Quadrant-wise count rates Data is divided into 100 sec bins |
 |
|
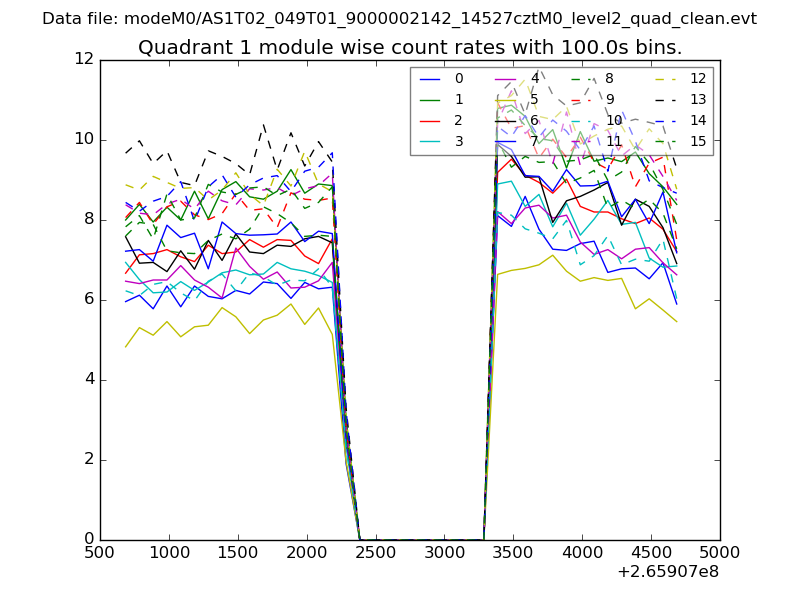
| Module-wise count rates for Quadrant A Data is divided into 100 sec bins |
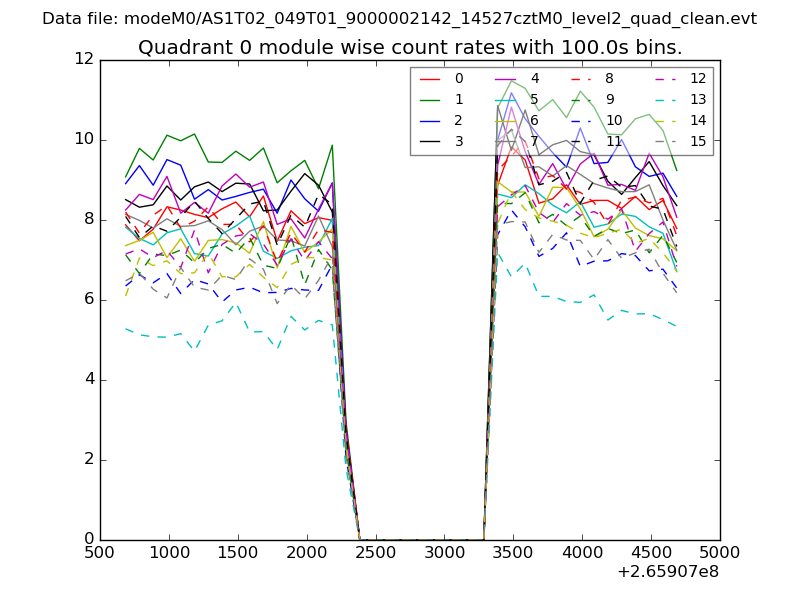 |
 |
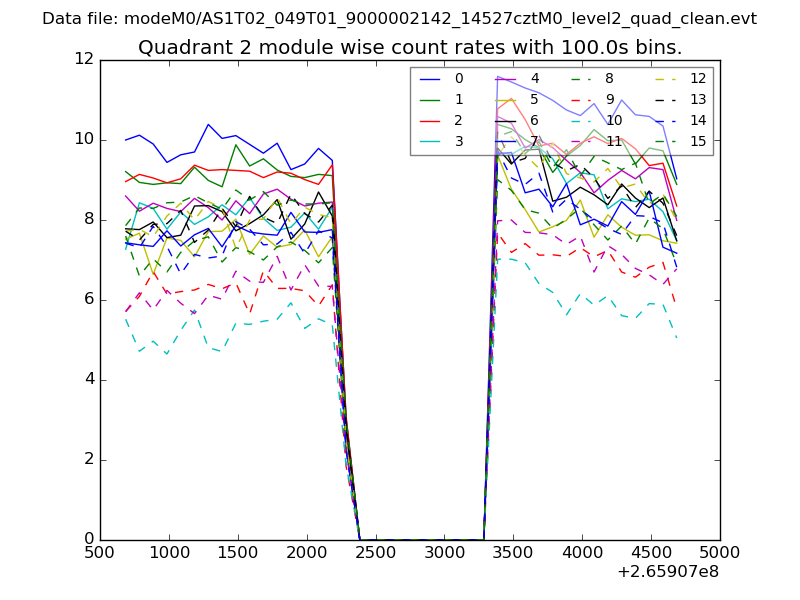
| Module-wise count rates for Quadrant B Data is divided into 100 sec bins |
 |
 |
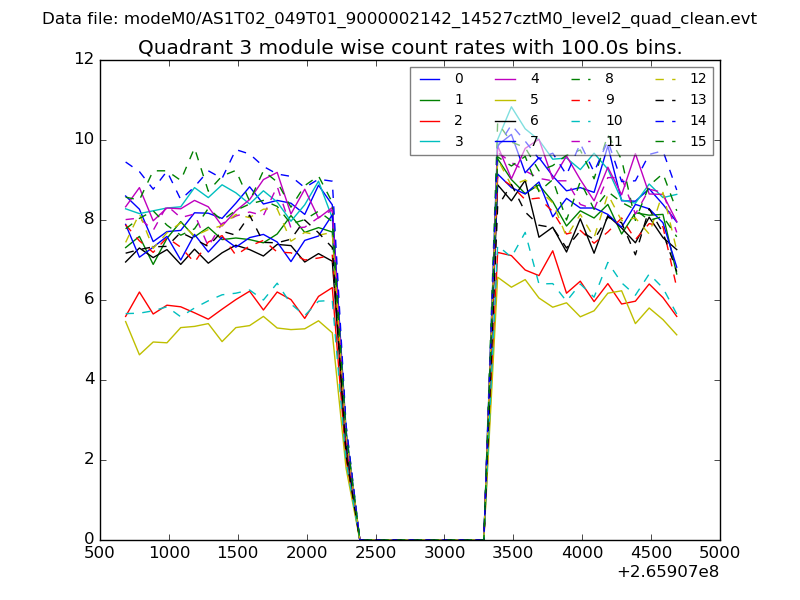
| Module-wise count rates for Quadrant C Data is divided into 100 sec bins |
 |
 |
| Module-wise count rates for Quadrant D Data is divided into 100 sec bins |
 |
 |
| Parameter | Plot |
|---|---|
| CZT HV Monitor | 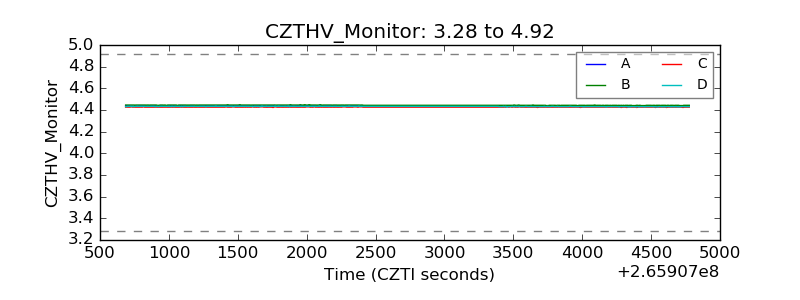 |
| D_VDD | 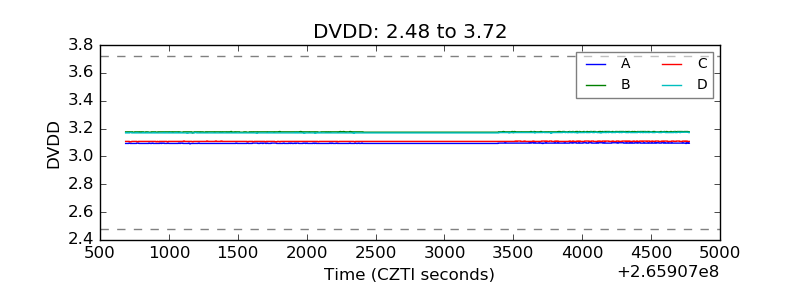 |
| Temperature 1 | 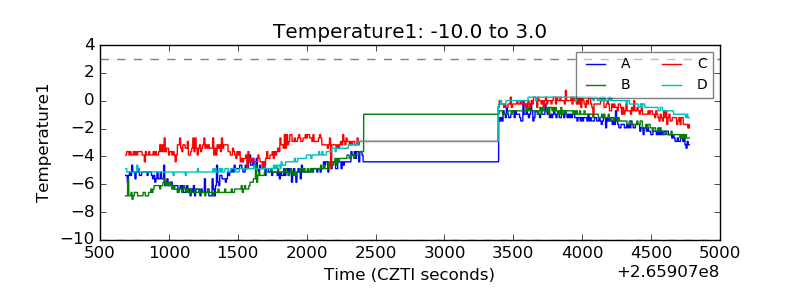 |
| Veto HV Monitor | 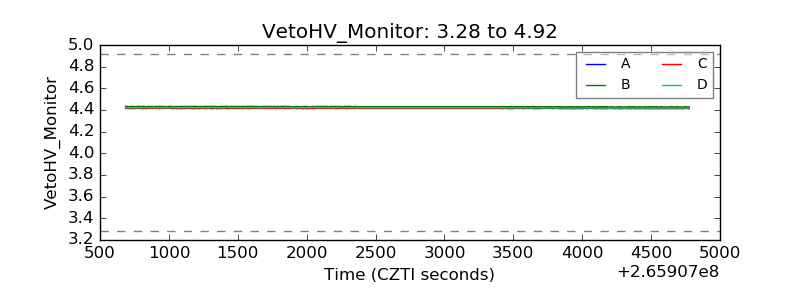 |
| Veto LLD | 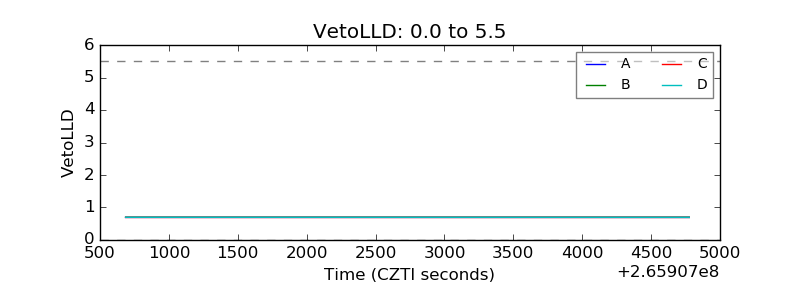 |
| Alpha Counter |  |
| _CPM_Rate | 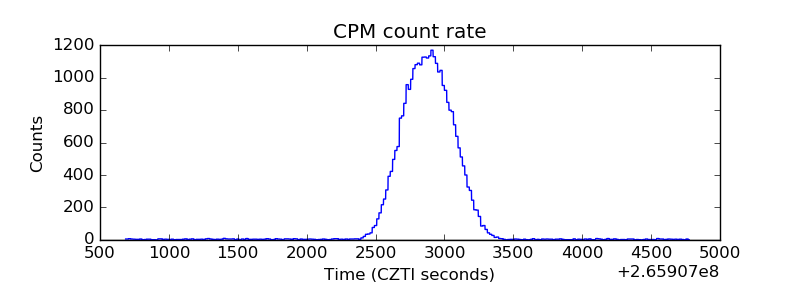 |
| CZT Counter | 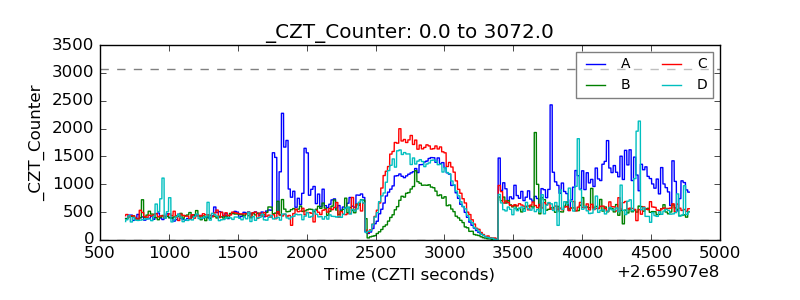 |
| +2.5 Volts monitor |  |
| +5 Volts monitor |  |
| _ROLL_ROT | 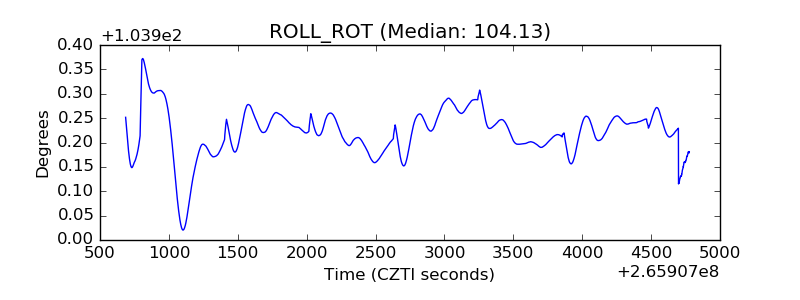 |
| _Roll_DEC |  |
| _Roll_RA | 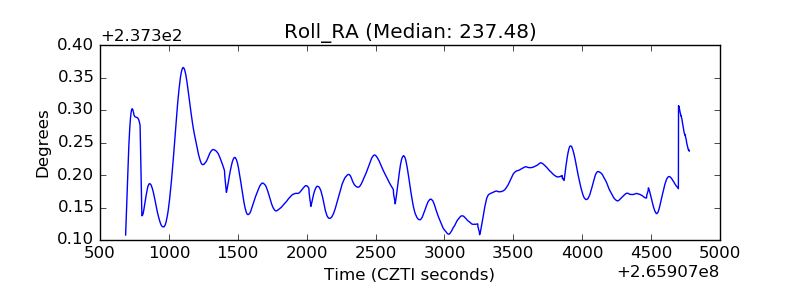 |
| Veto Counter | 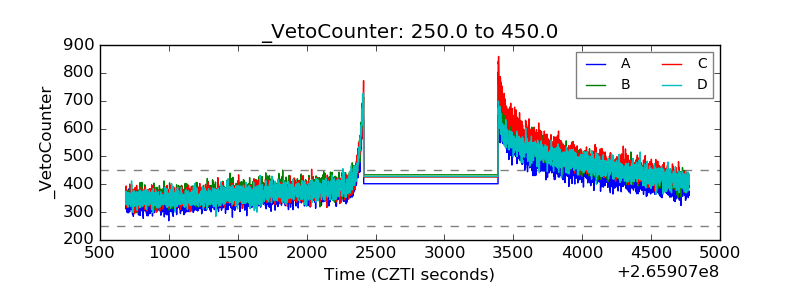 |