| Param | Original file | Final file |
|---|---|---|
| Filename | modeM0/AS1T02_049T01_9000002142_14528cztM0_level2.evt | modeM0/AS1T02_049T01_9000002142_14528cztM0_level2_quad_clean.evt |
| Size (bytes) | 591,065,280 | 119,738,880 |
| Size | 563.7 MB | 114.2 MB |
| Events in quadrant A | 6,213,464 | 778,263 |
| Events in quadrant B | 3,303,359 | 810,527 |
| Events in quadrant C | 3,513,990 | 812,775 |
| Events in quadrant D | 4,431,051 | 772,515 |
| Mode M0 | |||
|---|---|---|---|
| Quadrant | BADHDUFLAG | Total packets | Discarded packets |
| A | 0 | 23008 | 2 |
| B | 0 | 14189 | 1 |
| C | 0 | 14774 | 1 |
| D | 0 | 17693 | 1 |
| Mode M9 | |||
|---|---|---|---|
| Quadrant | BADHDUFLAG | Total packets | Discarded packets |
| A | 0 | 11 | 0 |
| B | 0 | 11 | 0 |
| C | 0 | 11 | 0 |
| D | 0 | 11 | 0 |
| Mode SS | |||
|---|---|---|---|
| Quadrant | BADHDUFLAG | Total packets | Discarded packets |
| A | 0 | 132 | 0 |
| B | 0 | 132 | 0 |
| C | 0 | 132 | 0 |
| D | 0 | 132 | 0 |
| Quadrant | Total seconds | Saturated seconds | Saturation percentage |
|---|---|---|---|
| A | 6483 | 337 | 5.198211% |
| B | 6483 | 48 | 0.740398% |
| C | 6483 | 38 | 0.586148% |
| D | 6483 | 322 | 4.966836% |
Noise dominated data is calculated using 1-second bins in cleaned event files. If a bin has >2000 counts, and if more than 50% of those come from <1% of pixels, then it is considered to be noise-dominated and hence unusable.
| Quadrant | # 1 sec bins | Bins with >0 counts | Bins with >2000 counts | High rate bins dominated by noise | Noise dominated (total time) | Noise dominated (detector-on time) | Marked lightcurve |
|---|---|---|---|---|---|---|---|
| A | 7604 | 6485 | 117 | 117 | 1.54% | 1.80% | 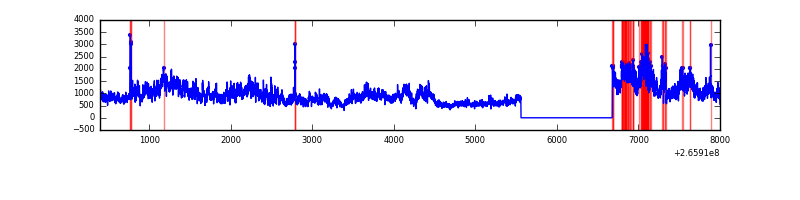 |
| B | 7604 | 6485 | 8 | 8 | 0.11% | 0.12% | 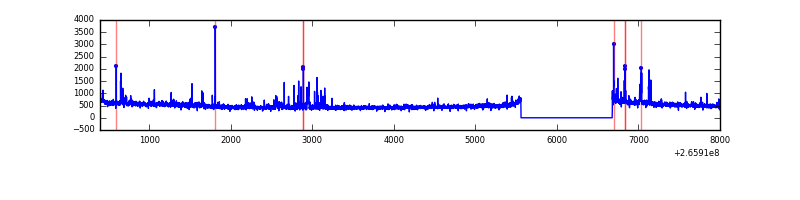 |
| C | 7604 | 6485 | 2 | 2 | 0.03% | 0.03% | 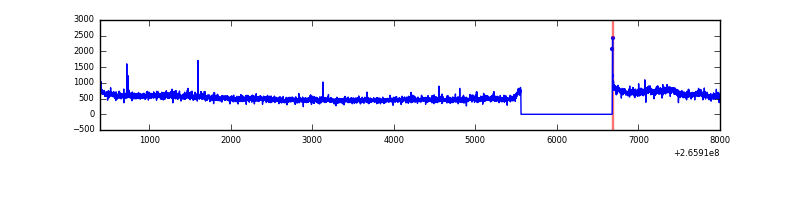 |
| D | 7604 | 6485 | 253 | 253 | 3.33% | 3.90% | 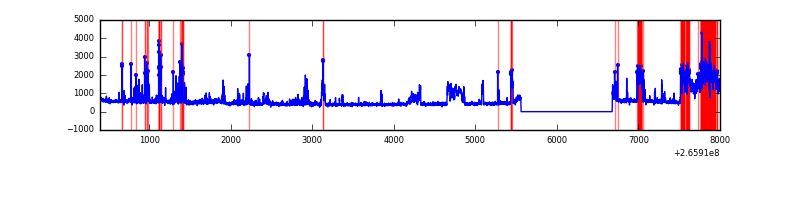 |
Top three noisy pixels from each quadrant. If the there are fewer than three noisy pixels in the level2.evt file, extra rows are filled as -1
| Pixel properties | Quadrant properties | ||||||
|---|---|---|---|---|---|---|---|
| Quadrant | DetID | PixID | Counts | Sigma | Mean | Median | Sigma |
| A | 8 | 15 | 3166411 | 20556.95 | 771 | 755 | 154.0 |
| A | 12 | 189 | 43074 | 274.81 | 771 | 755 | 154.0 |
| A | 15 | 69 | 22014 | 138.05 | 771 | 755 | 154.0 |
| B | 0 | 182 | 53920 | 366.29 | 785 | 767 | 145.1 |
| B | 0 | 189 | 37233 | 251.3 | 785 | 767 | 145.1 |
| B | 4 | 142 | 28730 | 192.7 | 785 | 767 | 145.1 |
| C | 3 | 233 | 489648 | 2770.45 | 772 | 776 | 176.5 |
| C | 0 | 207 | 11535 | 60.97 | 772 | 776 | 176.5 |
| C | 13 | 61 | 5548 | 27.04 | 772 | 776 | 176.5 |
| D | 12 | 110 | 1099137 | 5551.06 | 759 | 741 | 197.9 |
| D | 12 | 233 | 108221 | 543.18 | 759 | 741 | 197.9 |
| D | 2 | 136 | 101471 | 509.07 | 759 | 741 | 197.9 |
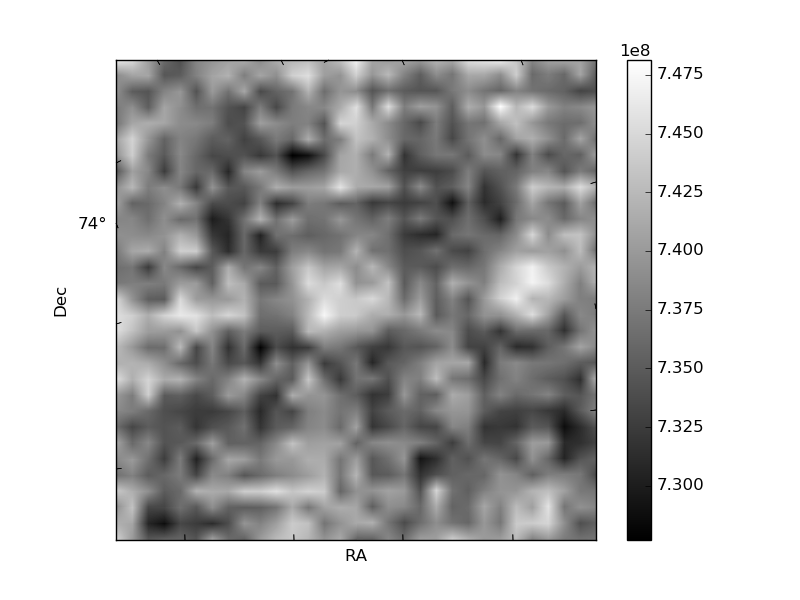
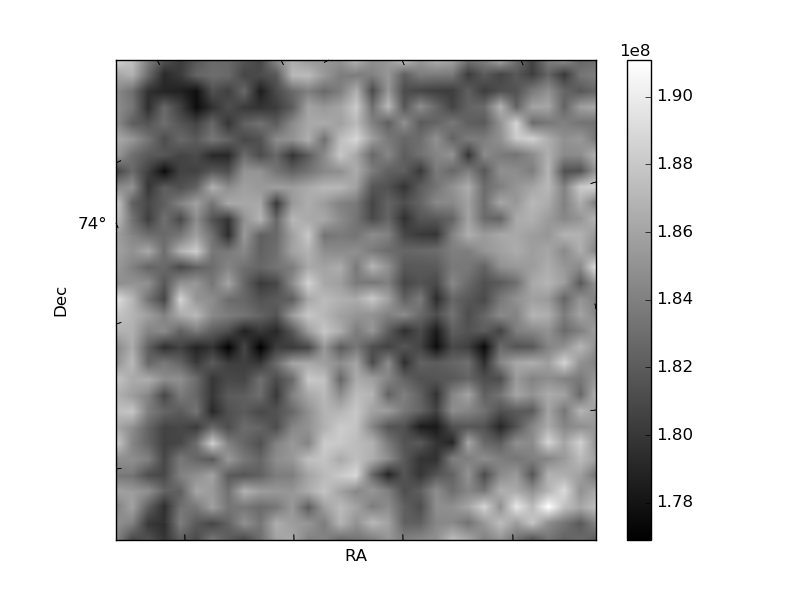
Histogram calculated using DETX and DETY for each event in the final _common_clean file
| Quadrant A | 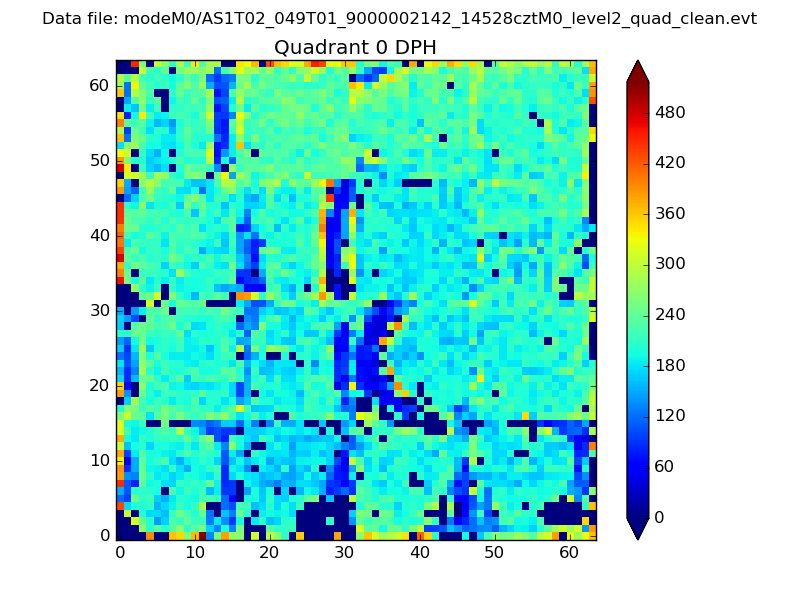 |
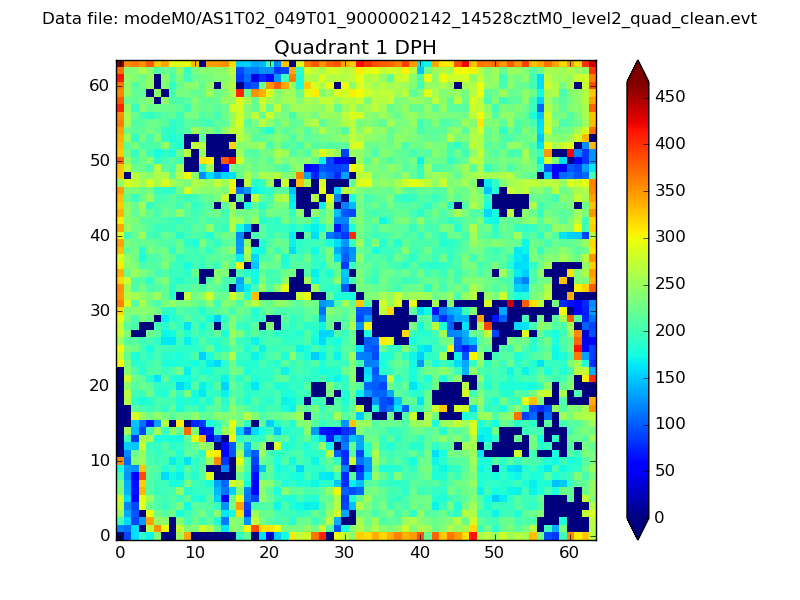 |
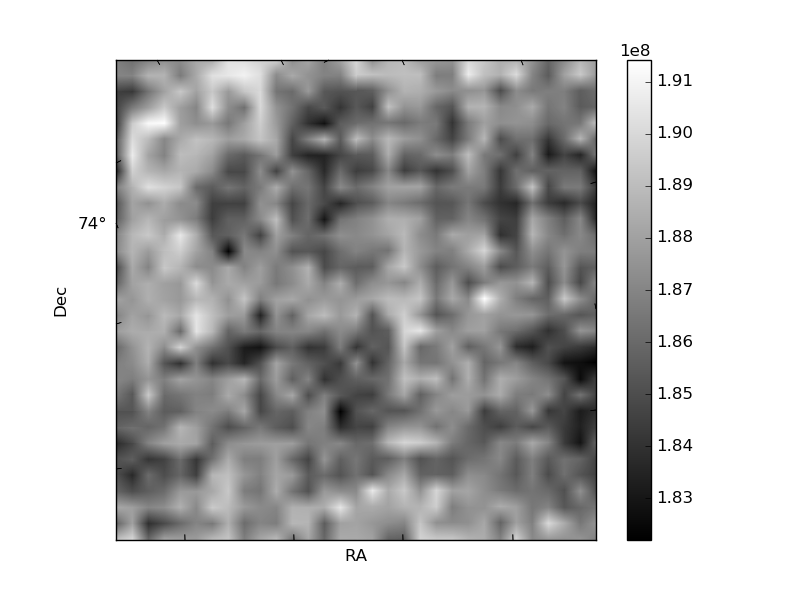
Quadrant B |
|---|---|---|---|
| Quadrant D | 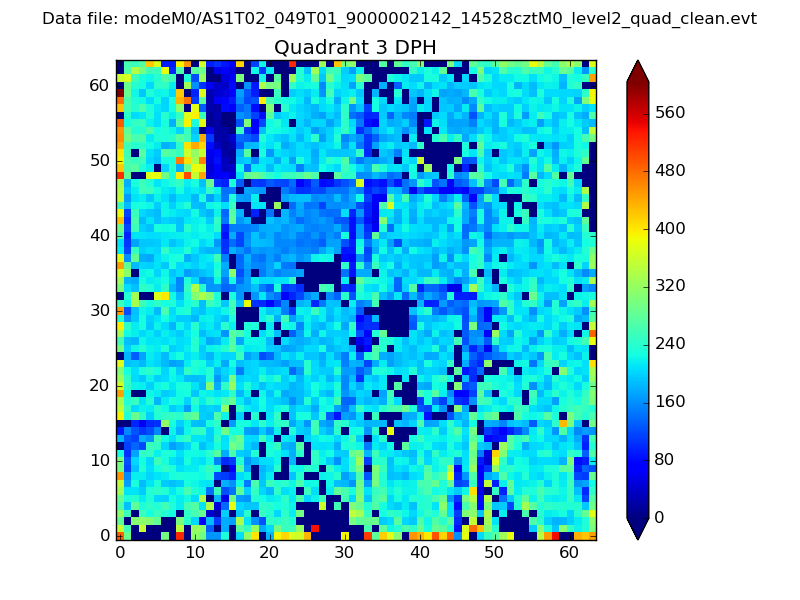 |
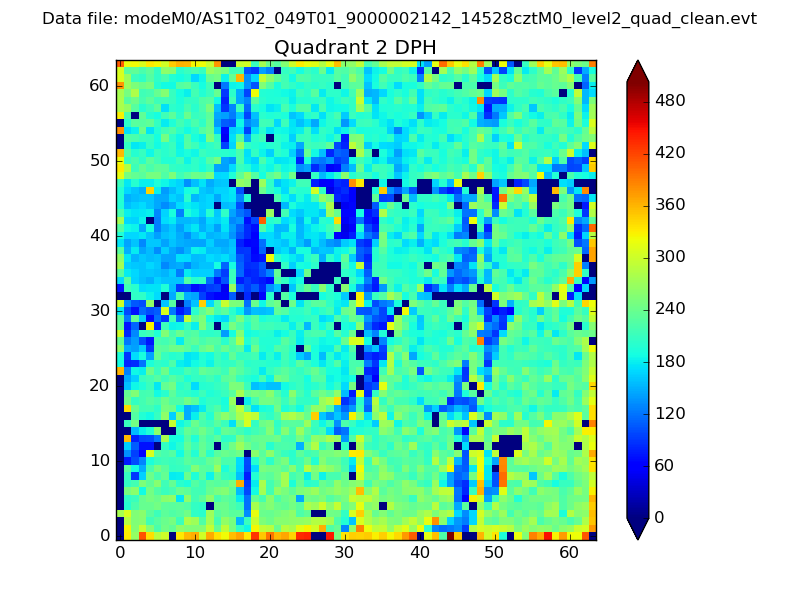 |
Quadrant C |
| Plot type | Count rate plots | Images |
|---|---|---|
| Comparison with Poisson distribution Blue bars denote a histogram of data divided into 1 sec bins. Red curve is a Poisson curve with rate = median count rate of data. |
 |
 |
| Quadrant-wise count rates Data is divided into 100 sec bins |
 |
|
| Module-wise count rates for Quadrant A Data is divided into 100 sec bins |
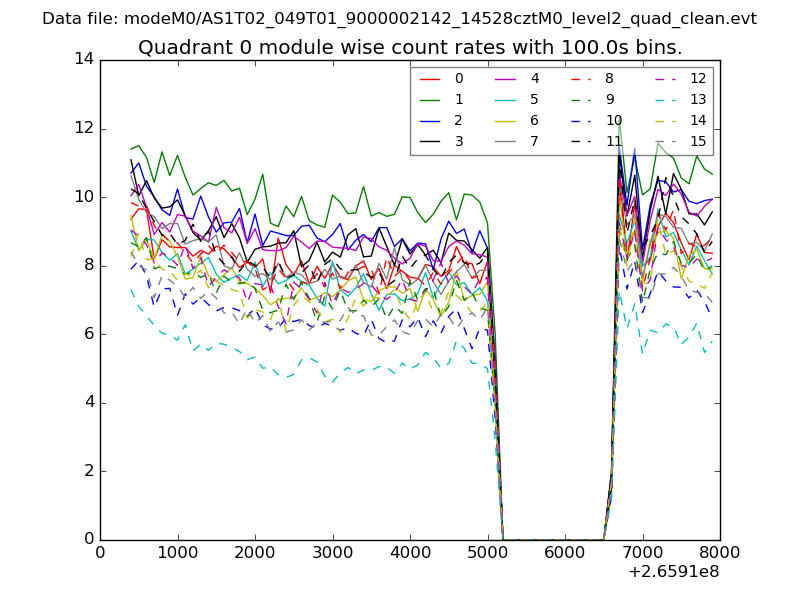 |
 |
| Module-wise count rates for Quadrant B Data is divided into 100 sec bins |
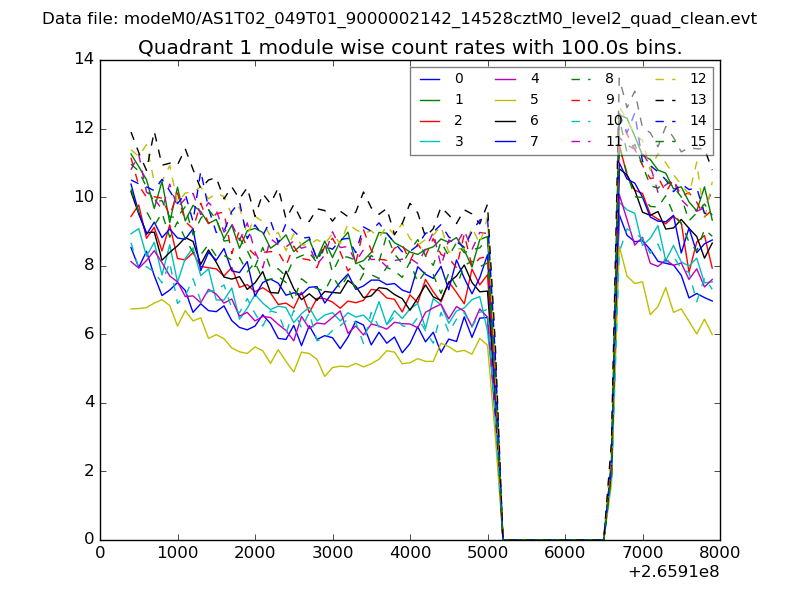 |
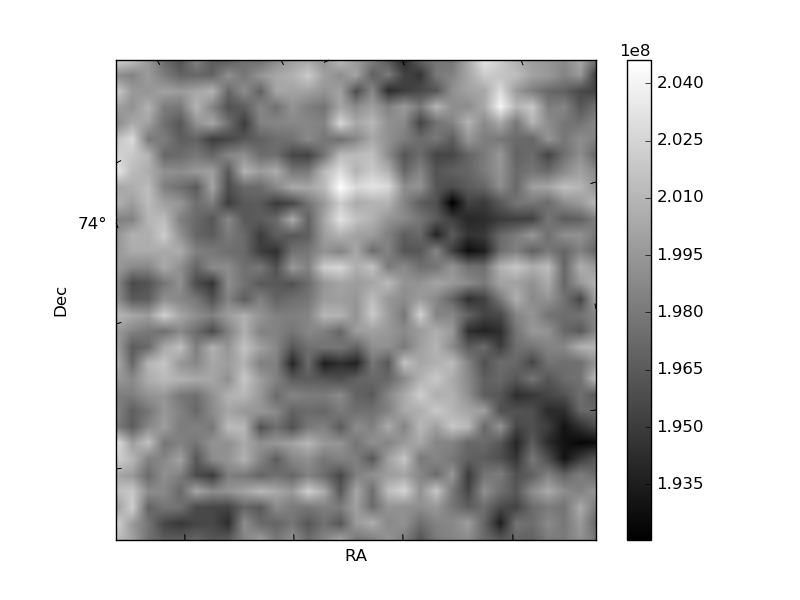 |
| Module-wise count rates for Quadrant C Data is divided into 100 sec bins |
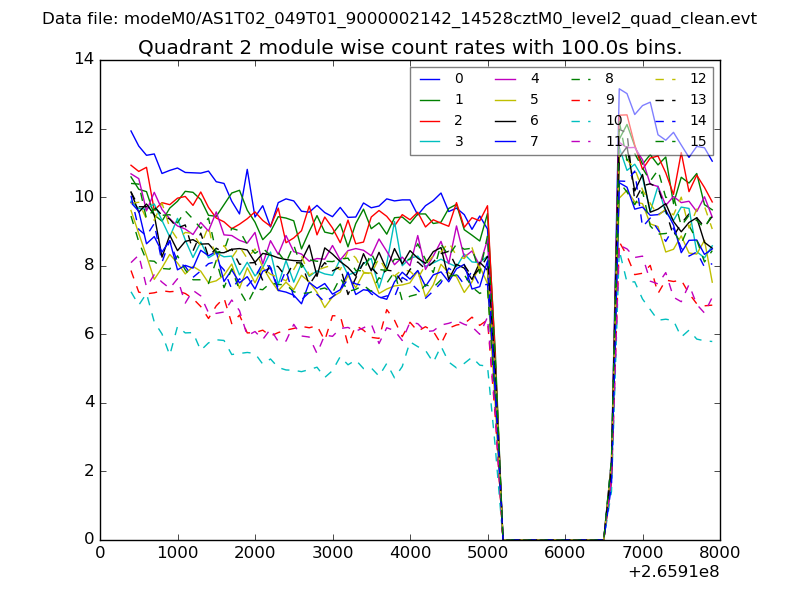 |
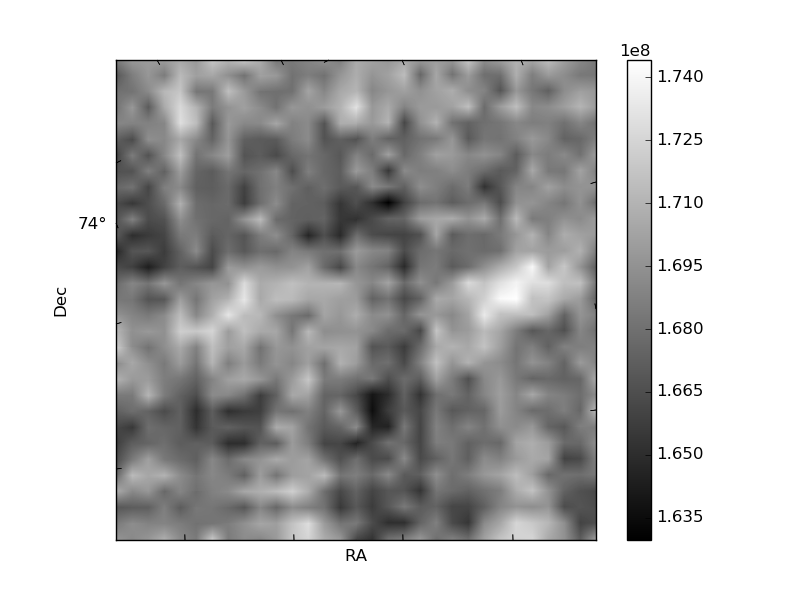 |
| Module-wise count rates for Quadrant D Data is divided into 100 sec bins |
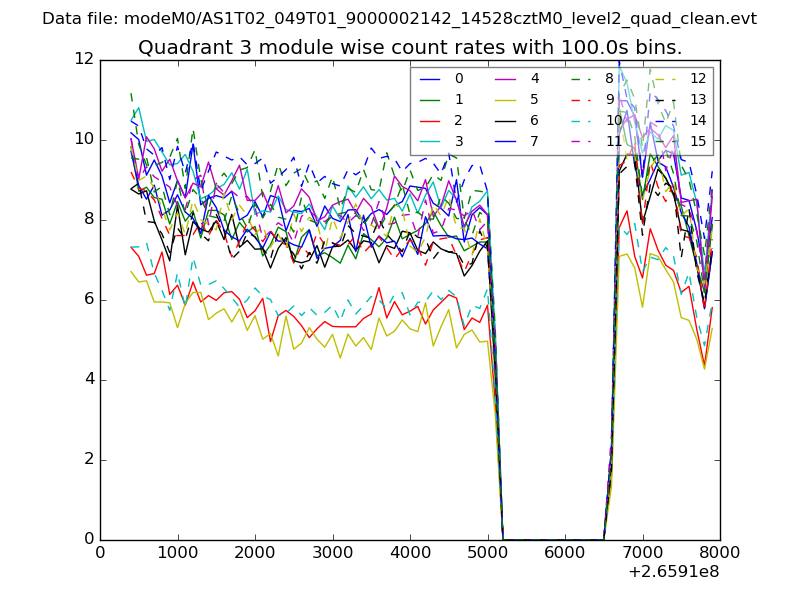 |
 |
| Parameter | Plot |
|---|---|
| CZT HV Monitor | 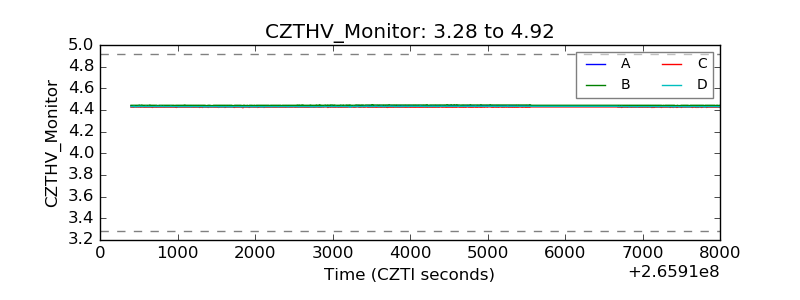 |
| D_VDD | 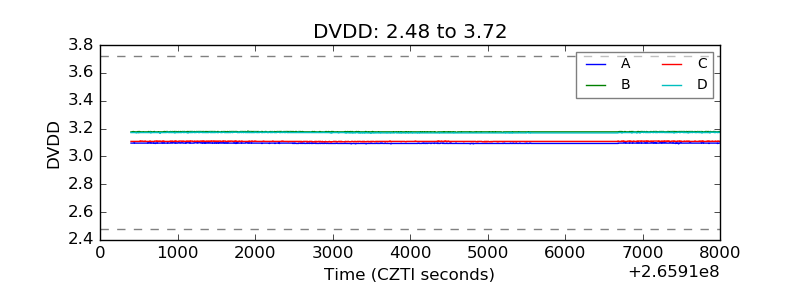 |
| Temperature 1 | 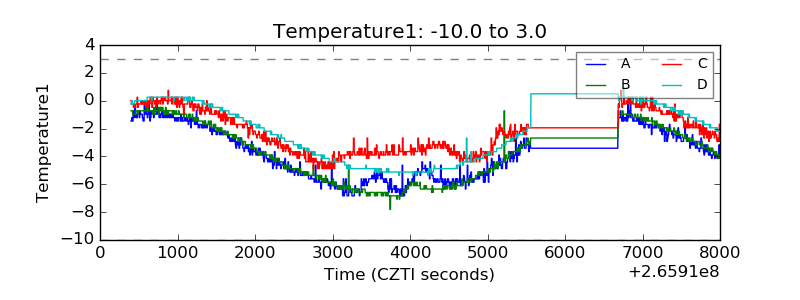 |
| Veto HV Monitor | 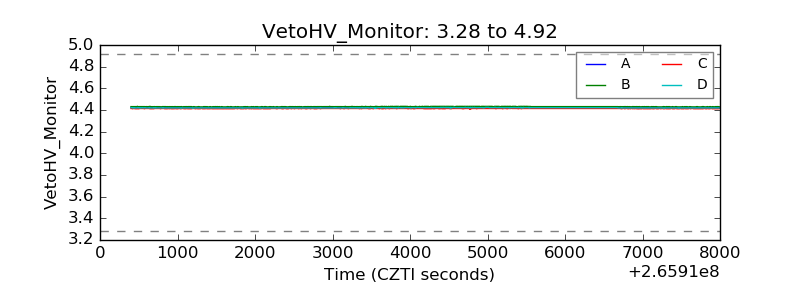 |
| Veto LLD | 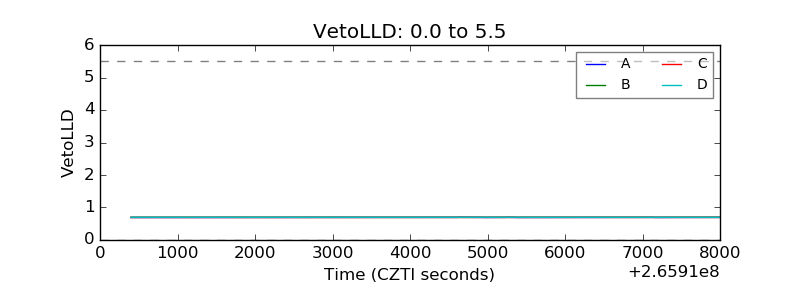 |
| Alpha Counter |  |
| _CPM_Rate |  |
| CZT Counter | 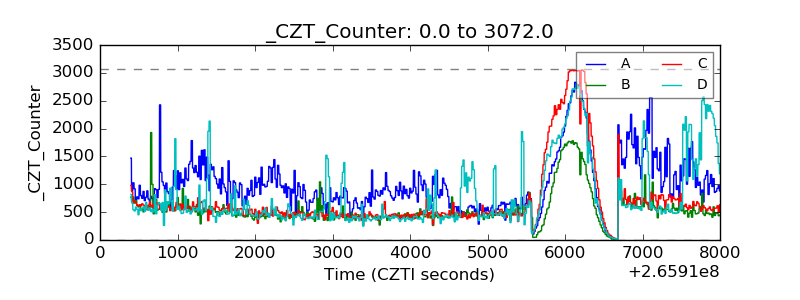 |
| +2.5 Volts monitor |  |
| +5 Volts monitor |  |
| _ROLL_ROT | 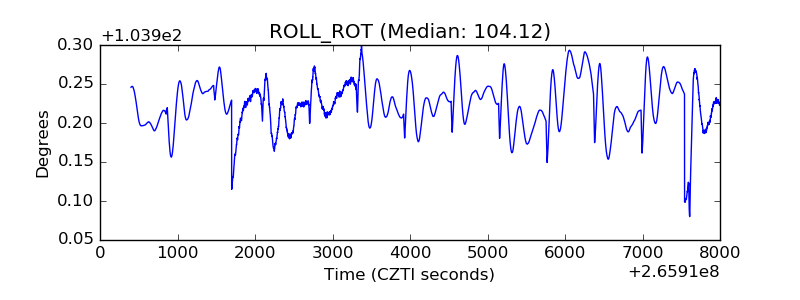 |
| _Roll_DEC | 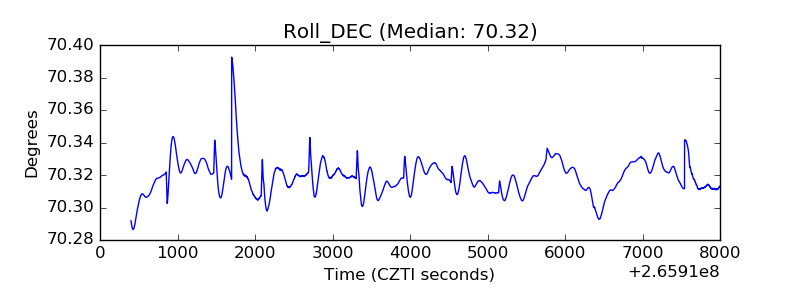 |
| _Roll_RA | 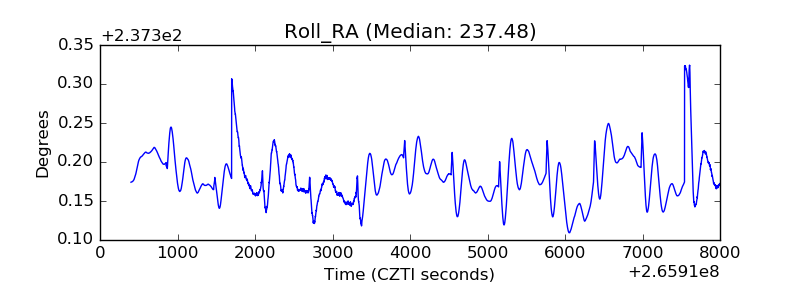 |
| Veto Counter | 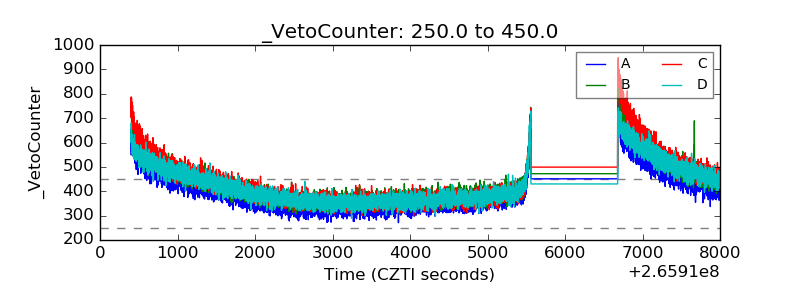 |