| Param | Original file | Final file |
|---|---|---|
| Filename | modeM0/AS1T02_049T01_9000002142_14531cztM0_level2.evt | modeM0/AS1T02_049T01_9000002142_14531cztM0_level2_quad_clean.evt |
| Size (bytes) | 498,686,400 | 117,927,360 |
| Size | 475.6 MB | 112.5 MB |
| Events in quadrant A | 4,774,600 | 751,266 |
| Events in quadrant B | 3,354,682 | 808,743 |
| Events in quadrant C | 3,312,724 | 812,976 |
| Events in quadrant D | 3,241,828 | 767,529 |
| Mode M0 | |||
|---|---|---|---|
| Quadrant | BADHDUFLAG | Total packets | Discarded packets |
| A | 0 | 18319 | 3 |
| B | 0 | 14125 | 2 |
| C | 0 | 14036 | 2 |
| D | 0 | 13916 | 2 |
| Mode M9 | |||
|---|---|---|---|
| Quadrant | BADHDUFLAG | Total packets | Discarded packets |
| A | 0 | 22 | 0 |
| B | 0 | 22 | 0 |
| C | 0 | 22 | 0 |
| D | 0 | 23 | 0 |
| Mode SS | |||
|---|---|---|---|
| Quadrant | BADHDUFLAG | Total packets | Discarded packets |
| A | 0 | 126 | 0 |
| B | 0 | 126 | 0 |
| C | 0 | 126 | 0 |
| D | 0 | 126 | 0 |
| Quadrant | Total seconds | Saturated seconds | Saturation percentage |
|---|---|---|---|
| A | 6173 | 535 | 8.666775% |
| B | 6173 | 56 | 0.907176% |
| C | 6173 | 34 | 0.550786% |
| D | 6173 | 79 | 1.279767% |
Noise dominated data is calculated using 1-second bins in cleaned event files. If a bin has >2000 counts, and if more than 50% of those come from <1% of pixels, then it is considered to be noise-dominated and hence unusable.
| Quadrant | # 1 sec bins | Bins with >0 counts | Bins with >2000 counts | High rate bins dominated by noise | Noise dominated (total time) | Noise dominated (detector-on time) | Marked lightcurve |
|---|---|---|---|---|---|---|---|
| A | 7469 | 6175 | 364 | 364 | 4.87% | 5.89% | 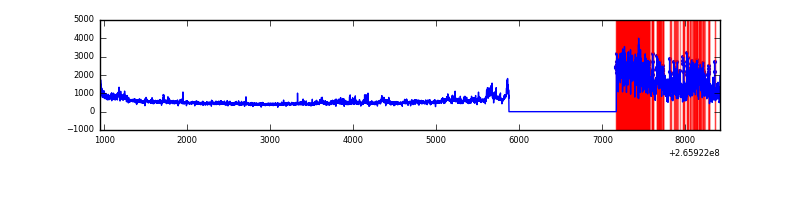 |
| B | 7469 | 6175 | 14 | 14 | 0.19% | 0.23% | 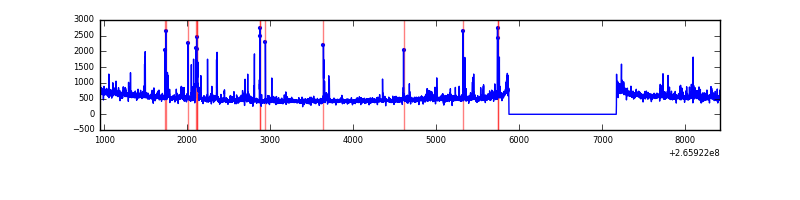 |
| C | 7469 | 6175 | 1 | 1 | 0.01% | 0.02% | 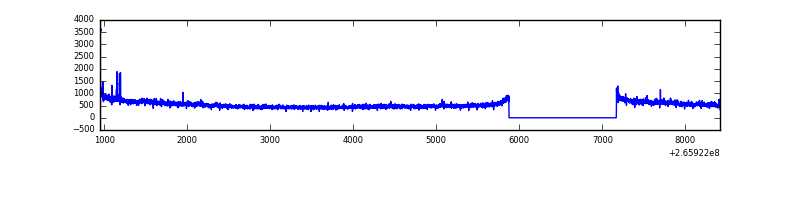 |
| D | 7469 | 6175 | 55 | 55 | 0.74% | 0.89% | 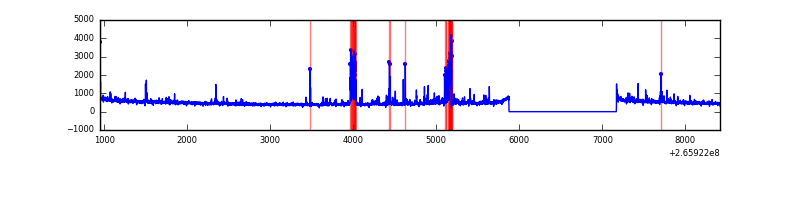 |
Top three noisy pixels from each quadrant. If the there are fewer than three noisy pixels in the level2.evt file, extra rows are filled as -1
| Pixel properties | Quadrant properties | ||||||
|---|---|---|---|---|---|---|---|
| Quadrant | DetID | PixID | Counts | Sigma | Mean | Median | Sigma |
| A | 8 | 15 | 1918146 | 12845.48 | 735 | 717 | 149.3 |
| A | 12 | 189 | 16210 | 103.79 | 735 | 717 | 149.3 |
| A | 0 | 23 | 8570 | 52.61 | 735 | 717 | 149.3 |
| B | 0 | 85 | 69099 | 482.9 | 773 | 756 | 141.5 |
| B | 0 | 189 | 60878 | 424.81 | 773 | 756 | 141.5 |
| B | 3 | 209 | 39447 | 273.38 | 773 | 756 | 141.5 |
| C | 3 | 233 | 311719 | 1798.09 | 763 | 769 | 172.9 |
| C | 0 | 207 | 23571 | 131.85 | 763 | 769 | 172.9 |
| C | 13 | 61 | 5625 | 28.08 | 763 | 769 | 172.9 |
| D | 10 | 199 | 199300 | 1095.02 | 750 | 728 | 181.3 |
| D | 2 | 120 | 112194 | 614.67 | 750 | 728 | 181.3 |
| D | 15 | 0 | 43363 | 235.11 | 750 | 728 | 181.3 |
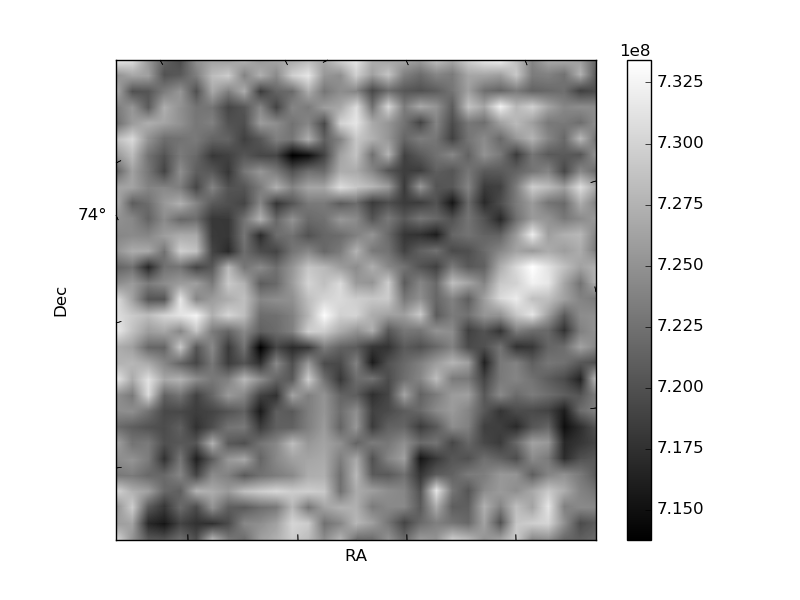
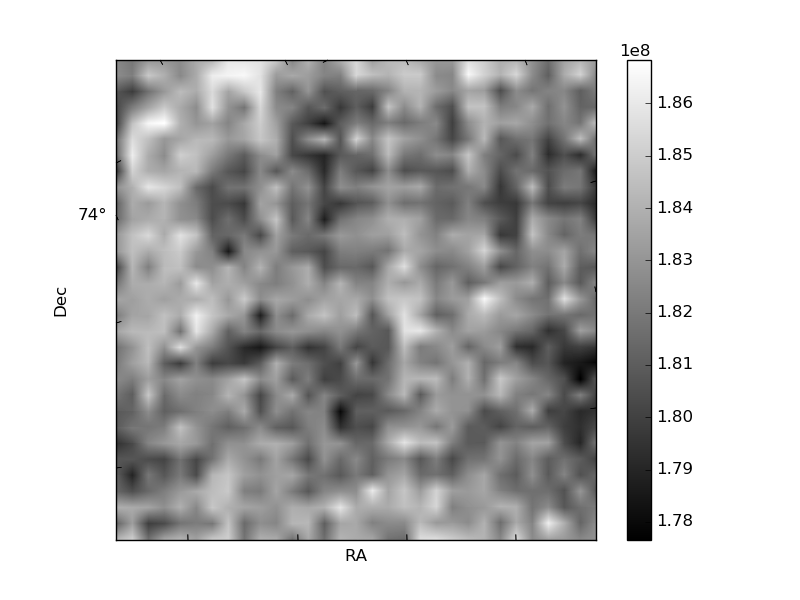
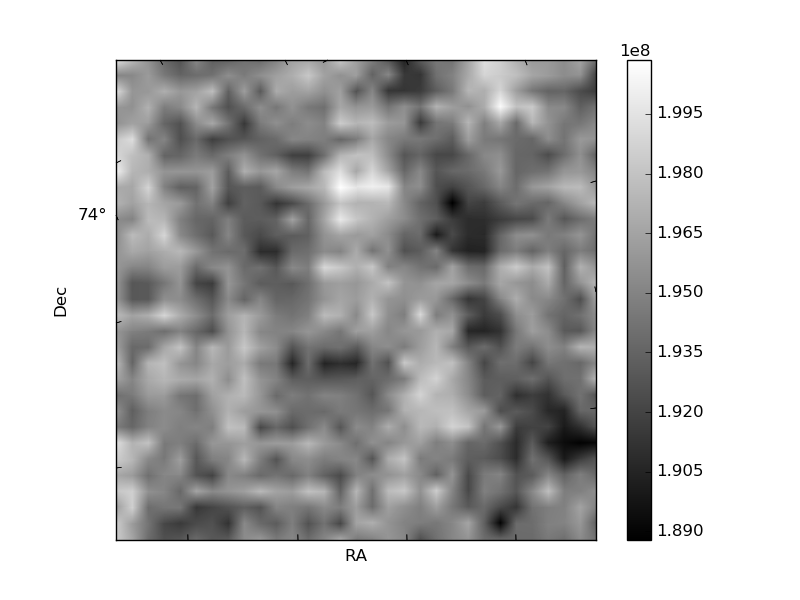
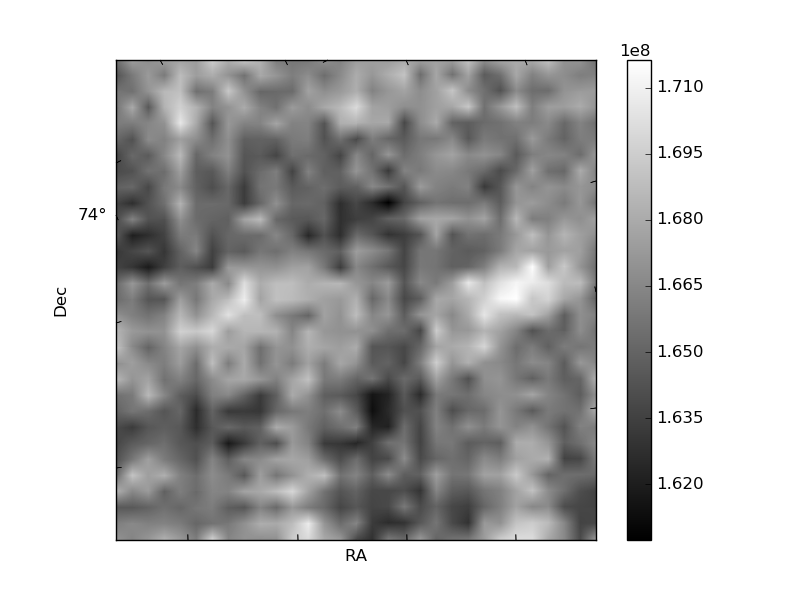
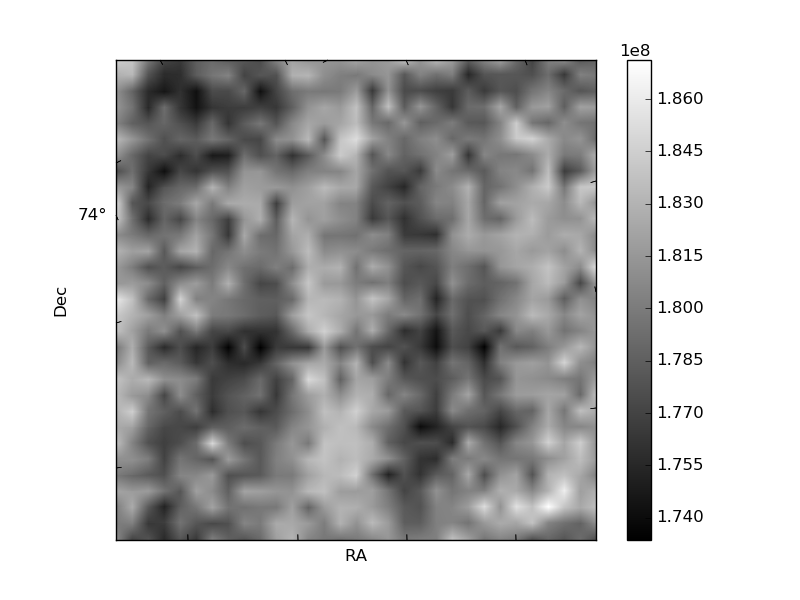
Histogram calculated using DETX and DETY for each event in the final _common_clean file
| Quadrant A | 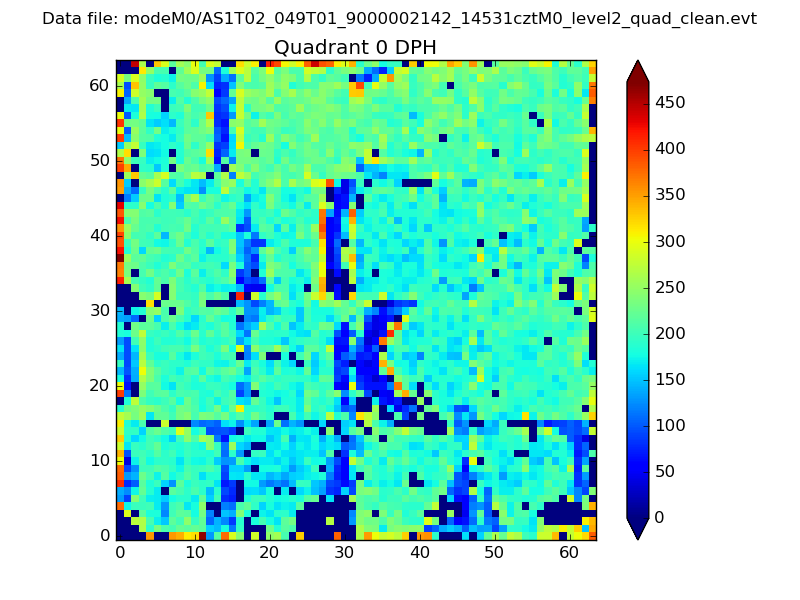 |
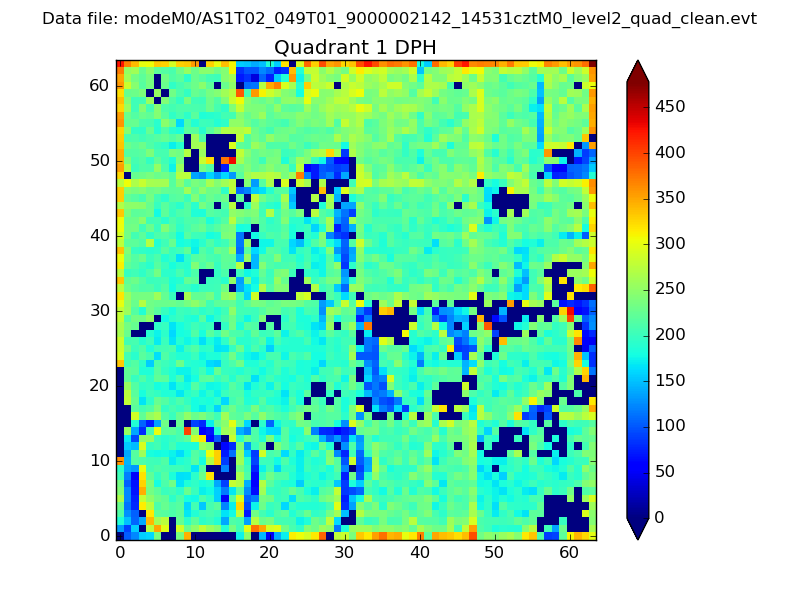 |
Quadrant B |
|---|---|---|---|
| Quadrant D | 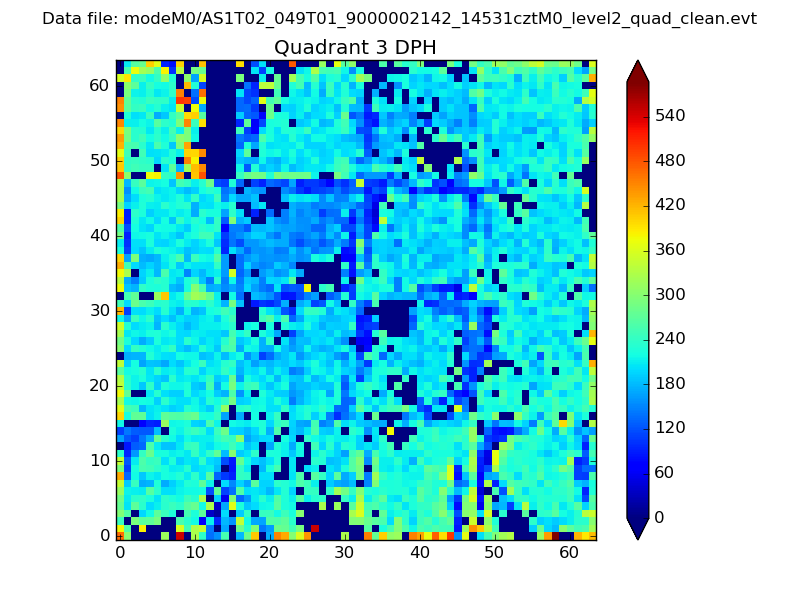 |
 |
Quadrant C |
| Plot type | Count rate plots | Images |
|---|---|---|
| Comparison with Poisson distribution Blue bars denote a histogram of data divided into 1 sec bins. Red curve is a Poisson curve with rate = median count rate of data. |
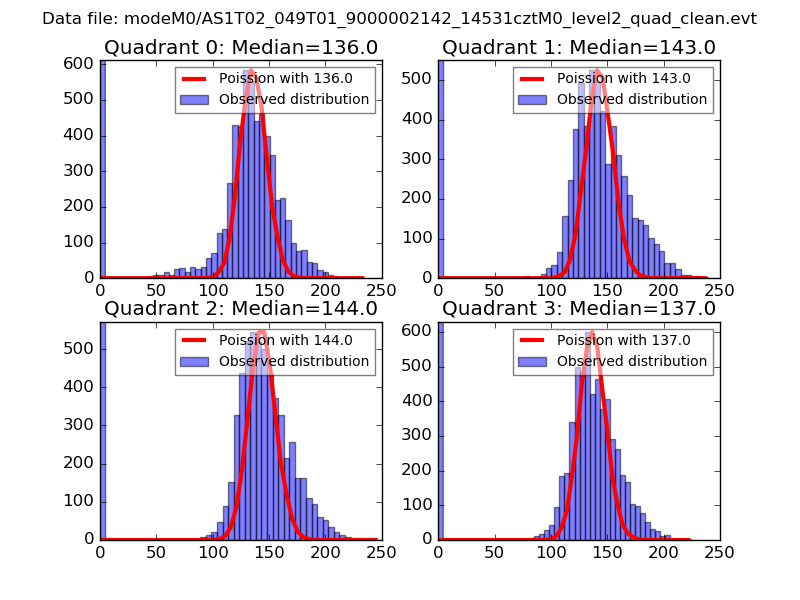 |
 |
| Quadrant-wise count rates Data is divided into 100 sec bins |
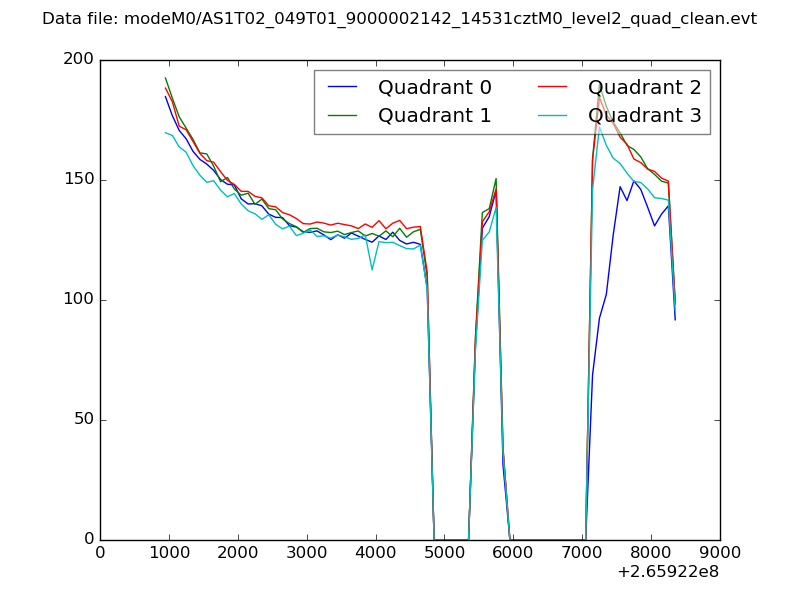 |
|
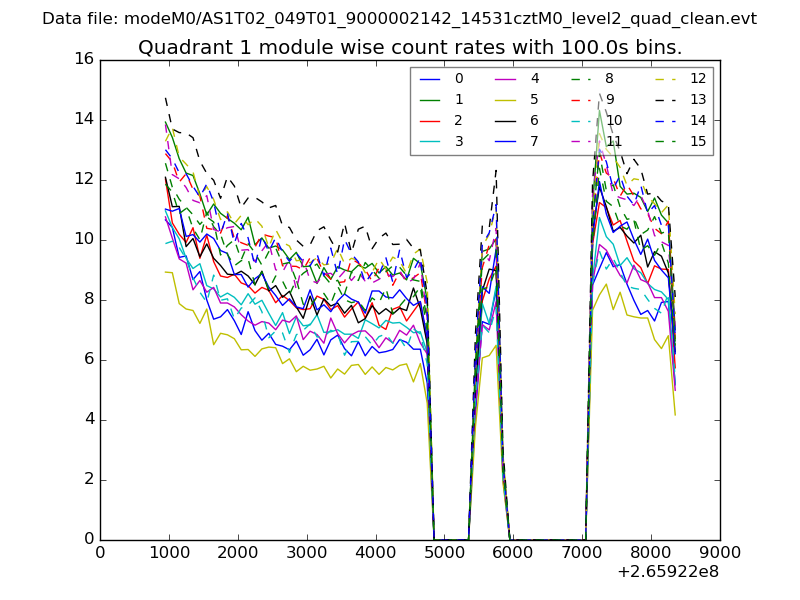
| Module-wise count rates for Quadrant A Data is divided into 100 sec bins |
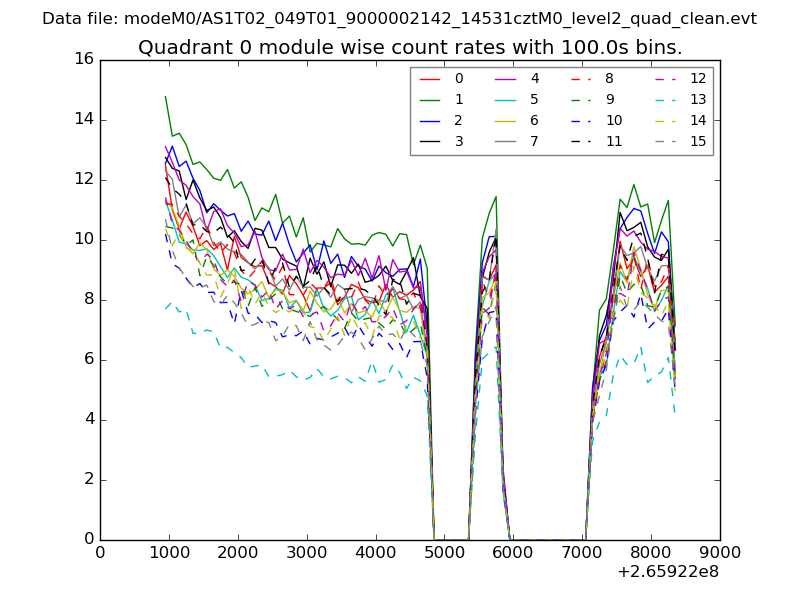 |
 |
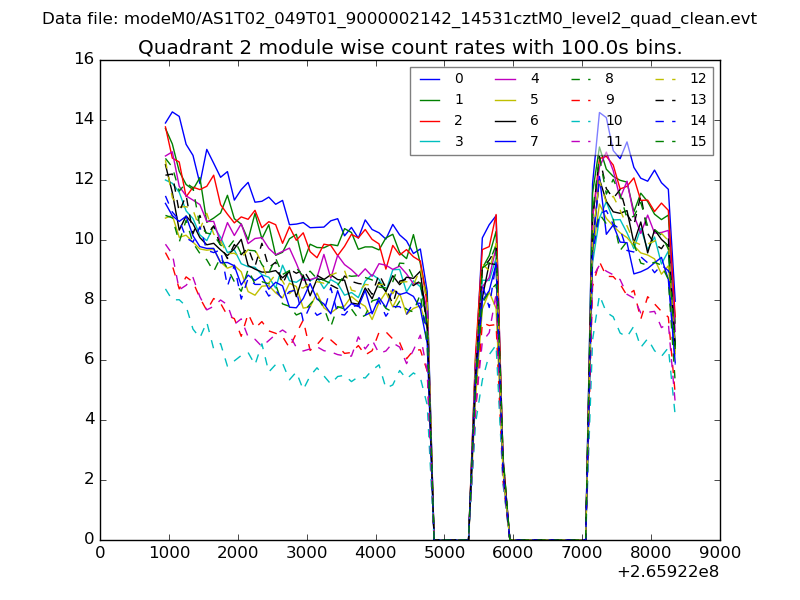
| Module-wise count rates for Quadrant B Data is divided into 100 sec bins |
 |
 |
| Module-wise count rates for Quadrant C Data is divided into 100 sec bins |
 |
 |
| Module-wise count rates for Quadrant D Data is divided into 100 sec bins |
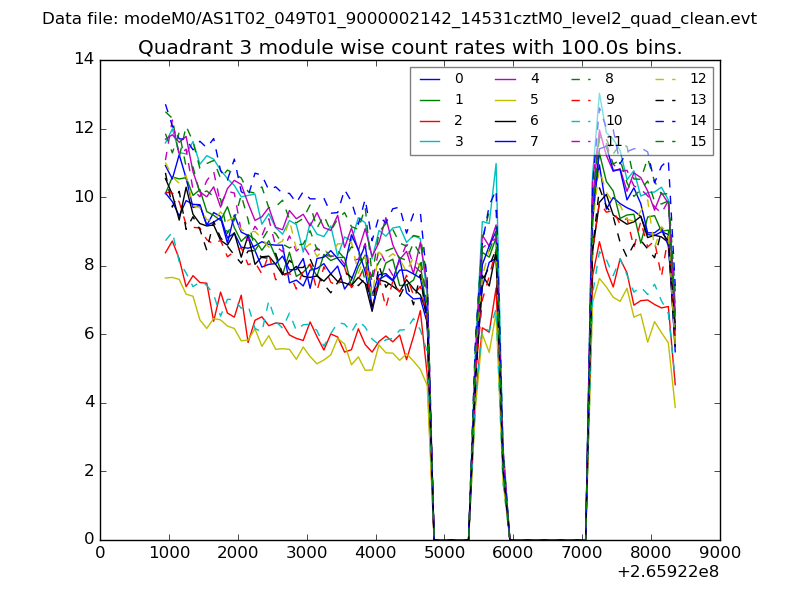 |
 |
| Parameter | Plot |
|---|---|
| CZT HV Monitor | 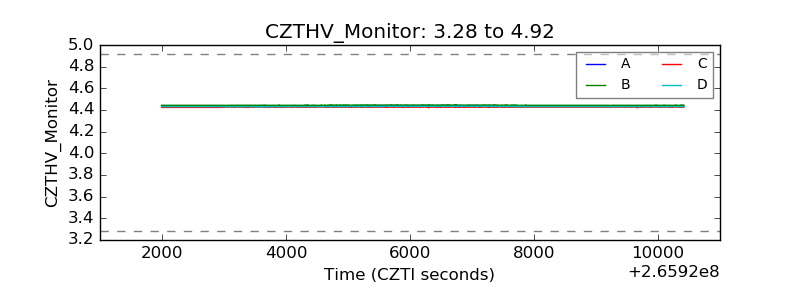 |
| D_VDD | 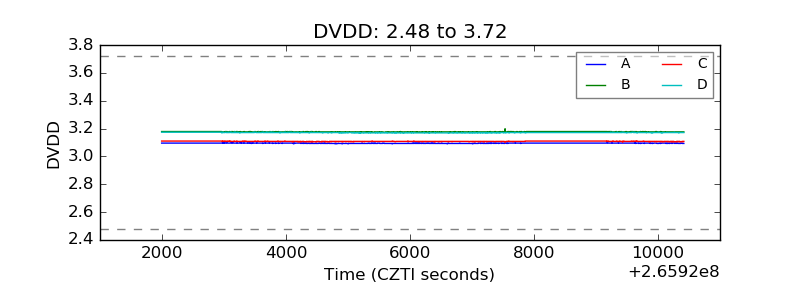 |
| Temperature 1 | 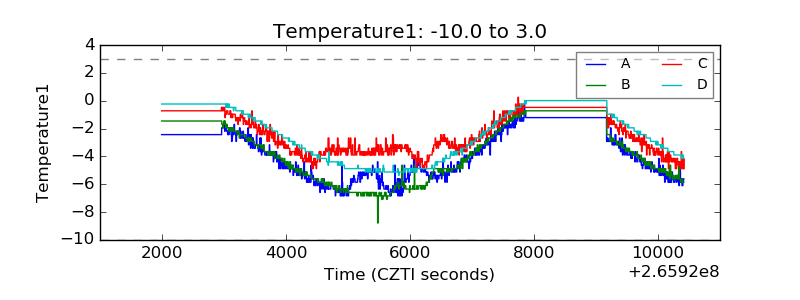 |
| Veto HV Monitor | 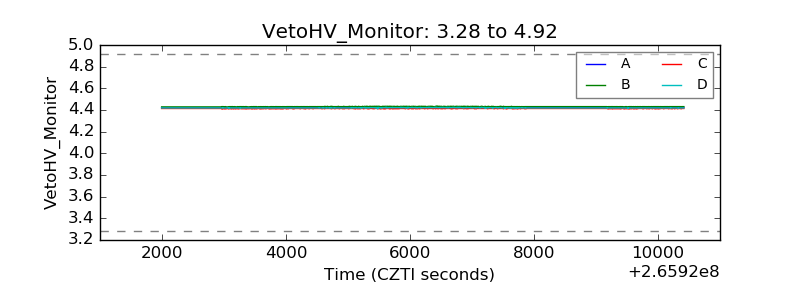 |
| Veto LLD | 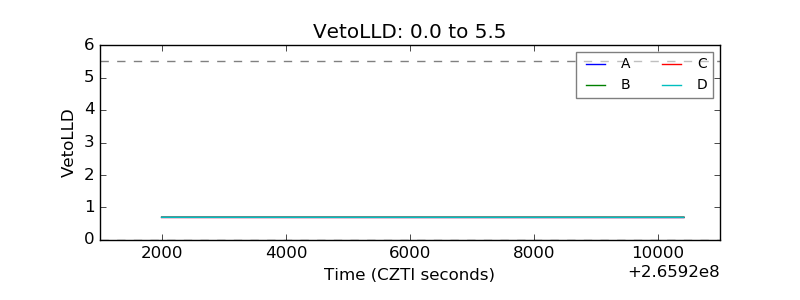 |
| Alpha Counter | 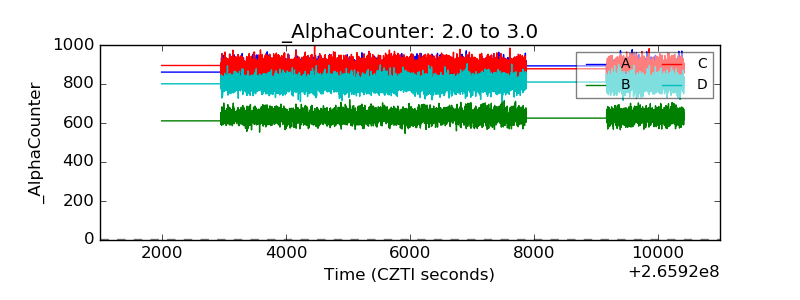 |
| _CPM_Rate | 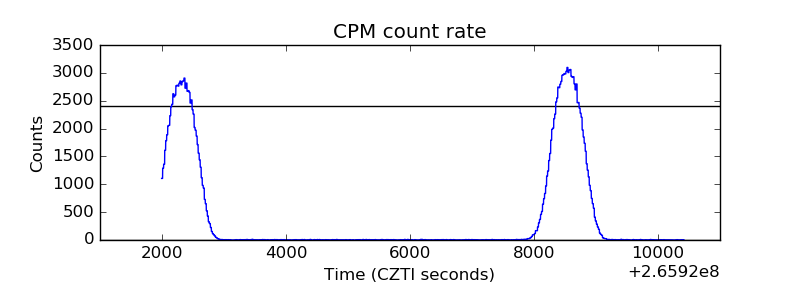 |
| CZT Counter | 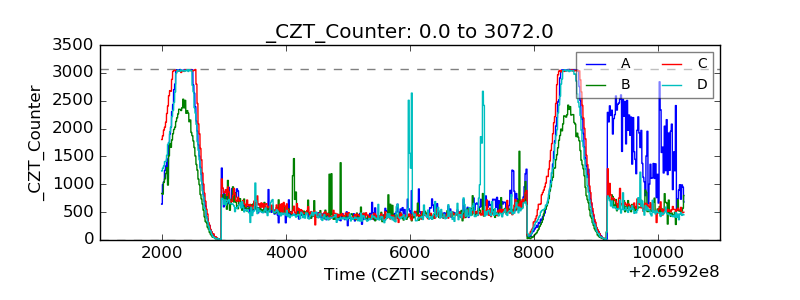 |
| +2.5 Volts monitor |  |
| +5 Volts monitor | 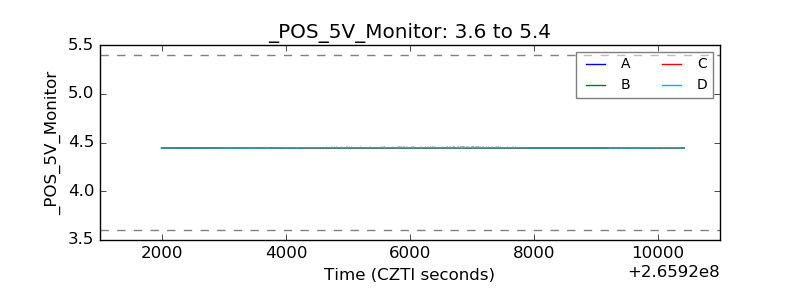 |
| _ROLL_ROT | 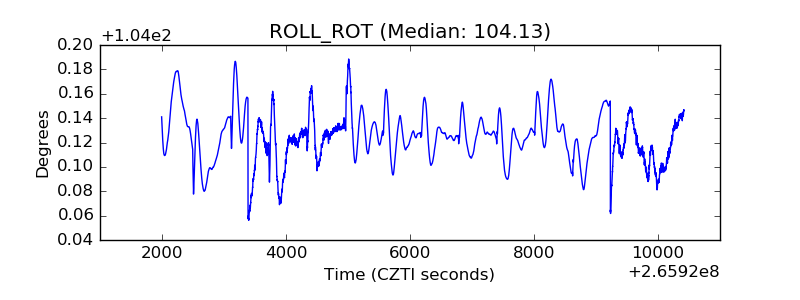 |
| _Roll_DEC | 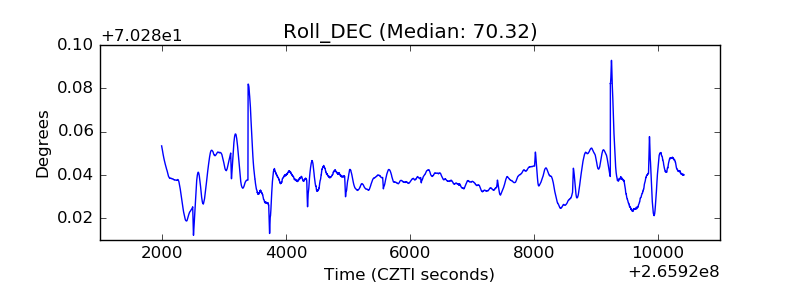 |
| _Roll_RA | 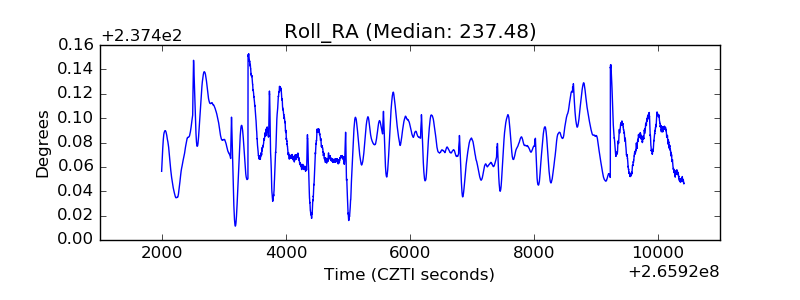 |
| Veto Counter | 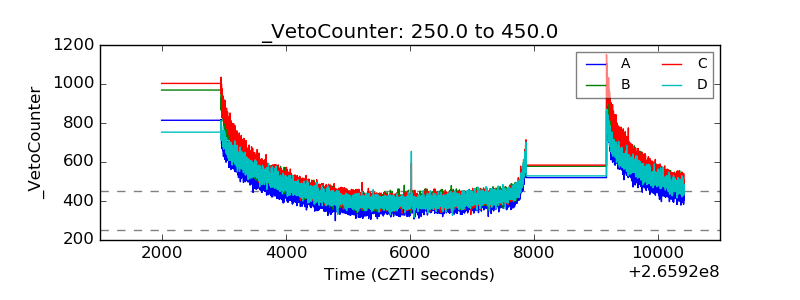 |