| Param | Original file | Final file |
|---|---|---|
| Filename | modeM0/AS1T02_049T01_9000002142_14532cztM0_level2.evt | modeM0/AS1T02_049T01_9000002142_14532cztM0_level2_quad_clean.evt |
| Size (bytes) | 505,641,600 | 118,301,760 |
| Size | 482.2 MB | 112.8 MB |
| Events in quadrant A | 5,201,949 | 751,265 |
| Events in quadrant B | 3,358,974 | 815,284 |
| Events in quadrant C | 3,305,526 | 813,835 |
| Events in quadrant D | 3,024,699 | 768,027 |
| Mode M0 | |||
|---|---|---|---|
| Quadrant | BADHDUFLAG | Total packets | Discarded packets |
| A | 0 | 19616 | 3 |
| B | 0 | 14158 | 2 |
| C | 0 | 13836 | 2 |
| D | 0 | 13316 | 2 |
| Mode M9 | |||
|---|---|---|---|
| Quadrant | BADHDUFLAG | Total packets | Discarded packets |
| A | 0 | 15 | 0 |
| B | 0 | 15 | 0 |
| C | 0 | 15 | 0 |
| D | 0 | 16 | 0 |
| Mode SS | |||
|---|---|---|---|
| Quadrant | BADHDUFLAG | Total packets | Discarded packets |
| A | 0 | 126 | 0 |
| B | 0 | 126 | 0 |
| C | 0 | 126 | 0 |
| D | 0 | 126 | 0 |
| Quadrant | Total seconds | Saturated seconds | Saturation percentage |
|---|---|---|---|
| A | 6226 | 541 | 8.689367% |
| B | 6226 | 41 | 0.658529% |
| C | 6226 | 30 | 0.481850% |
| D | 6226 | 26 | 0.417604% |
Noise dominated data is calculated using 1-second bins in cleaned event files. If a bin has >2000 counts, and if more than 50% of those come from <1% of pixels, then it is considered to be noise-dominated and hence unusable.
| Quadrant | # 1 sec bins | Bins with >0 counts | Bins with >2000 counts | High rate bins dominated by noise | Noise dominated (total time) | Noise dominated (detector-on time) | Marked lightcurve |
|---|---|---|---|---|---|---|---|
| A | 7577 | 6228 | 380 | 380 | 5.02% | 6.10% | 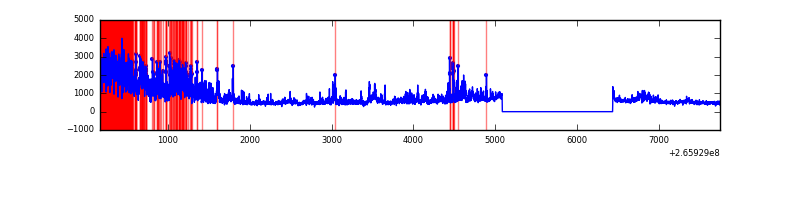 |
| B | 7577 | 6228 | 5 | 5 | 0.07% | 0.08% | 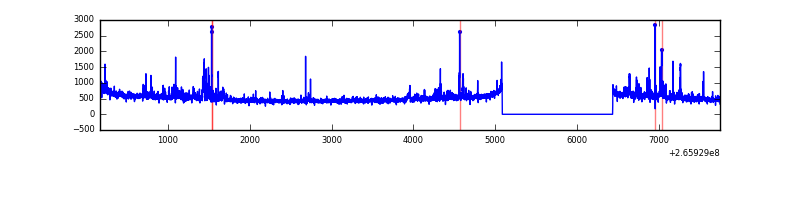 |
| C | 7577 | 6228 | 0 | 0 | 0.00% | 0.00% | 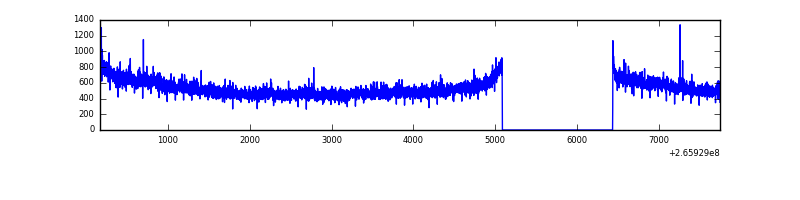 |
| D | 7577 | 6228 | 8 | 8 | 0.11% | 0.13% | 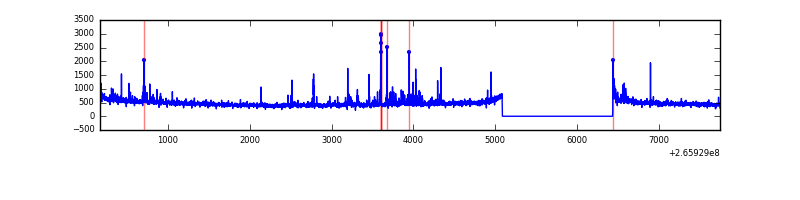 |
Top three noisy pixels from each quadrant. If the there are fewer than three noisy pixels in the level2.evt file, extra rows are filled as -1
| Pixel properties | Quadrant properties | ||||||
|---|---|---|---|---|---|---|---|
| Quadrant | DetID | PixID | Counts | Sigma | Mean | Median | Sigma |
| A | 8 | 15 | 2328907 | 15863.8 | 733 | 717 | 146.8 |
| A | 12 | 189 | 29750 | 197.82 | 733 | 717 | 146.8 |
| A | 0 | 23 | 14427 | 93.42 | 733 | 717 | 146.8 |
| B | 0 | 189 | 74685 | 524.29 | 774 | 755 | 141.0 |
| B | 0 | 219 | 70151 | 492.13 | 774 | 755 | 141.0 |
| B | 3 | 209 | 43021 | 299.74 | 774 | 755 | 141.0 |
| C | 3 | 233 | 335641 | 1940.53 | 761 | 766 | 172.6 |
| C | 13 | 61 | 5587 | 27.94 | 761 | 766 | 172.6 |
| C | 14 | 225 | 3038 | 13.17 | 761 | 766 | 172.6 |
| D | 2 | 120 | 86190 | 475.69 | 746 | 726 | 179.7 |
| D | 10 | 199 | 40473 | 221.23 | 746 | 726 | 179.7 |
| D | 15 | 0 | 38216 | 208.67 | 746 | 726 | 179.7 |
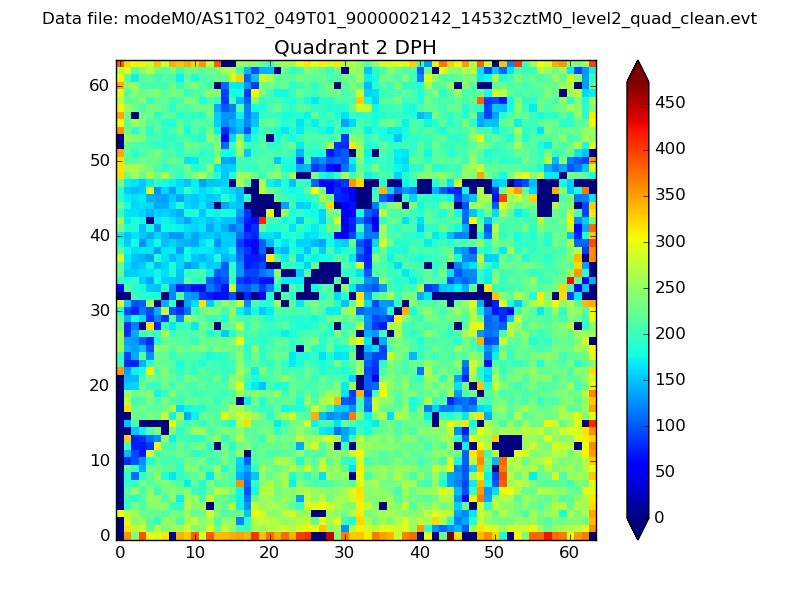
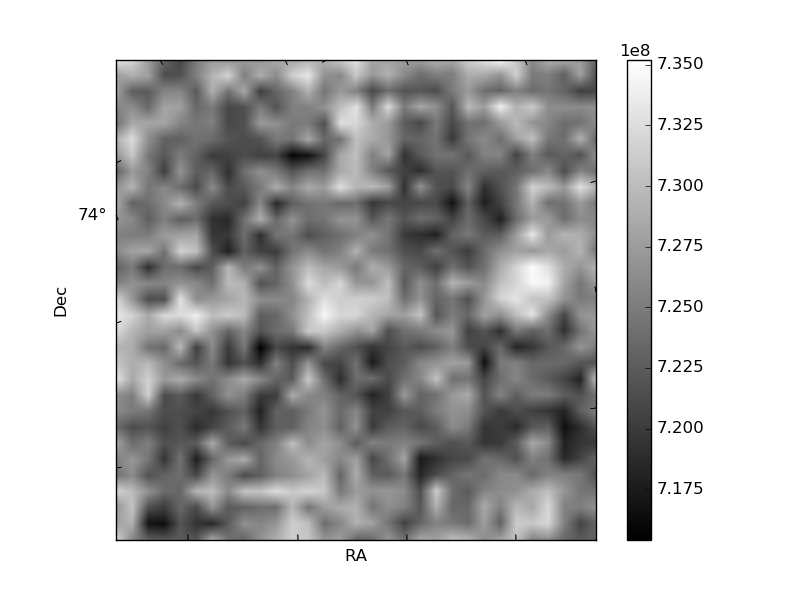
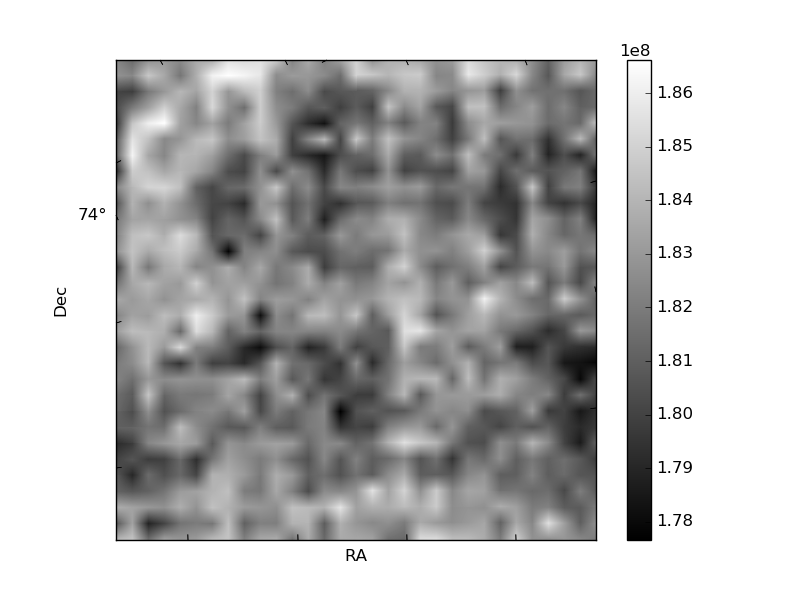
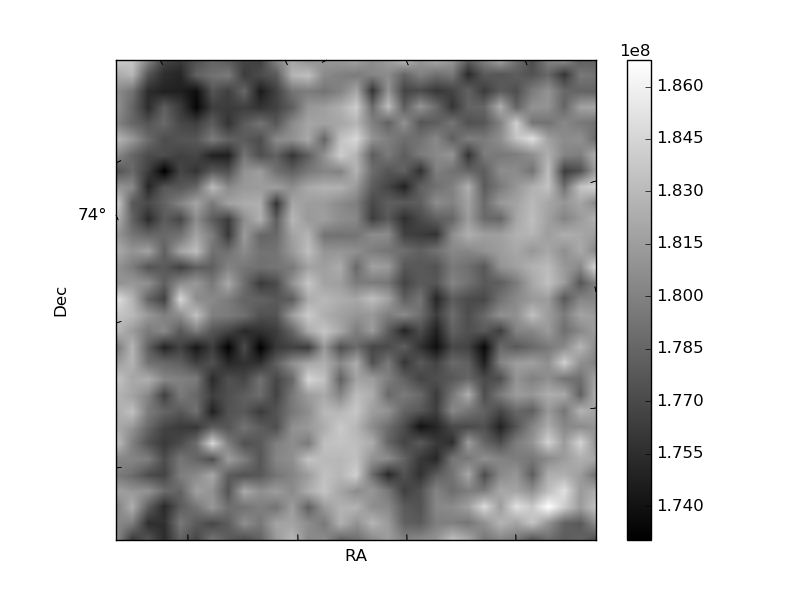
Histogram calculated using DETX and DETY for each event in the final _common_clean file
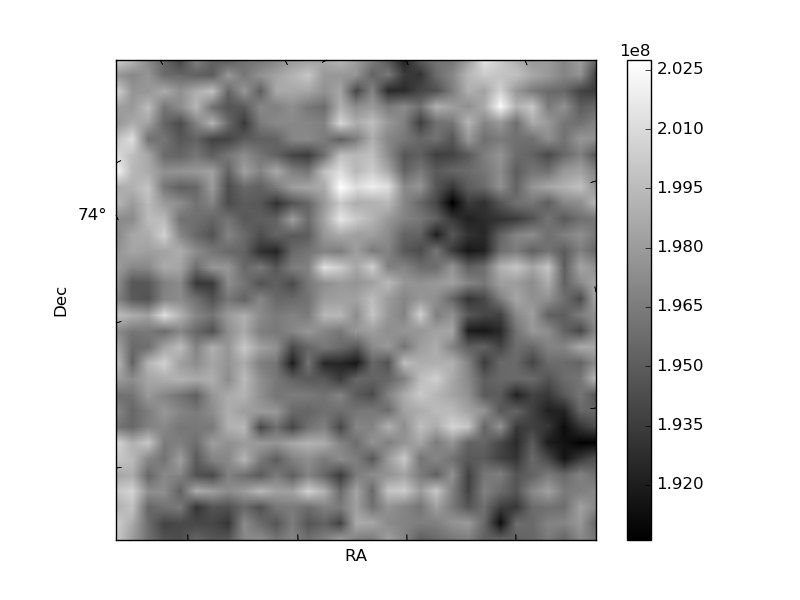
| Quadrant A | 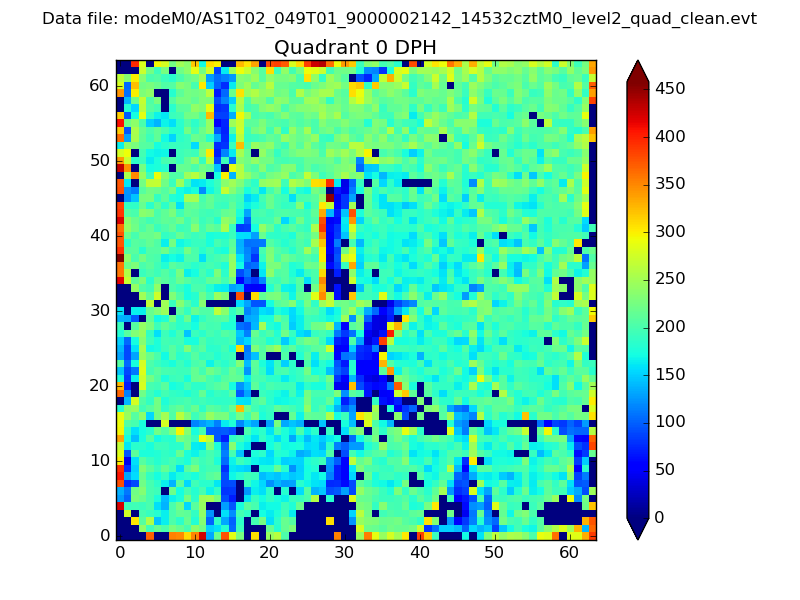 |
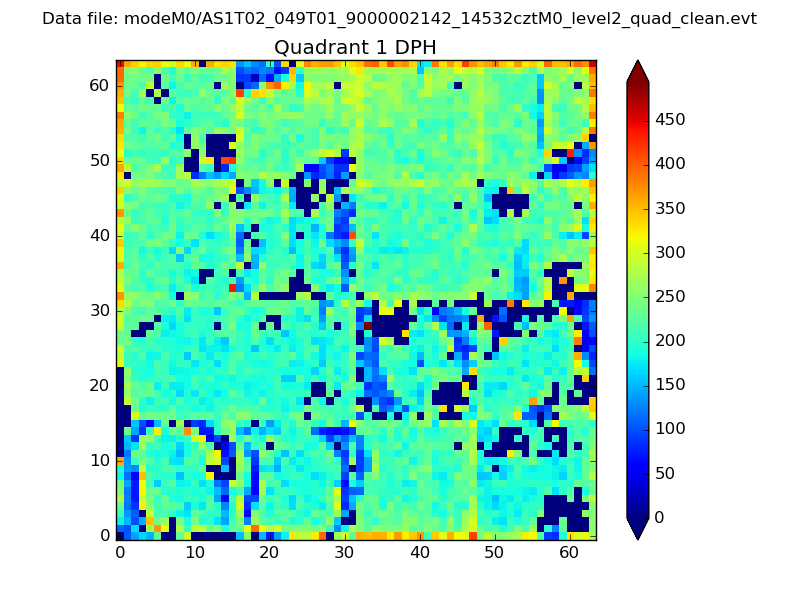 |
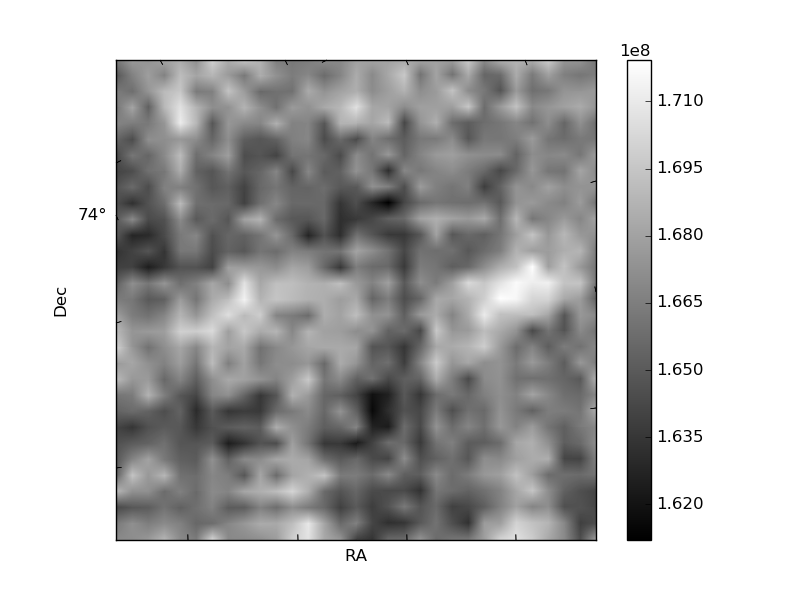
Quadrant B |
|---|---|---|---|
| Quadrant D | 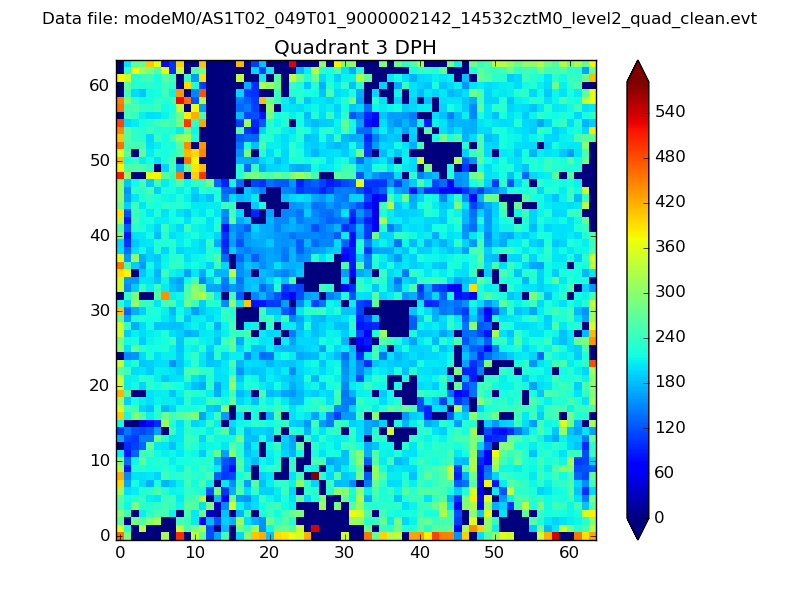 |
 |
Quadrant C |
| Plot type | Count rate plots | Images |
|---|---|---|
| Comparison with Poisson distribution Blue bars denote a histogram of data divided into 1 sec bins. Red curve is a Poisson curve with rate = median count rate of data. |
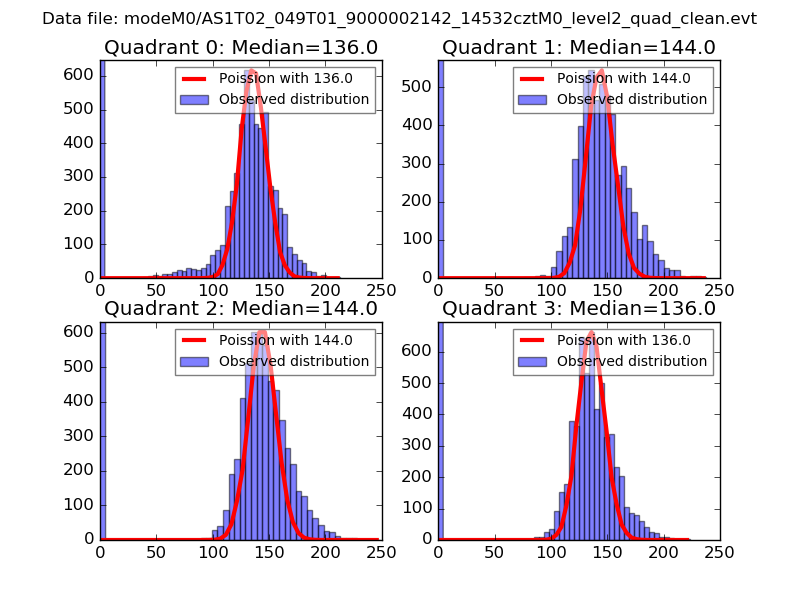 |
 |
| Quadrant-wise count rates Data is divided into 100 sec bins |
 |
|
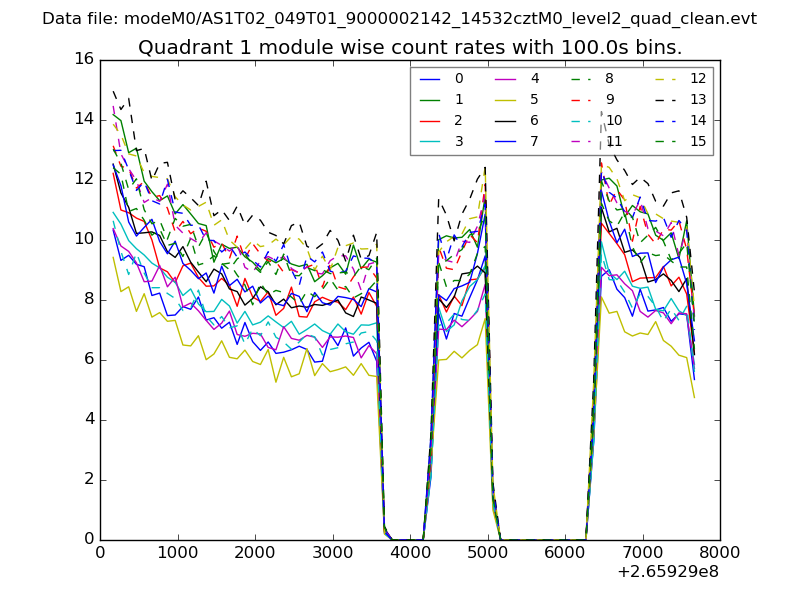
| Module-wise count rates for Quadrant A Data is divided into 100 sec bins |
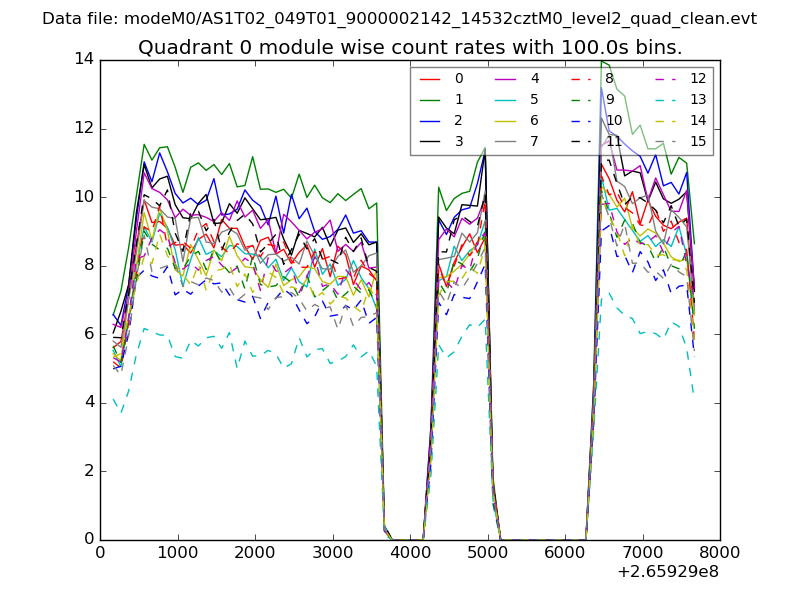 |
 |
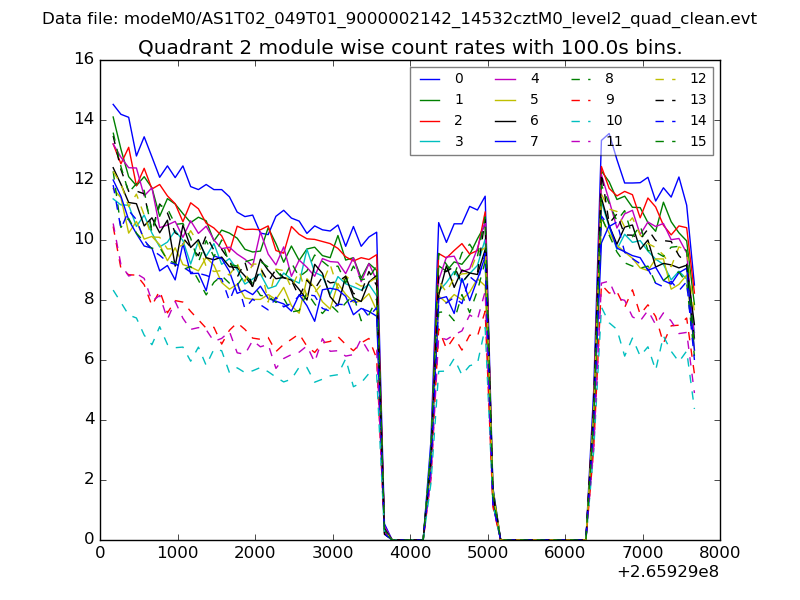
| Module-wise count rates for Quadrant B Data is divided into 100 sec bins |
 |
 |
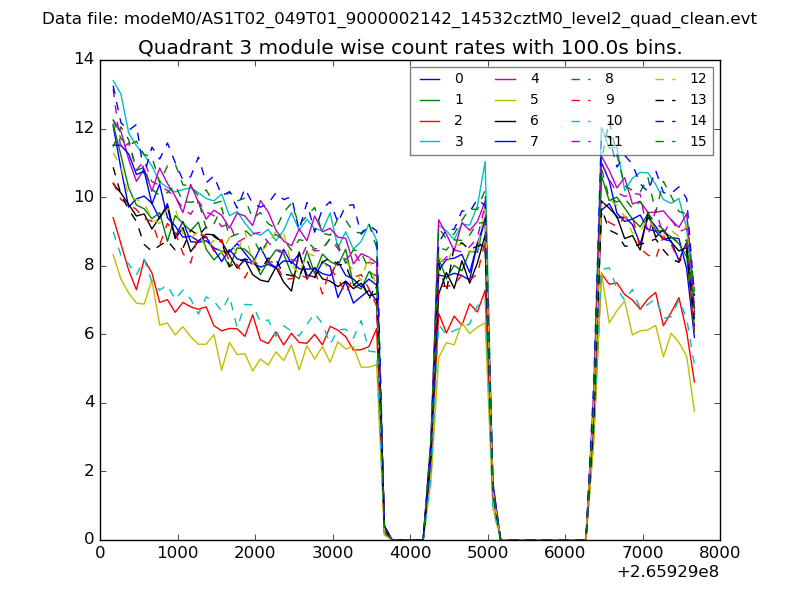
| Module-wise count rates for Quadrant C Data is divided into 100 sec bins |
 |
 |
| Module-wise count rates for Quadrant D Data is divided into 100 sec bins |
 |
 |
| Parameter | Plot |
|---|---|
| CZT HV Monitor | 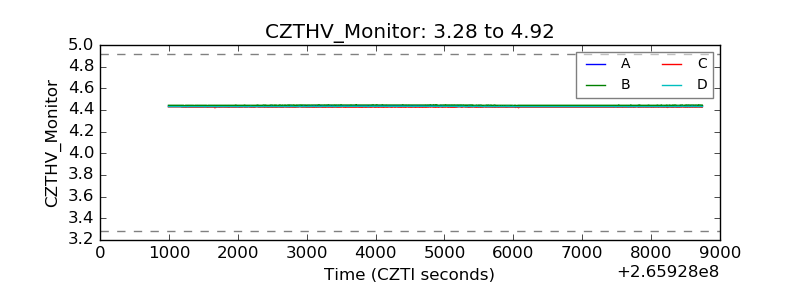 |
| D_VDD | 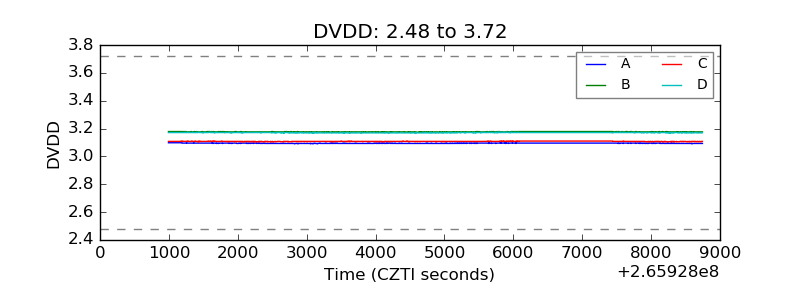 |
| Temperature 1 | 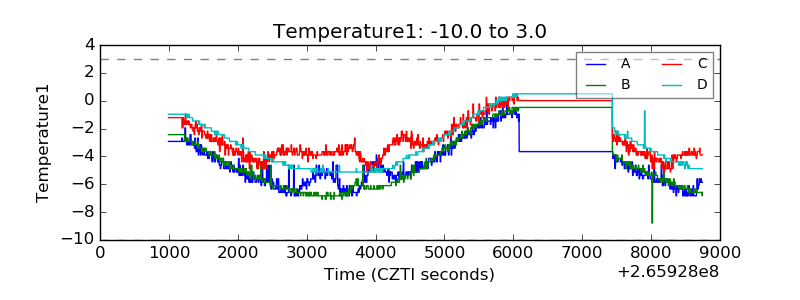 |
| Veto HV Monitor | 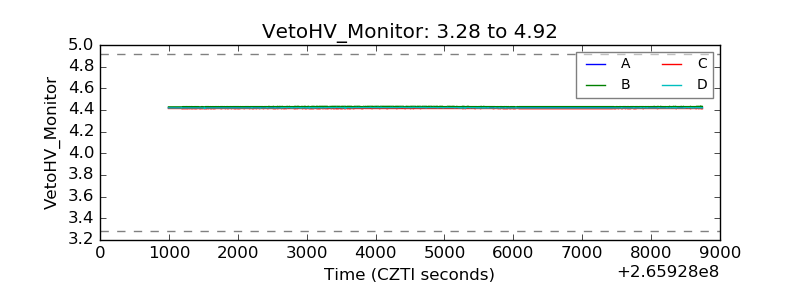 |
| Veto LLD | 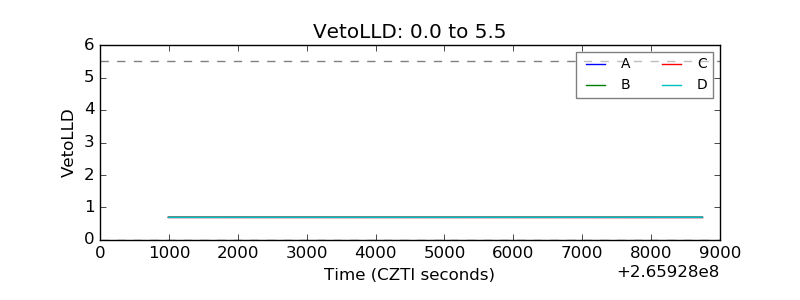 |
| Alpha Counter | 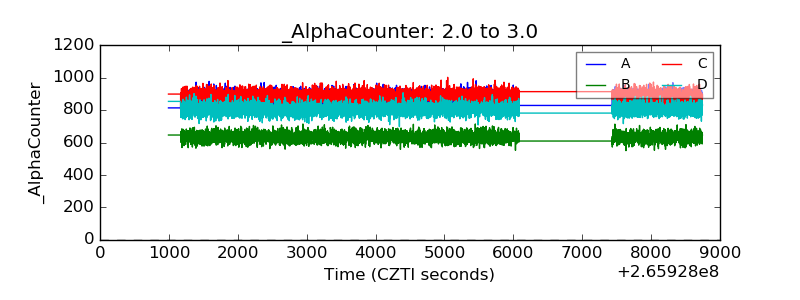 |
| _CPM_Rate |  |
| CZT Counter | 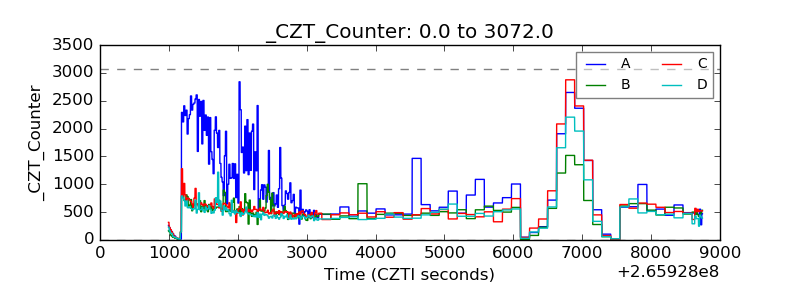 |
| +2.5 Volts monitor |  |
| +5 Volts monitor | 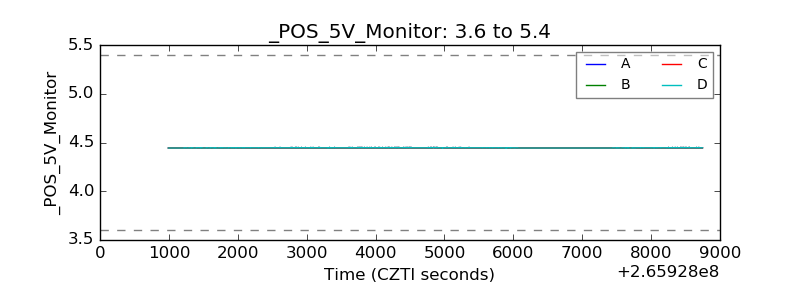 |
| _ROLL_ROT | 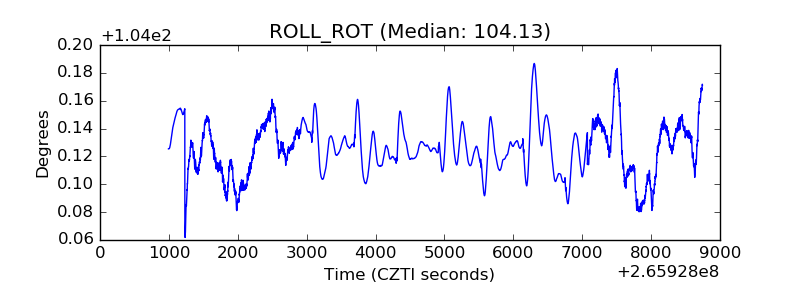 |
| _Roll_DEC | 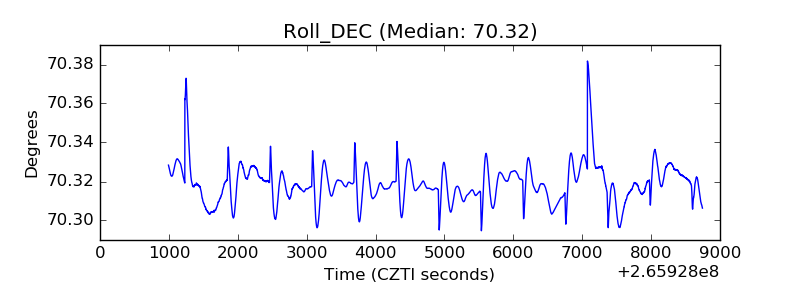 |
| _Roll_RA | 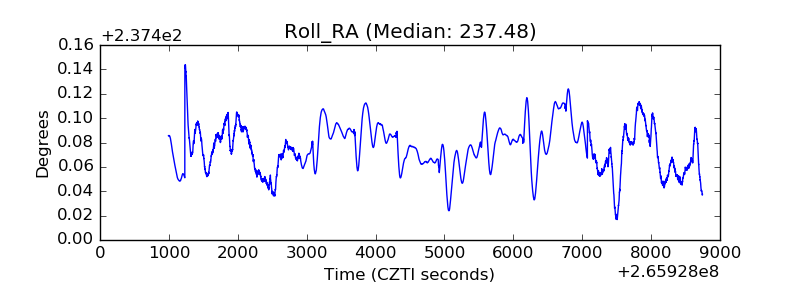 |
| Veto Counter | 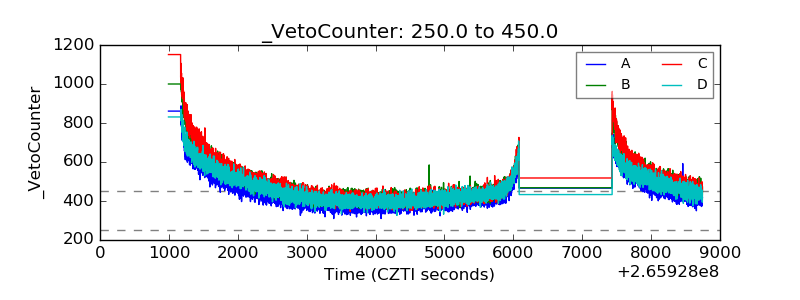 |