| Param | Original file | Final file |
|---|---|---|
| Filename | modeM0/AS1T02_049T01_9000002142_14534cztM0_level2.evt | modeM0/AS1T02_049T01_9000002142_14534cztM0_level2_quad_clean.evt |
| Size (bytes) | 454,285,440 | 115,649,280 |
| Size | 433.2 MB | 110.3 MB |
| Events in quadrant A | 3,246,584 | 766,871 |
| Events in quadrant B | 3,219,642 | 774,716 |
| Events in quadrant C | 3,285,077 | 770,290 |
| Events in quadrant D | 3,562,073 | 734,427 |
| Mode M0 | |||
|---|---|---|---|
| Quadrant | BADHDUFLAG | Total packets | Discarded packets |
| A | 0 | 13923 | 3 |
| B | 0 | 13942 | 2 |
| C | 0 | 13975 | 2 |
| D | 0 | 15425 | 2 |
| Mode M9 | |||
|---|---|---|---|
| Quadrant | BADHDUFLAG | Total packets | Discarded packets |
| A | 0 | 17 | 0 |
| B | 0 | 17 | 0 |
| C | 0 | 17 | 0 |
| D | 0 | 18 | 0 |
| Mode SS | |||
|---|---|---|---|
| Quadrant | BADHDUFLAG | Total packets | Discarded packets |
| A | 0 | 134 | 0 |
| B | 0 | 134 | 0 |
| C | 0 | 134 | 0 |
| D | 0 | 134 | 0 |
| Quadrant | Total seconds | Saturated seconds | Saturation percentage |
|---|---|---|---|
| A | 6541 | 30 | 0.458645% |
| B | 6541 | 48 | 0.733833% |
| C | 6541 | 20 | 0.305764% |
| D | 6541 | 64 | 0.978444% |
Noise dominated data is calculated using 1-second bins in cleaned event files. If a bin has >2000 counts, and if more than 50% of those come from <1% of pixels, then it is considered to be noise-dominated and hence unusable.
| Quadrant | # 1 sec bins | Bins with >0 counts | Bins with >2000 counts | High rate bins dominated by noise | Noise dominated (total time) | Noise dominated (detector-on time) | Marked lightcurve |
|---|---|---|---|---|---|---|---|
| A | 7597 | 6543 | 2 | 2 | 0.03% | 0.03% | 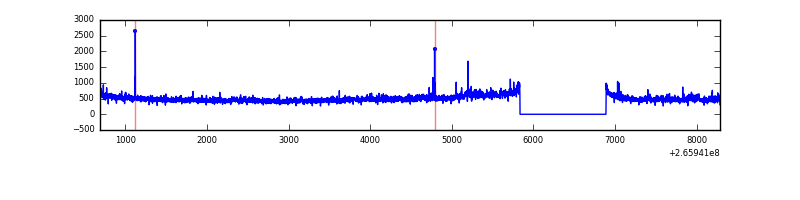 |
| B | 7597 | 6543 | 2 | 2 | 0.03% | 0.03% | 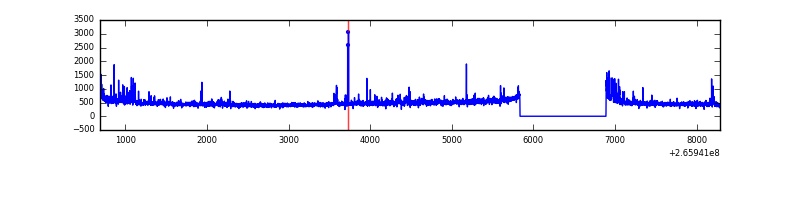 |
| C | 7597 | 6543 | 0 | 0 | 0.00% | 0.00% | 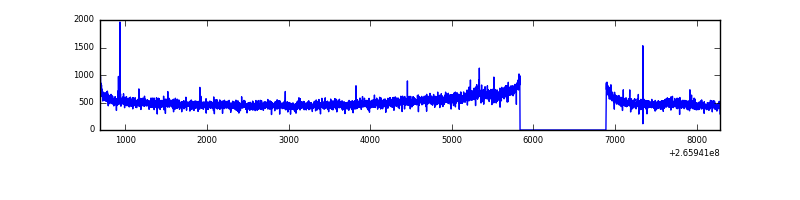 |
| D | 7597 | 6543 | 35 | 35 | 0.46% | 0.53% | 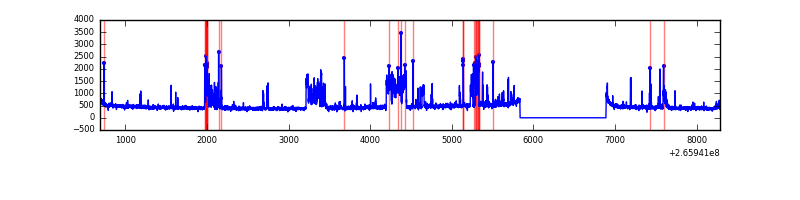 |
Top three noisy pixels from each quadrant. If the there are fewer than three noisy pixels in the level2.evt file, extra rows are filled as -1
| Pixel properties | Quadrant properties | ||||||
|---|---|---|---|---|---|---|---|
| Quadrant | DetID | PixID | Counts | Sigma | Mean | Median | Sigma |
| A | 8 | 15 | 261092 | 1684.11 | 761 | 744 | 154.6 |
| A | 12 | 189 | 31208 | 197.06 | 761 | 744 | 154.6 |
| A | 4 | 2 | 13224 | 80.73 | 761 | 744 | 154.6 |
| B | 0 | 189 | 75554 | 520.41 | 768 | 749 | 143.7 |
| B | 0 | 219 | 37995 | 259.11 | 768 | 749 | 143.7 |
| B | 10 | 245 | 33016 | 224.48 | 768 | 749 | 143.7 |
| C | 3 | 233 | 368022 | 2132.77 | 748 | 749 | 172.2 |
| C | 13 | 61 | 5343 | 26.68 | 748 | 749 | 172.2 |
| C | 1 | 5 | 1767 | 5.91 | 748 | 749 | 172.2 |
| D | 12 | 110 | 631301 | 3540.2 | 736 | 713 | 178.1 |
| D | 10 | 199 | 86773 | 483.15 | 736 | 713 | 178.1 |
| D | 2 | 234 | 25086 | 136.83 | 736 | 713 | 178.1 |
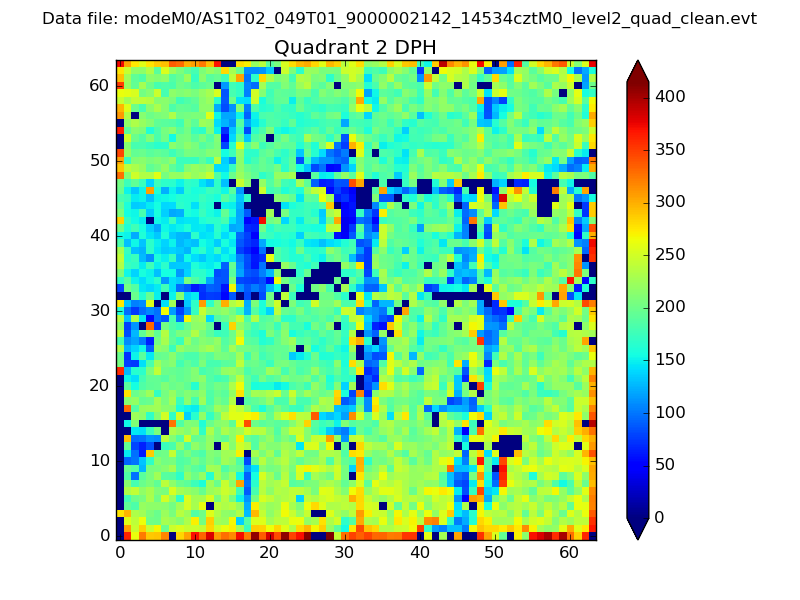
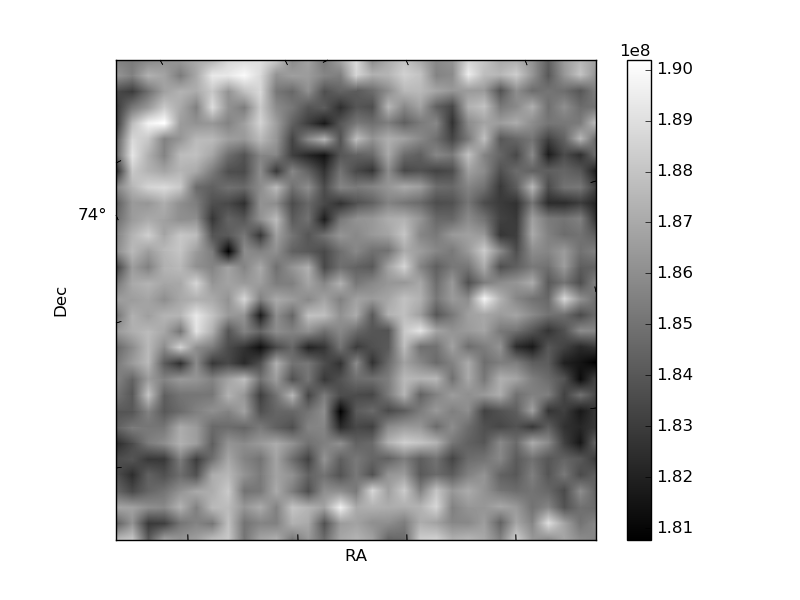
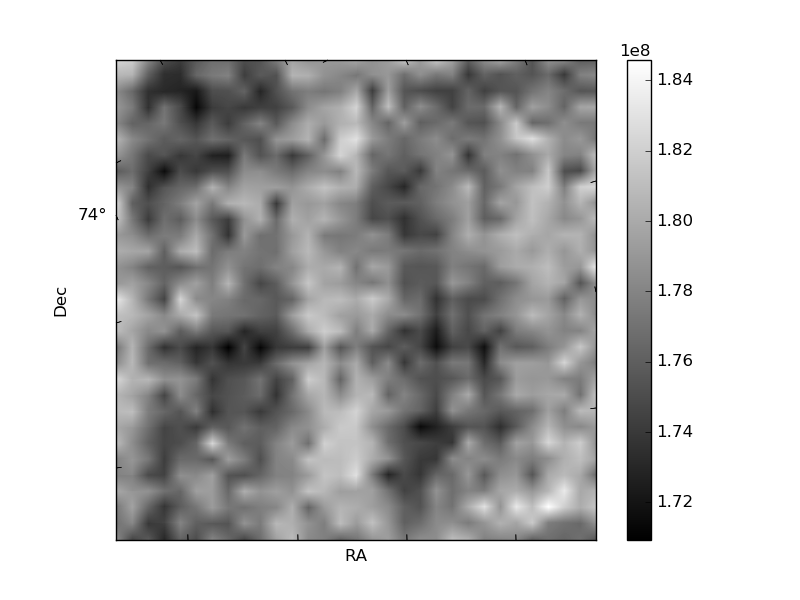
Histogram calculated using DETX and DETY for each event in the final _common_clean file
| Quadrant A |  |
 |
Quadrant B |
|---|---|---|---|
| Quadrant D | 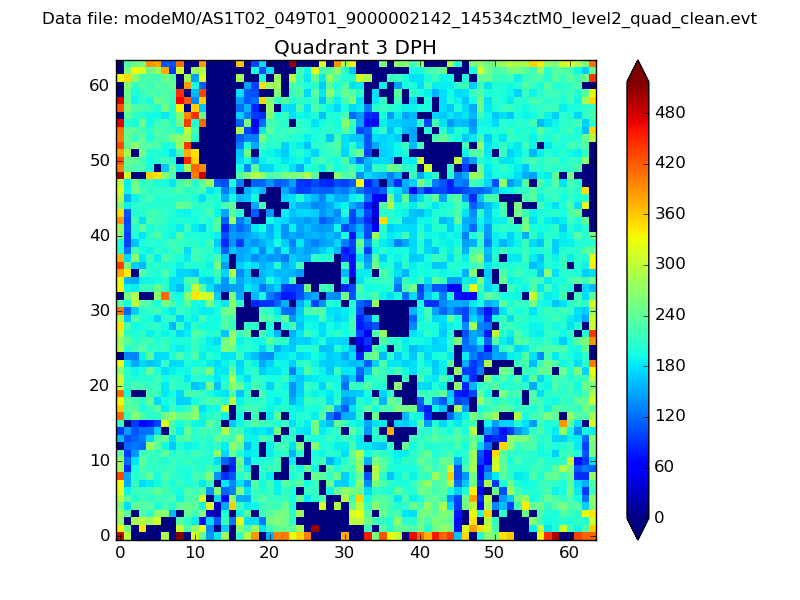 |
 |
Quadrant C |
| Plot type | Count rate plots | Images |
|---|---|---|
| Comparison with Poisson distribution Blue bars denote a histogram of data divided into 1 sec bins. Red curve is a Poisson curve with rate = median count rate of data. |
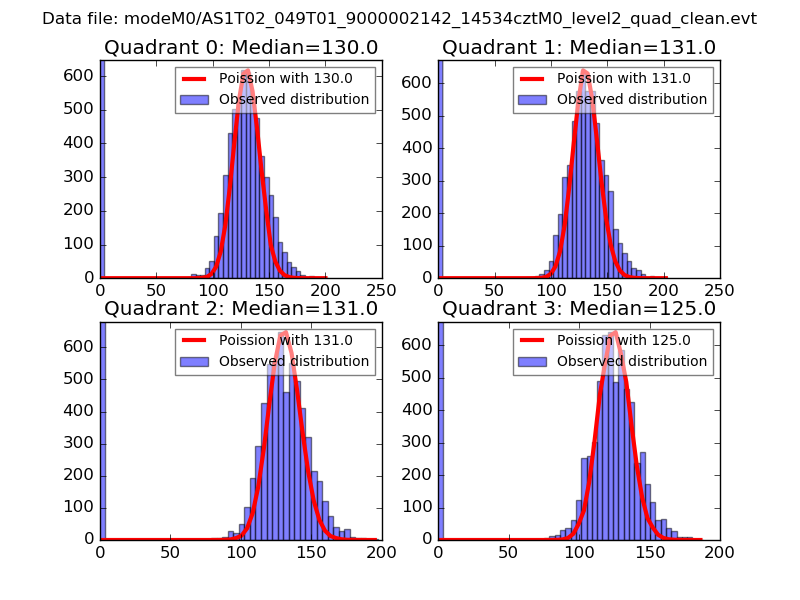 |
 |
| Quadrant-wise count rates Data is divided into 100 sec bins |
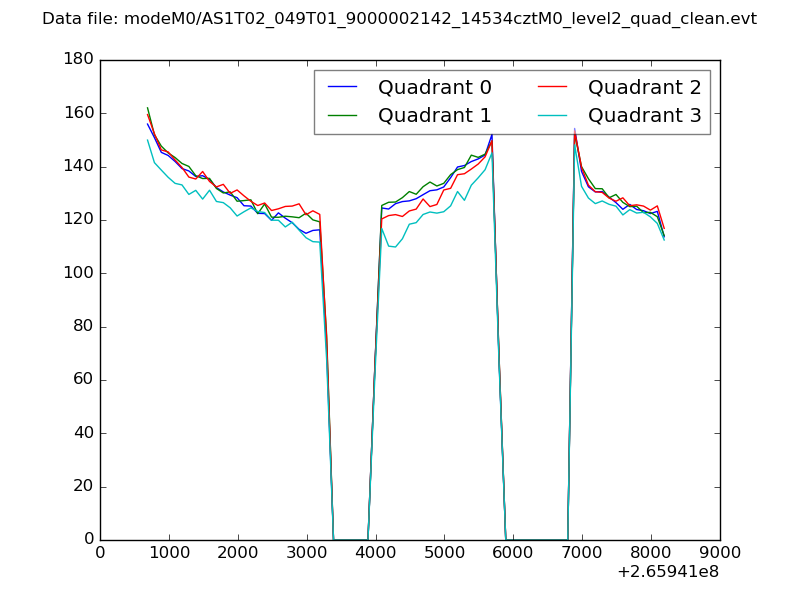 |
|
| Module-wise count rates for Quadrant A Data is divided into 100 sec bins |
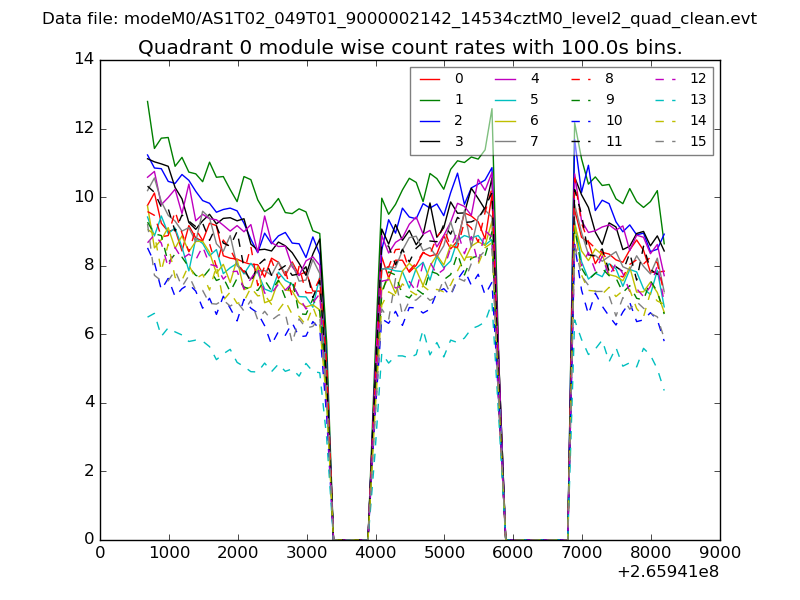 |
 |
| Module-wise count rates for Quadrant B Data is divided into 100 sec bins |
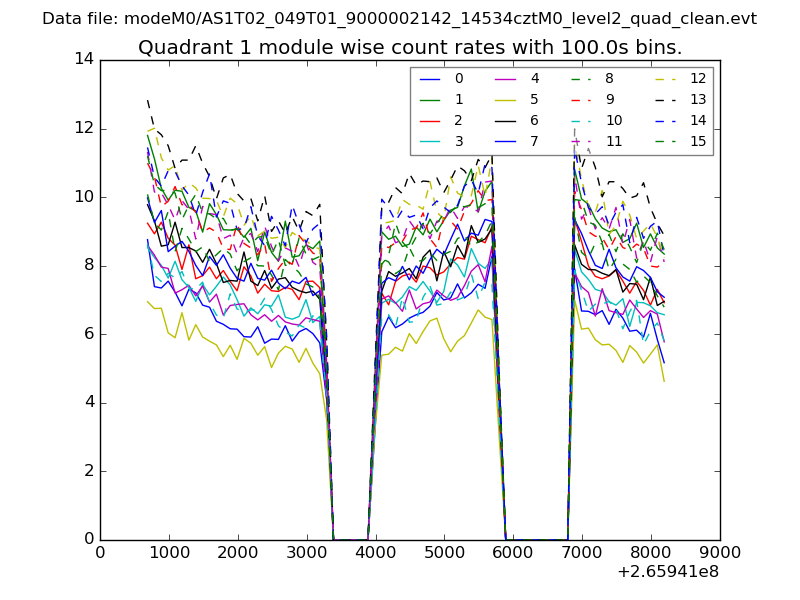 |
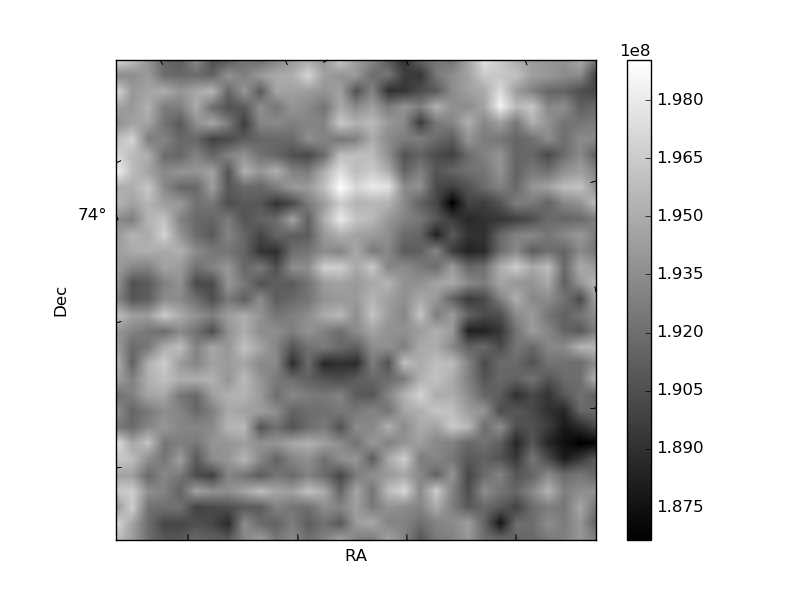 |
| Module-wise count rates for Quadrant C Data is divided into 100 sec bins |
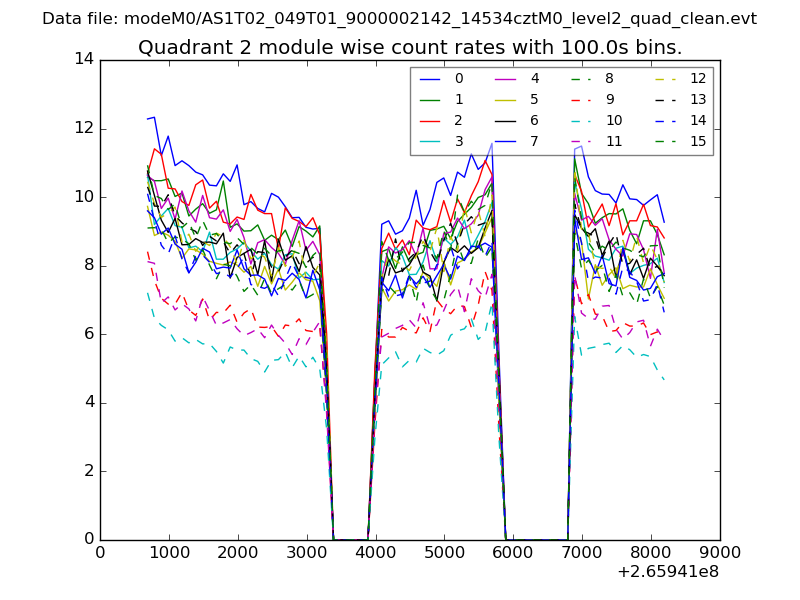 |
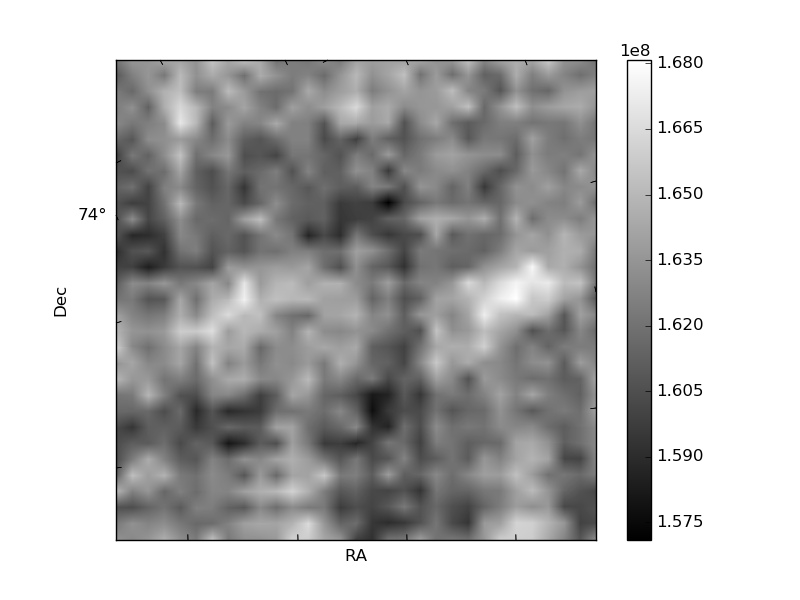 |
| Module-wise count rates for Quadrant D Data is divided into 100 sec bins |
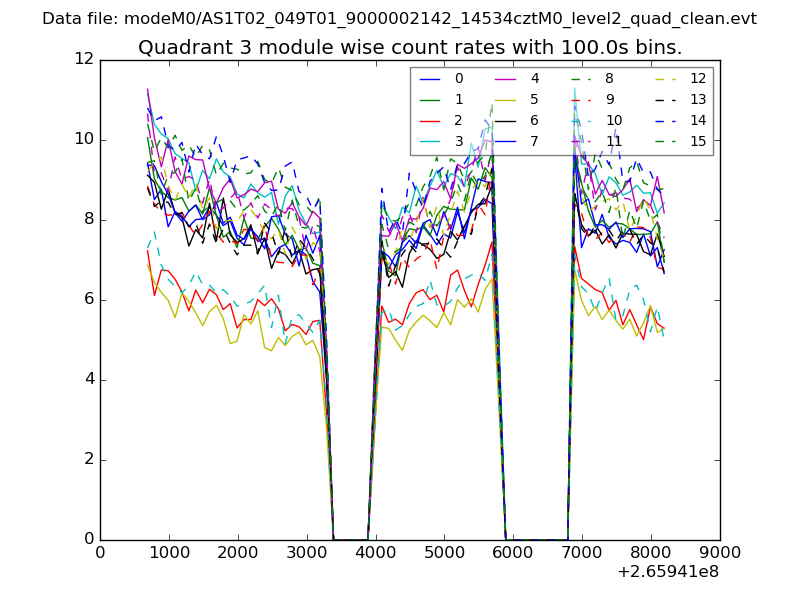 |
 |
| Parameter | Plot |
|---|---|
| CZT HV Monitor | 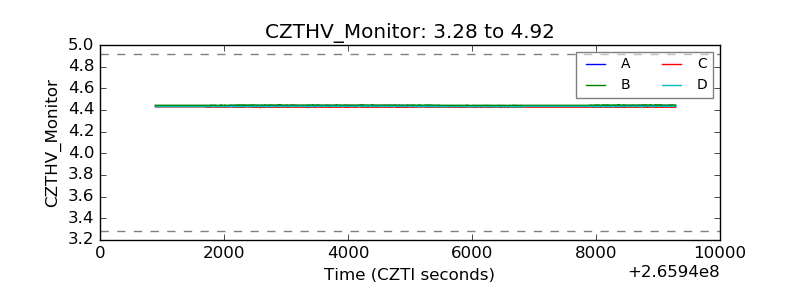 |
| D_VDD | 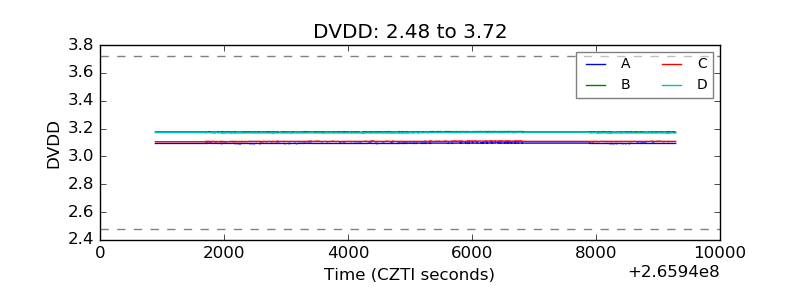 |
| Temperature 1 | 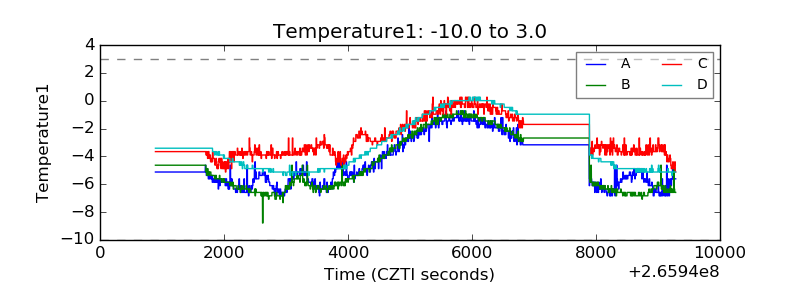 |
| Veto HV Monitor | 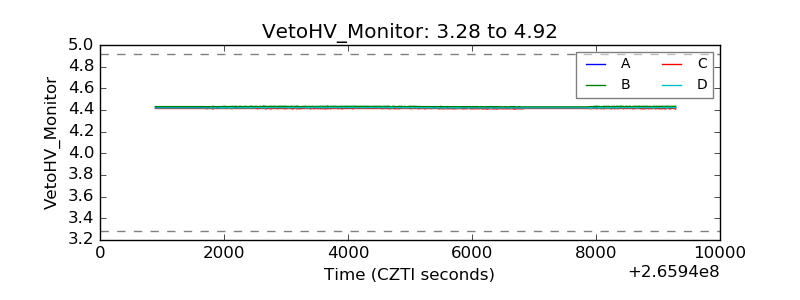 |
| Veto LLD | 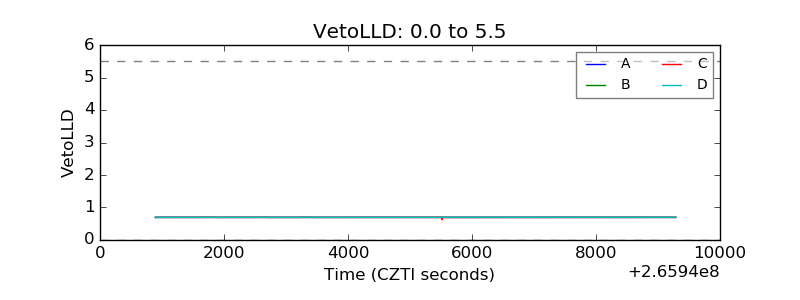 |
| Alpha Counter | 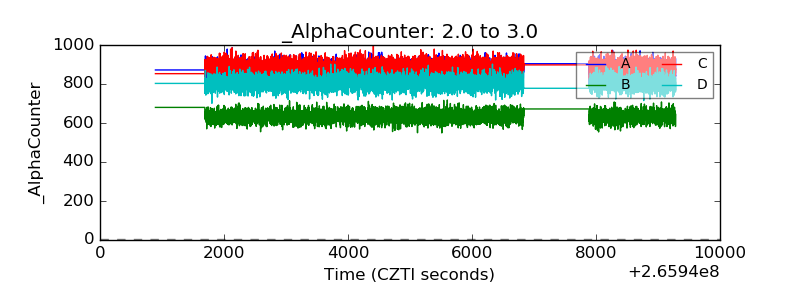 |
| _CPM_Rate |  |
| CZT Counter | 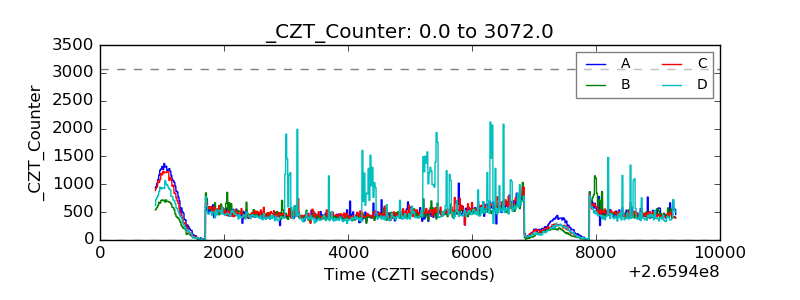 |
| +2.5 Volts monitor |  |
| +5 Volts monitor |  |
| _ROLL_ROT | 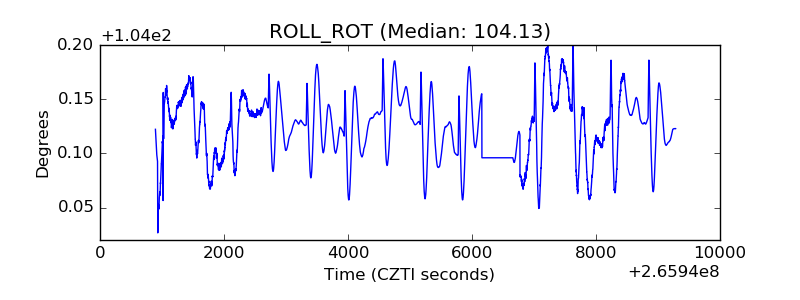 |
| _Roll_DEC |  |
| _Roll_RA | 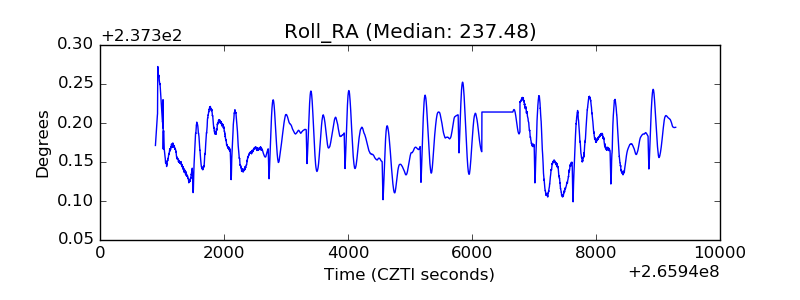 |
| Veto Counter | 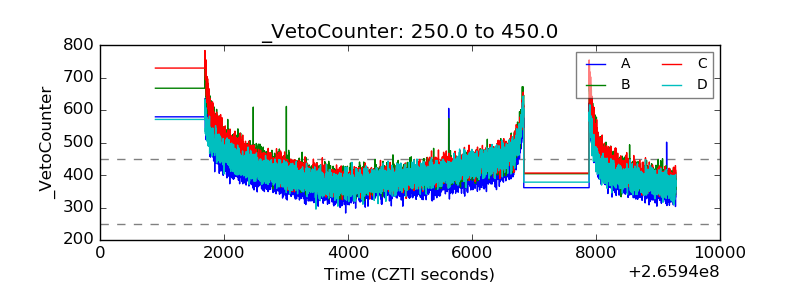 |