| Param | Original file | Final file |
|---|---|---|
| Filename | modeM0/AS1T02_049T01_9000002142_14536cztM0_level2.evt | modeM0/AS1T02_049T01_9000002142_14536cztM0_level2_quad_clean.evt |
| Size (bytes) | 507,502,080 | 115,453,440 |
| Size | 484.0 MB | 110.1 MB |
| Events in quadrant A | 3,518,558 | 760,751 |
| Events in quadrant B | 3,510,214 | 763,700 |
| Events in quadrant C | 3,480,589 | 764,601 |
| Events in quadrant D | 4,388,590 | 723,355 |
| Mode M0 | |||
|---|---|---|---|
| Quadrant | BADHDUFLAG | Total packets | Discarded packets |
| A | 0 | 14985 | 3 |
| B | 0 | 15000 | 2 |
| C | 0 | 14671 | 2 |
| D | 0 | 17975 | 2 |
| Mode M9 | |||
|---|---|---|---|
| Quadrant | BADHDUFLAG | Total packets | Discarded packets |
| A | 0 | 2 | 0 |
| B | 0 | 2 | 0 |
| C | 0 | 2 | 0 |
| D | 0 | 2 | 0 |
| Mode SS | |||
|---|---|---|---|
| Quadrant | BADHDUFLAG | Total packets | Discarded packets |
| A | 0 | 142 | 0 |
| B | 0 | 142 | 0 |
| C | 0 | 142 | 0 |
| D | 0 | 142 | 0 |
| Quadrant | Total seconds | Saturated seconds | Saturation percentage |
|---|---|---|---|
| A | 6946 | 129 | 1.857184% |
| B | 6946 | 169 | 2.433055% |
| C | 6946 | 71 | 1.022171% |
| D | 6946 | 289 | 4.160668% |
Noise dominated data is calculated using 1-second bins in cleaned event files. If a bin has >2000 counts, and if more than 50% of those come from <1% of pixels, then it is considered to be noise-dominated and hence unusable.
| Quadrant | # 1 sec bins | Bins with >0 counts | Bins with >2000 counts | High rate bins dominated by noise | Noise dominated (total time) | Noise dominated (detector-on time) | Marked lightcurve |
|---|---|---|---|---|---|---|---|
| A | 7212 | 6949 | 1 | 1 | 0.01% | 0.01% | 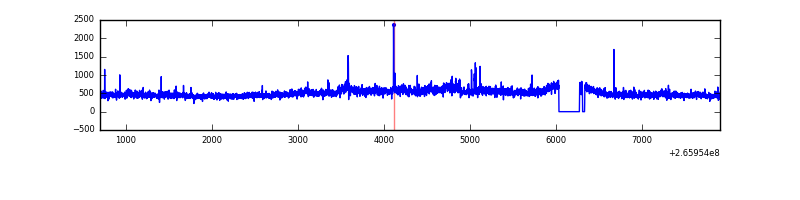 |
| B | 7212 | 6949 | 32 | 32 | 0.44% | 0.46% | 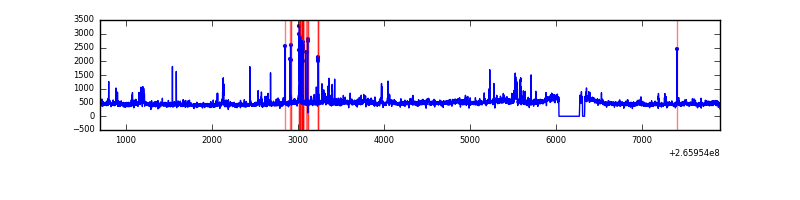 |
| C | 7212 | 6949 | 1 | 1 | 0.01% | 0.01% | 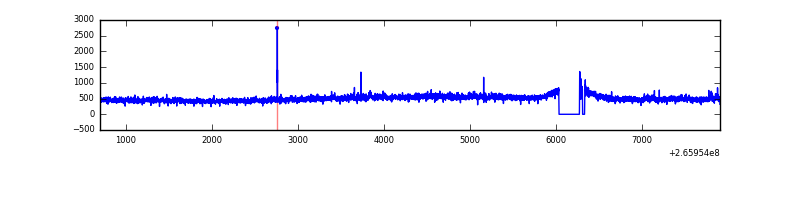 |
| D | 7212 | 6949 | 259 | 259 | 3.59% | 3.73% | 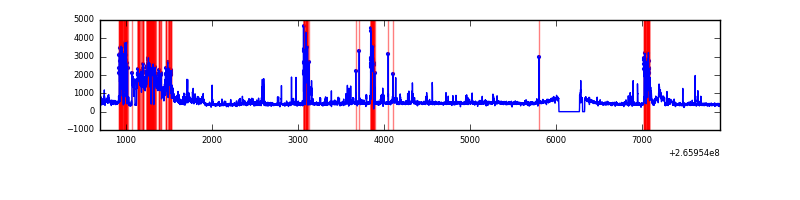 |
Top three noisy pixels from each quadrant. If the there are fewer than three noisy pixels in the level2.evt file, extra rows are filled as -1
| Pixel properties | Quadrant properties | ||||||
|---|---|---|---|---|---|---|---|
| Quadrant | DetID | PixID | Counts | Sigma | Mean | Median | Sigma |
| A | 8 | 15 | 348001 | 2161.09 | 796 | 778 | 160.7 |
| A | 12 | 189 | 78841 | 485.86 | 796 | 778 | 160.7 |
| A | 0 | 23 | 11135 | 64.46 | 796 | 778 | 160.7 |
| B | 0 | 85 | 132470 | 864.46 | 799 | 777 | 152.3 |
| B | 0 | 189 | 78381 | 509.41 | 799 | 777 | 152.3 |
| B | 0 | 219 | 48378 | 312.46 | 799 | 777 | 152.3 |
| C | 3 | 233 | 440997 | 2460.37 | 777 | 780 | 178.9 |
| C | 13 | 61 | 5660 | 27.27 | 777 | 780 | 178.9 |
| C | 14 | 234 | 5057 | 23.9 | 777 | 780 | 178.9 |
| D | 12 | 110 | 832039 | 4504.54 | 765 | 743 | 184.5 |
| D | 10 | 199 | 331663 | 1793.16 | 765 | 743 | 184.5 |
| D | 15 | 0 | 143198 | 771.92 | 765 | 743 | 184.5 |
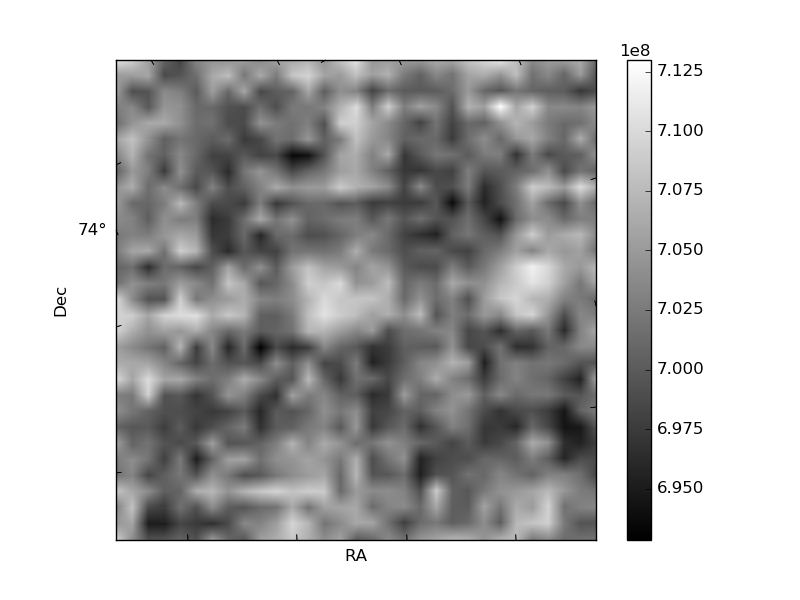
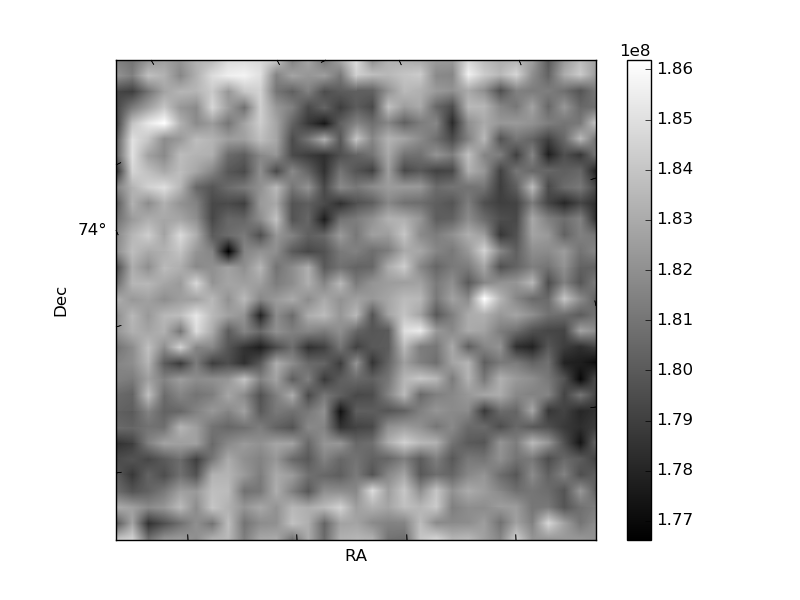
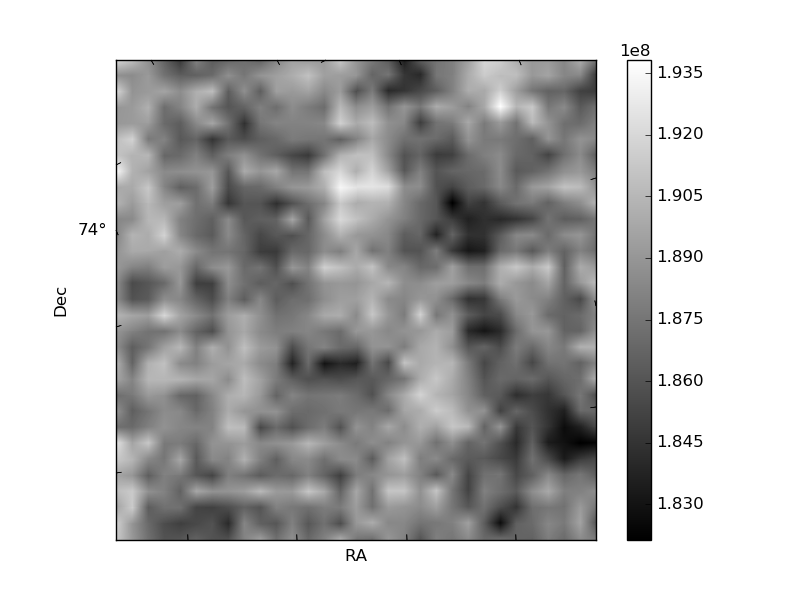
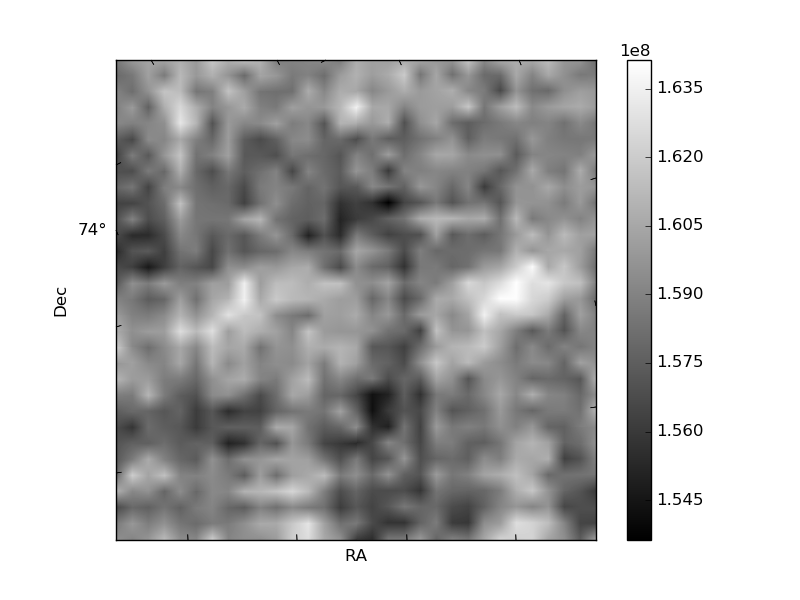
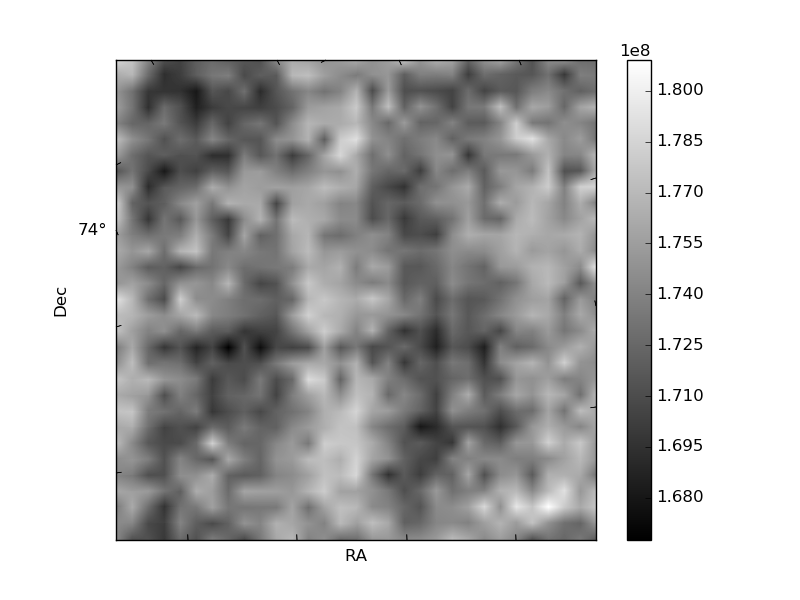
Histogram calculated using DETX and DETY for each event in the final _common_clean file
| Quadrant A | 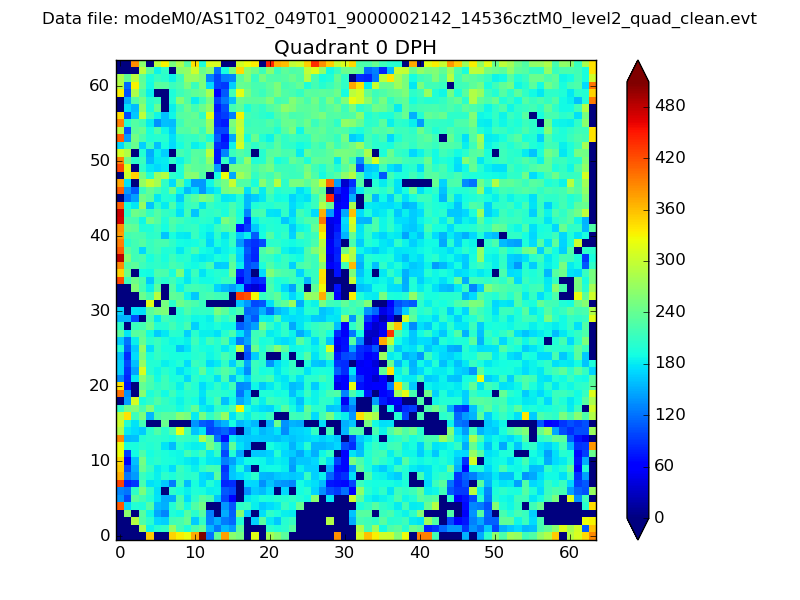 |
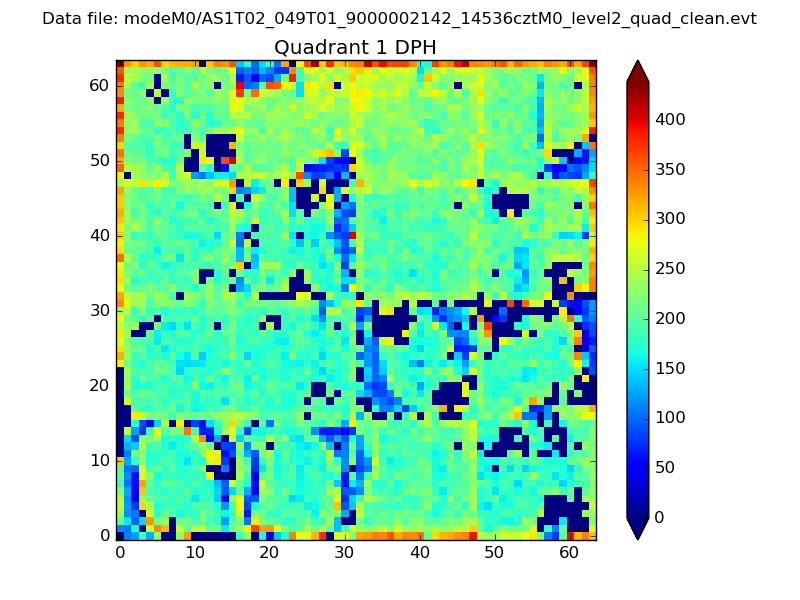 |
Quadrant B |
|---|---|---|---|
| Quadrant D | 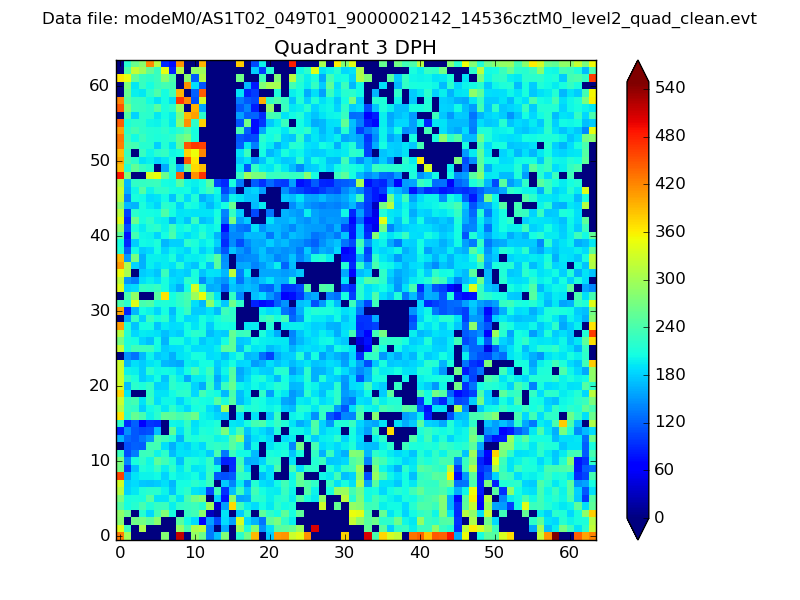 |
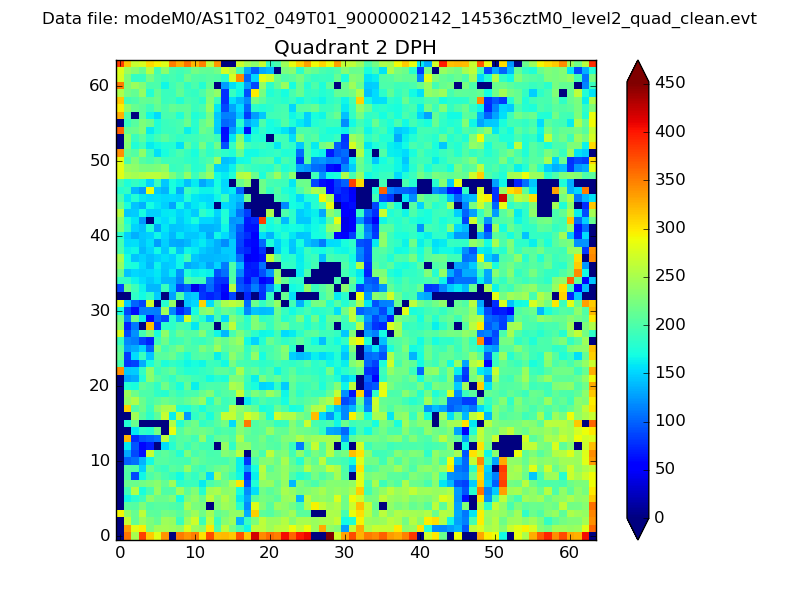 |
Quadrant C |
| Plot type | Count rate plots | Images |
|---|---|---|
| Comparison with Poisson distribution Blue bars denote a histogram of data divided into 1 sec bins. Red curve is a Poisson curve with rate = median count rate of data. |
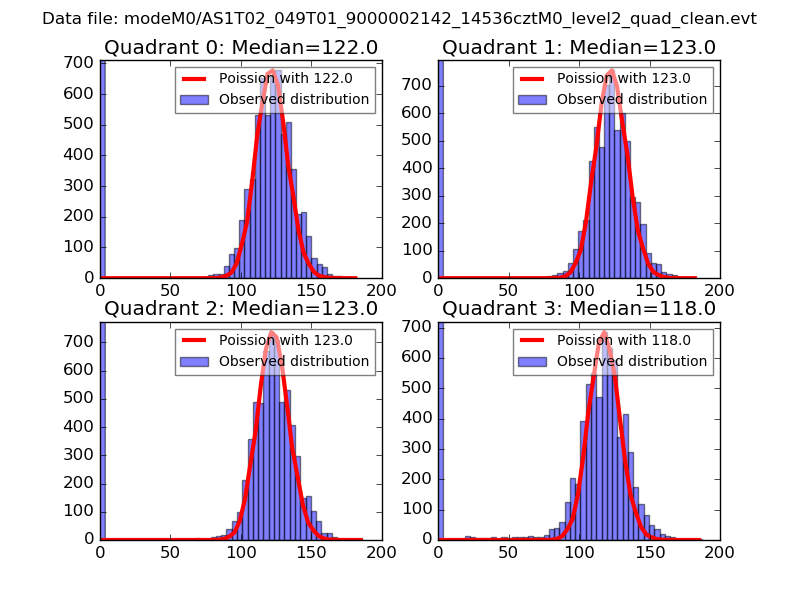 |
 |
| Quadrant-wise count rates Data is divided into 100 sec bins |
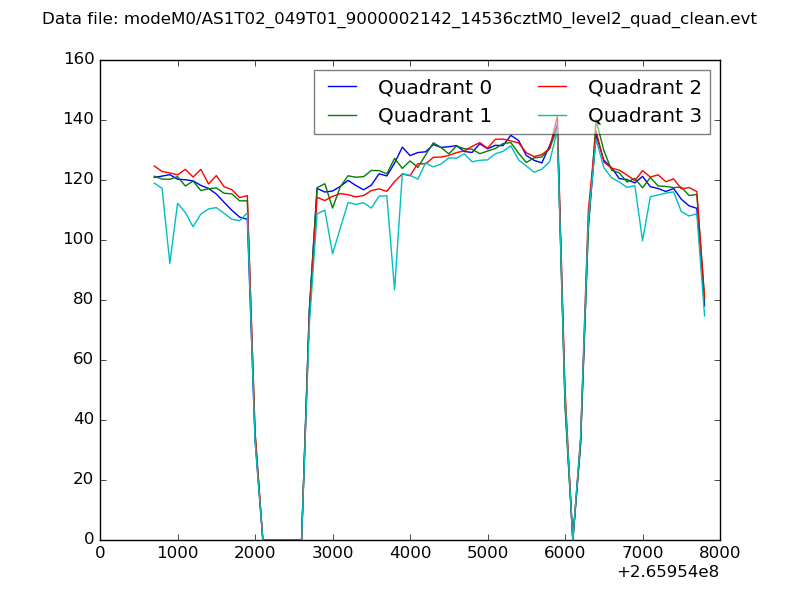 |
|
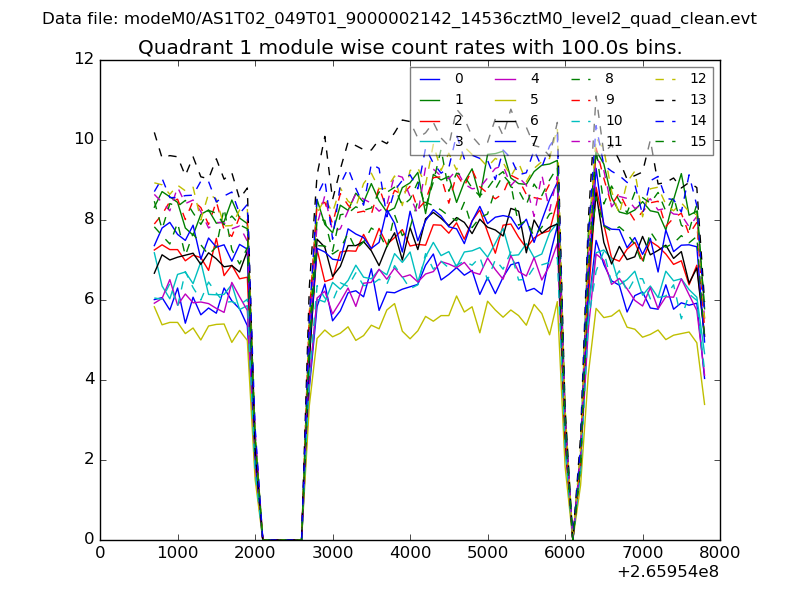
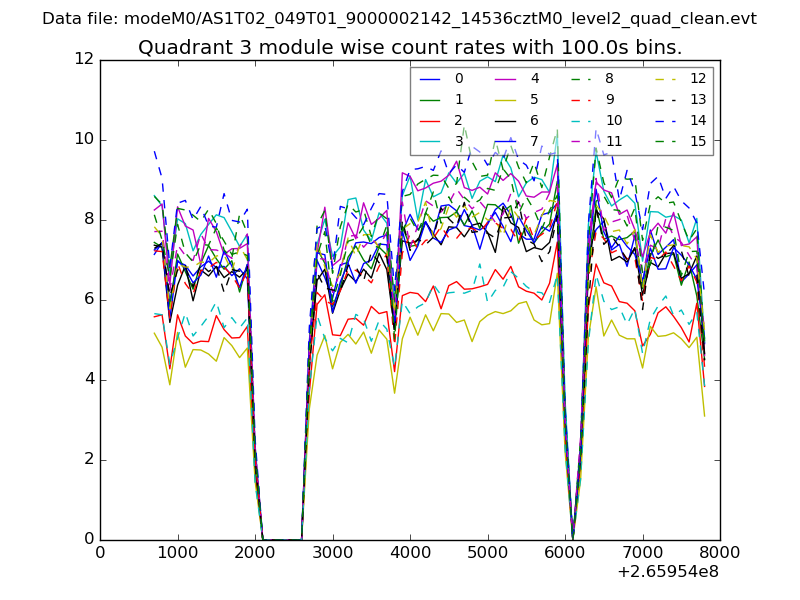
| Module-wise count rates for Quadrant A Data is divided into 100 sec bins |
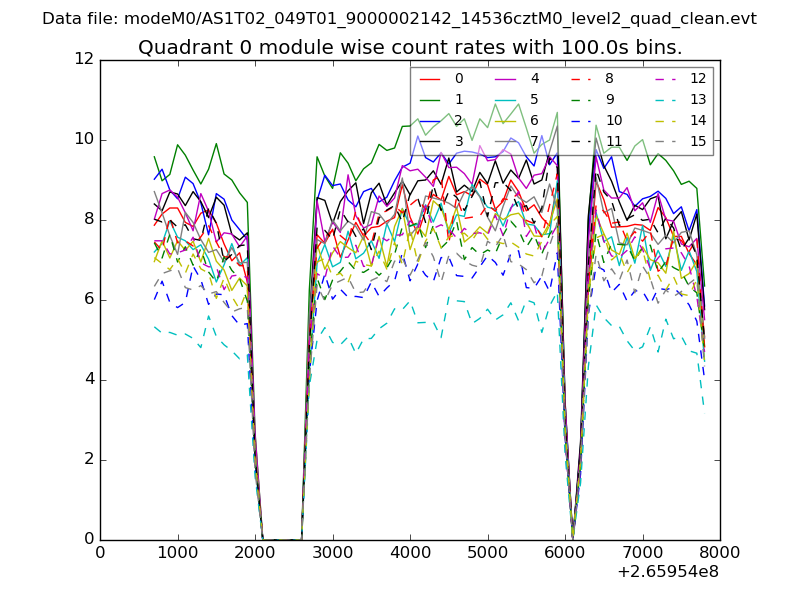 |
 |
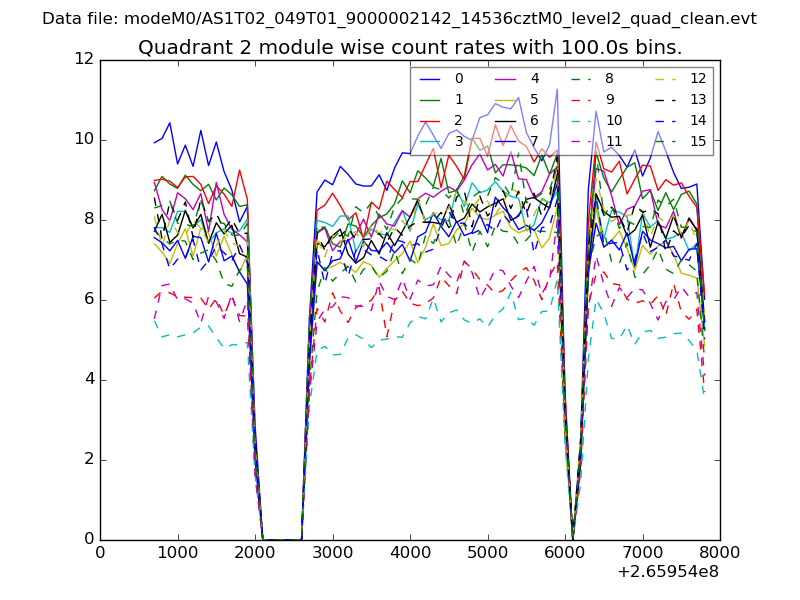
| Module-wise count rates for Quadrant B Data is divided into 100 sec bins |
 |
 |
| Module-wise count rates for Quadrant C Data is divided into 100 sec bins |
 |
 |
| Module-wise count rates for Quadrant D Data is divided into 100 sec bins |
 |
 |
| Parameter | Plot |
|---|---|
| CZT HV Monitor | 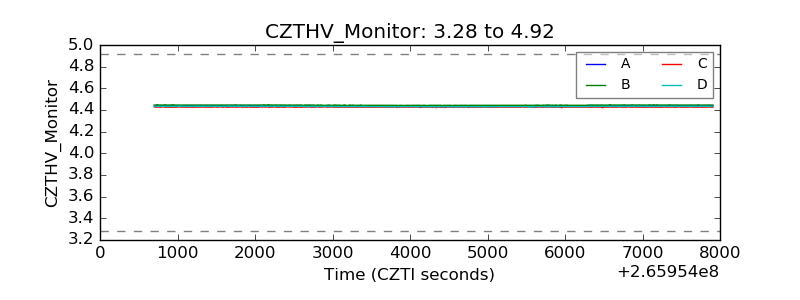 |
| D_VDD | 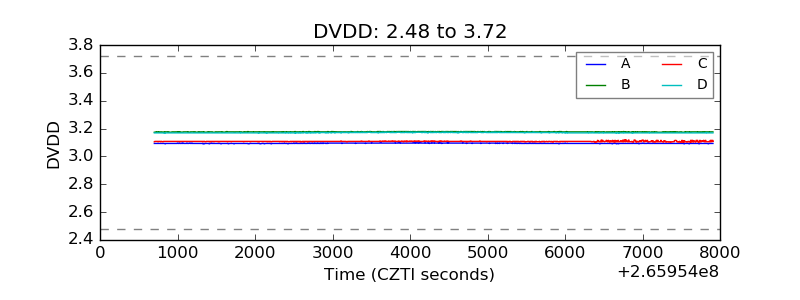 |
| Temperature 1 | 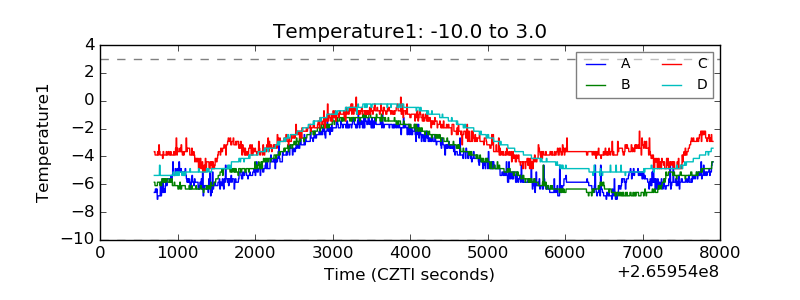 |
| Veto HV Monitor |  |
| Veto LLD | 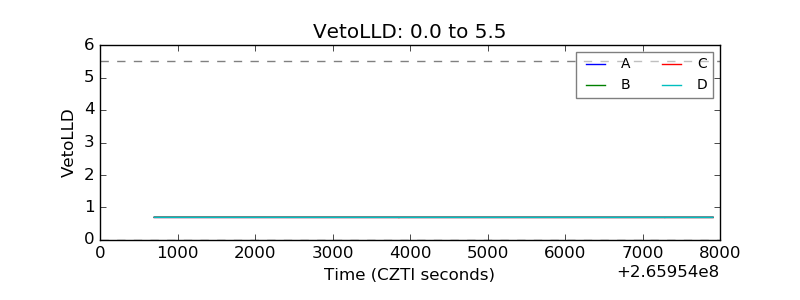 |
| Alpha Counter | 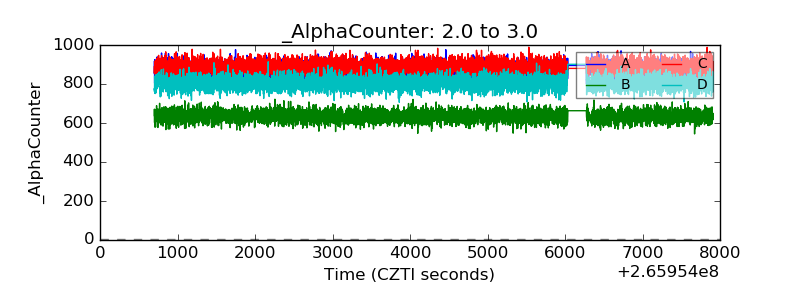 |
| _CPM_Rate | 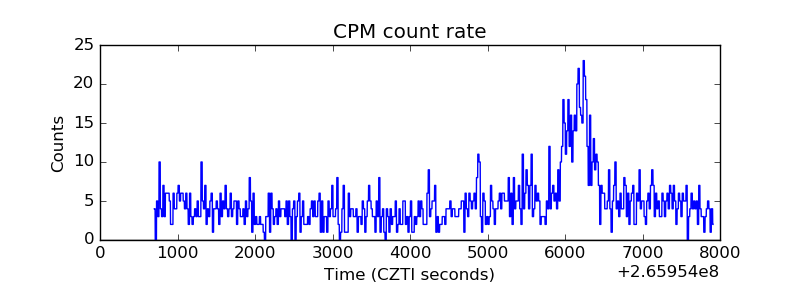 |
| CZT Counter | 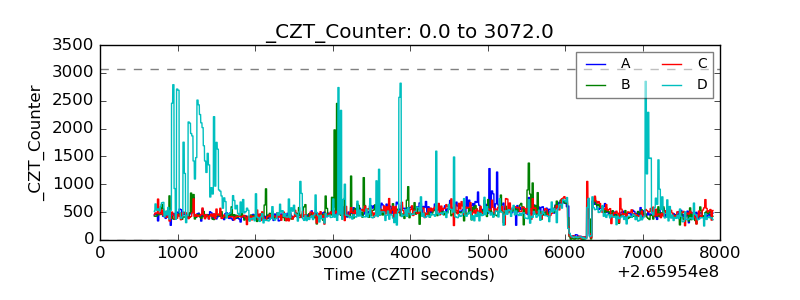 |
| +2.5 Volts monitor | 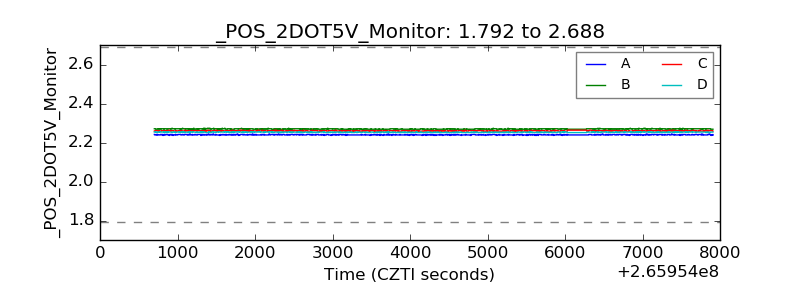 |
| +5 Volts monitor |  |
| _ROLL_ROT | 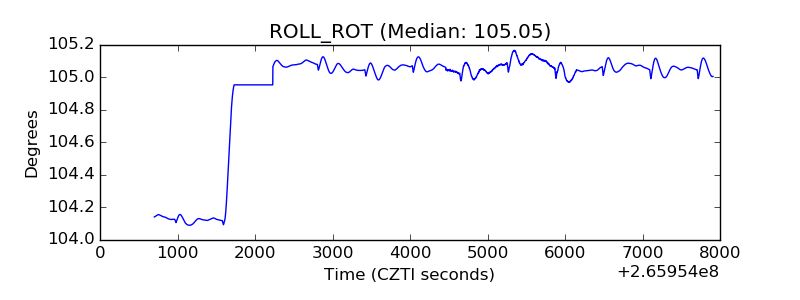 |
| _Roll_DEC | 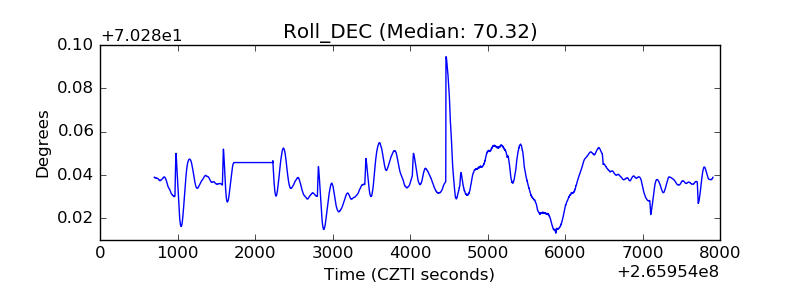 |
| _Roll_RA | 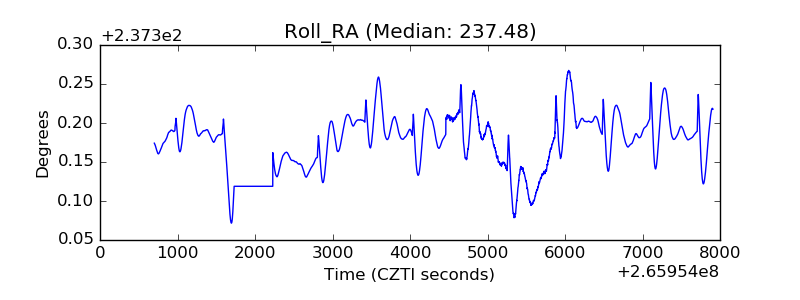 |
| Veto Counter | 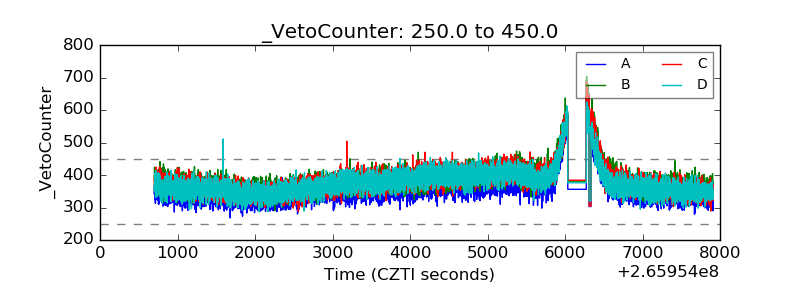 |