| Param | Original file | Final file |
|---|---|---|
| Filename | modeM0/AS1T02_049T01_9000002142_14537cztM0_level2.evt | modeM0/AS1T02_049T01_9000002142_14537cztM0_level2_quad_clean.evt |
| Size (bytes) | 522,005,760 | 117,740,160 |
| Size | 497.8 MB | 112.3 MB |
| Events in quadrant A | 3,726,457 | 767,085 |
| Events in quadrant B | 3,764,353 | 770,051 |
| Events in quadrant C | 4,195,401 | 766,934 |
| Events in quadrant D | 3,614,884 | 741,442 |
| Mode M0 | |||
|---|---|---|---|
| Quadrant | BADHDUFLAG | Total packets | Discarded packets |
| A | 0 | 15969 | 3 |
| B | 0 | 15998 | 2 |
| C | 0 | 17024 | 2 |
| D | 0 | 16254 | 2 |
| Mode M9 | |||
|---|---|---|---|
| Quadrant | BADHDUFLAG | Total packets | Discarded packets |
| A | 0 | 1 | 0 |
| B | 0 | 1 | 0 |
| C | 0 | 1 | 0 |
| D | 0 | 1 | 0 |
| Mode SS | |||
|---|---|---|---|
| Quadrant | BADHDUFLAG | Total packets | Discarded packets |
| A | 0 | 152 | 0 |
| B | 0 | 152 | 0 |
| C | 0 | 152 | 0 |
| D | 0 | 152 | 0 |
| Quadrant | Total seconds | Saturated seconds | Saturation percentage |
|---|---|---|---|
| A | 7475 | 140 | 1.872910% |
| B | 7475 | 180 | 2.408027% |
| C | 7475 | 159 | 2.127090% |
| D | 7475 | 121 | 1.618729% |
Noise dominated data is calculated using 1-second bins in cleaned event files. If a bin has >2000 counts, and if more than 50% of those come from <1% of pixels, then it is considered to be noise-dominated and hence unusable.
| Quadrant | # 1 sec bins | Bins with >0 counts | Bins with >2000 counts | High rate bins dominated by noise | Noise dominated (total time) | Noise dominated (detector-on time) | Marked lightcurve |
|---|---|---|---|---|---|---|---|
| A | 7661 | 7479 | 1 | 1 | 0.01% | 0.01% | 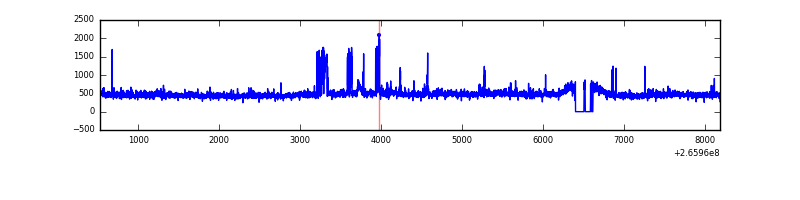 |
| B | 7661 | 7479 | 22 | 22 | 0.29% | 0.29% | 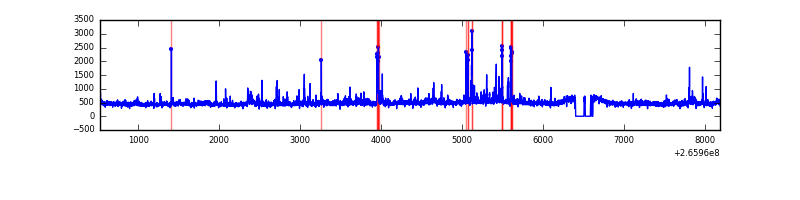 |
| C | 7661 | 7479 | 39 | 39 | 0.51% | 0.52% | 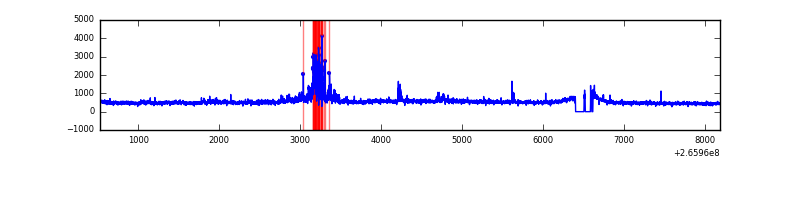 |
| D | 7661 | 7479 | 46 | 46 | 0.60% | 0.62% | 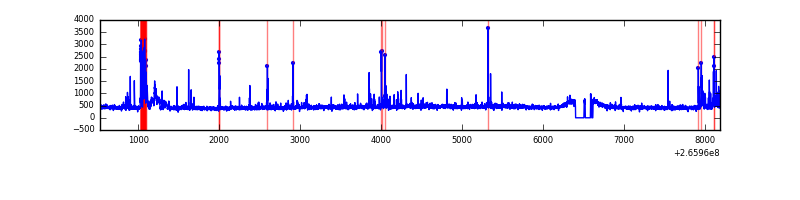 |
Top three noisy pixels from each quadrant. If the there are fewer than three noisy pixels in the level2.evt file, extra rows are filled as -1
| Pixel properties | Quadrant properties | ||||||
|---|---|---|---|---|---|---|---|
| Quadrant | DetID | PixID | Counts | Sigma | Mean | Median | Sigma |
| A | 0 | 23 | 193788 | 1097.61 | 858 | 837 | 175.8 |
| A | 8 | 15 | 167699 | 949.2 | 858 | 837 | 175.8 |
| A | 12 | 189 | 44321 | 247.36 | 858 | 837 | 175.8 |
| B | 4 | 142 | 81312 | 491.23 | 861 | 838 | 163.8 |
| B | 0 | 189 | 55722 | 335.02 | 861 | 838 | 163.8 |
| B | 0 | 245 | 50218 | 301.43 | 861 | 838 | 163.8 |
| C | 3 | 233 | 907919 | 4709.52 | 835 | 838 | 192.6 |
| C | 14 | 234 | 11295 | 54.29 | 835 | 838 | 192.6 |
| C | 8 | 128 | 9987 | 47.5 | 835 | 838 | 192.6 |
| D | 10 | 199 | 161673 | 802.44 | 829 | 800 | 200.5 |
| D | 12 | 110 | 135066 | 669.73 | 829 | 800 | 200.5 |
| D | 13 | 122 | 58341 | 287.02 | 829 | 800 | 200.5 |
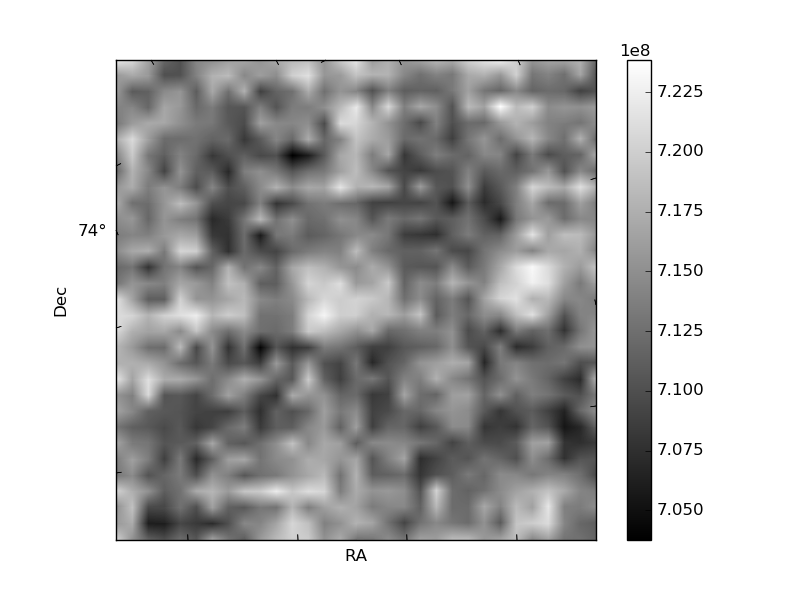
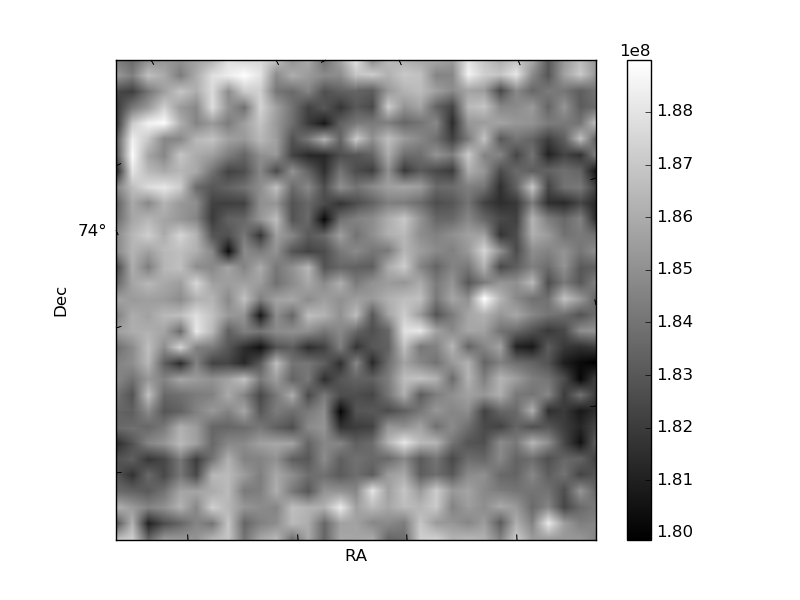
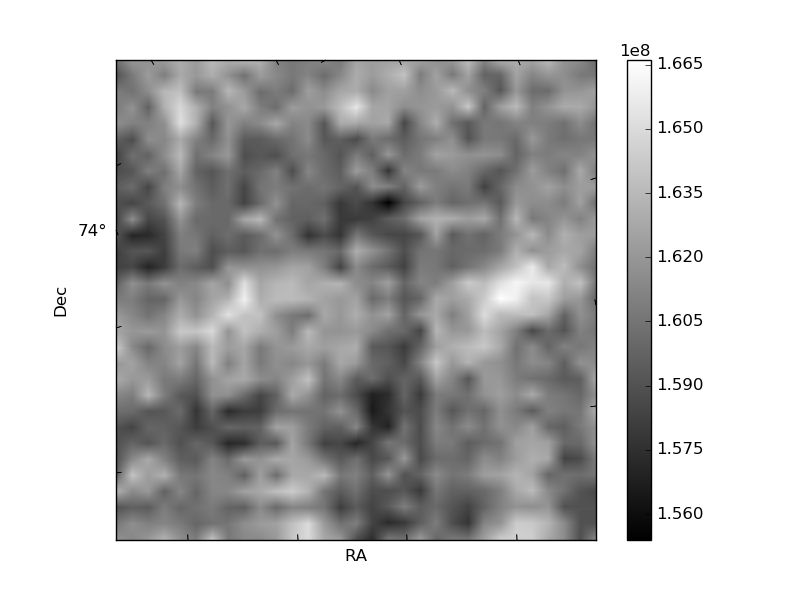
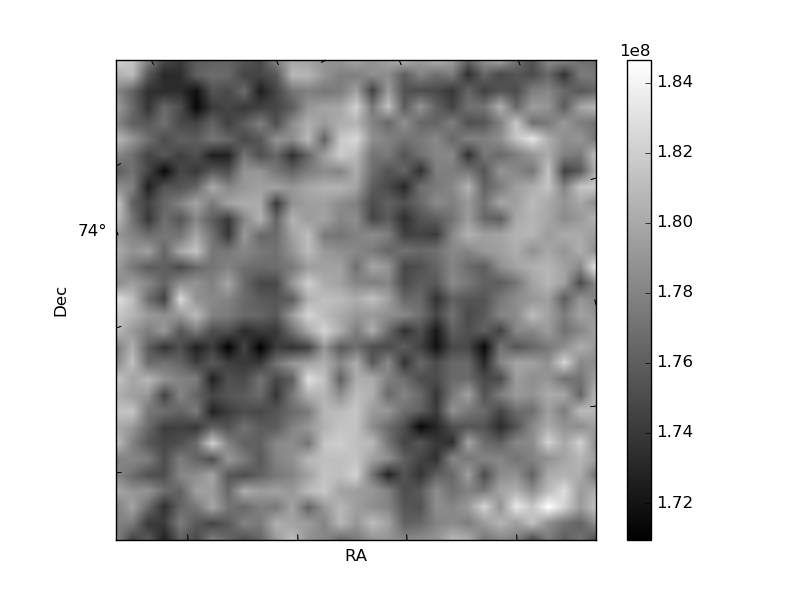
Histogram calculated using DETX and DETY for each event in the final _common_clean file
| Quadrant A | 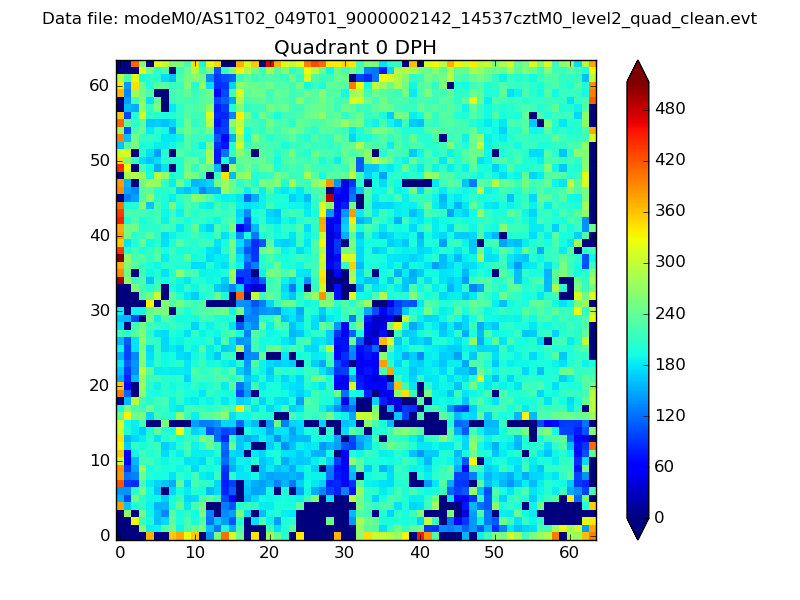 |
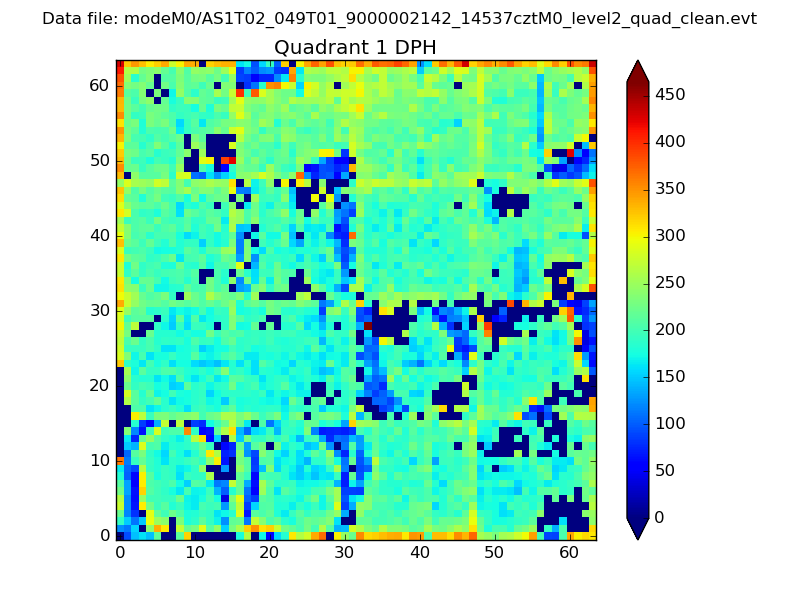 |
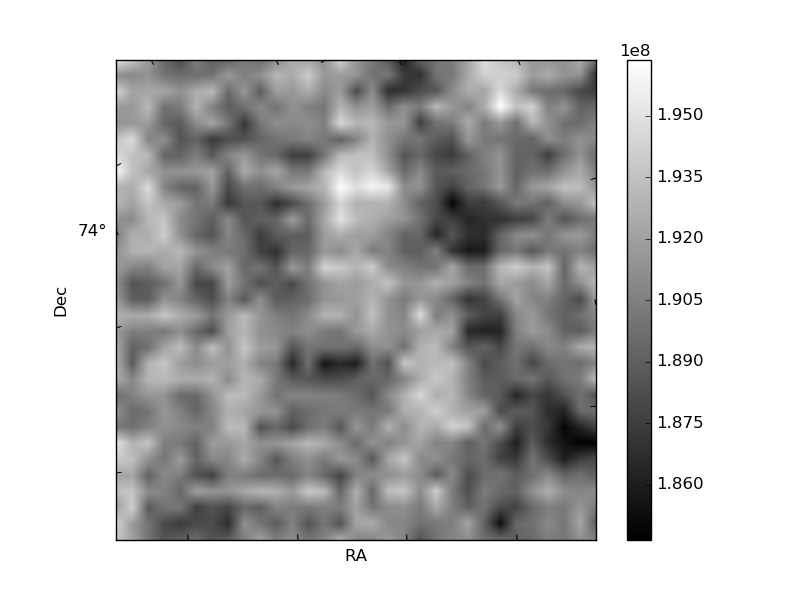
Quadrant B |
|---|---|---|---|
| Quadrant D | 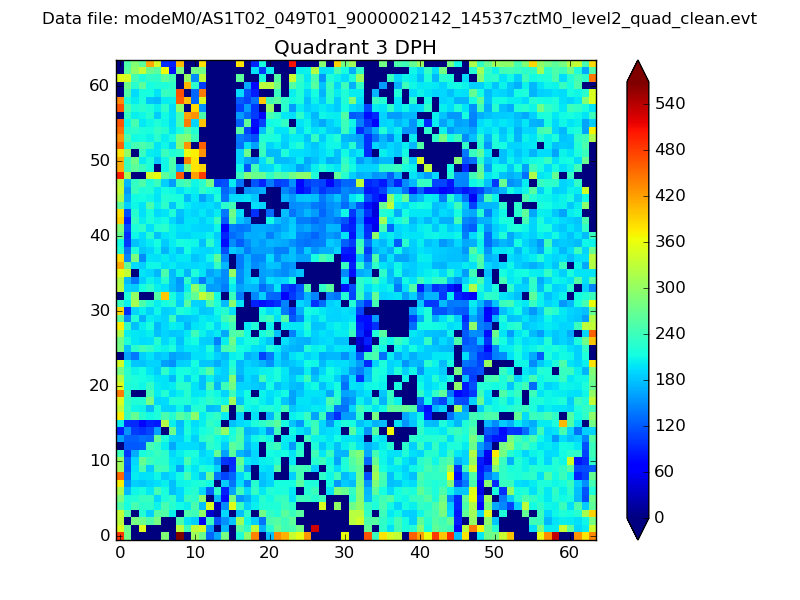 |
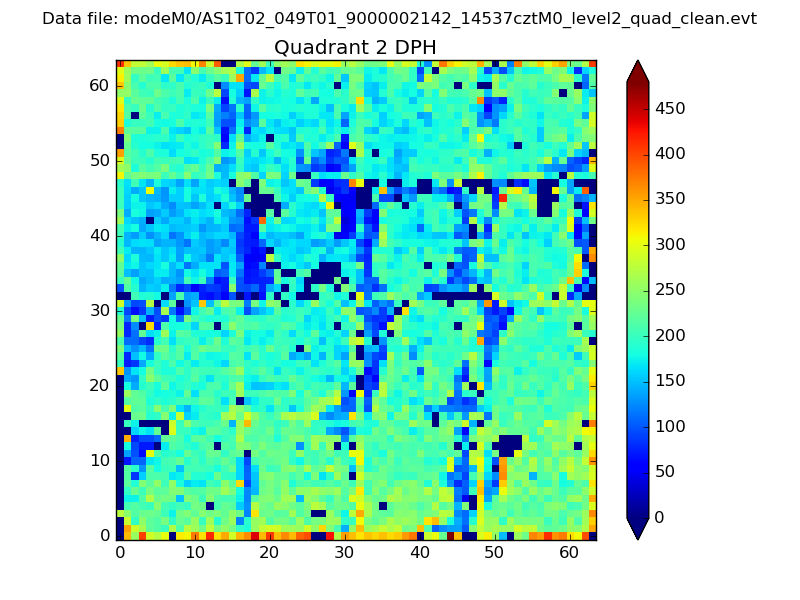 |
Quadrant C |
| Plot type | Count rate plots | Images |
|---|---|---|
| Comparison with Poisson distribution Blue bars denote a histogram of data divided into 1 sec bins. Red curve is a Poisson curve with rate = median count rate of data. |
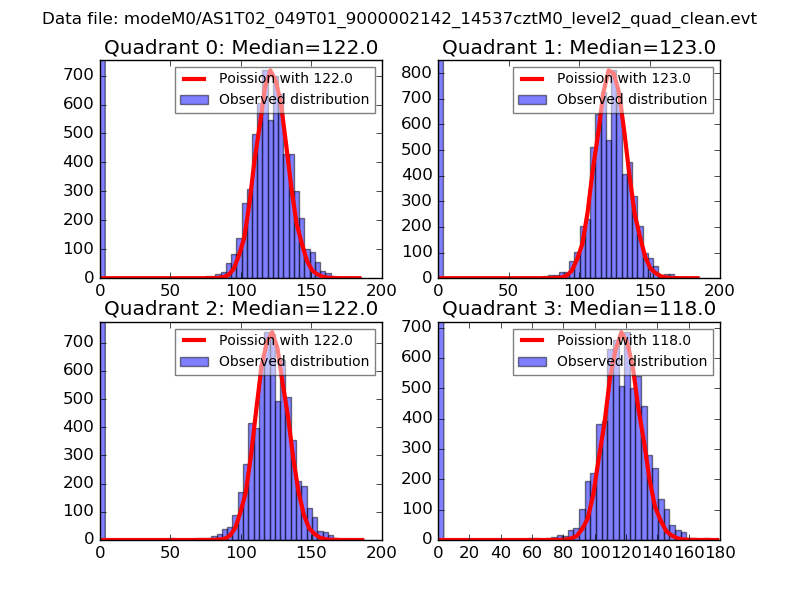 |
 |
| Quadrant-wise count rates Data is divided into 100 sec bins |
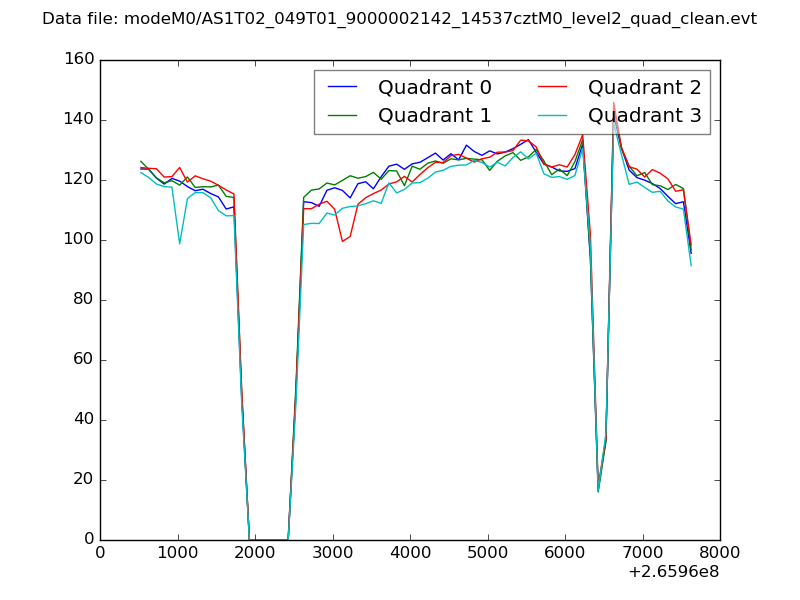 |
|
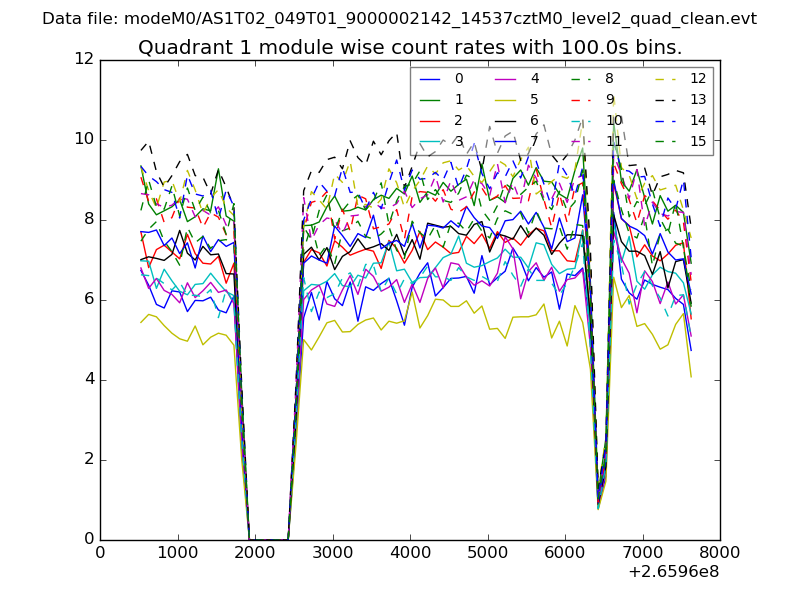
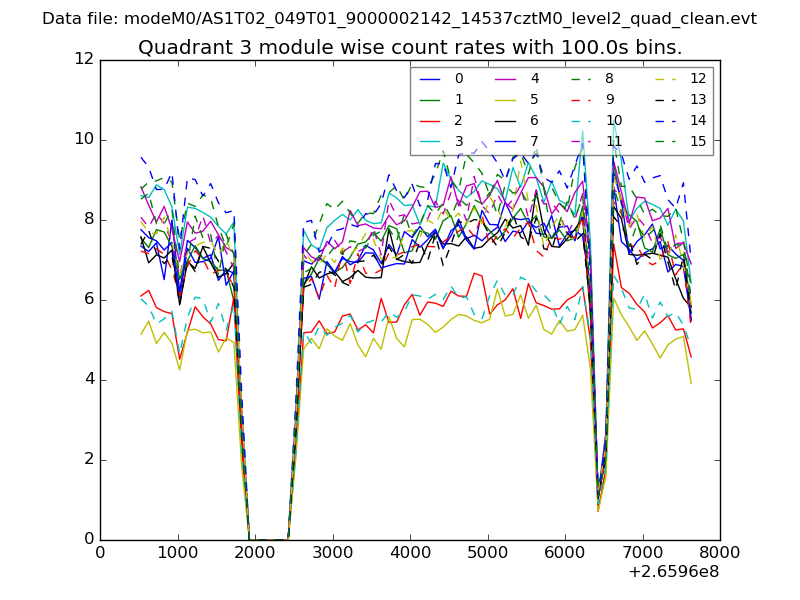
| Module-wise count rates for Quadrant A Data is divided into 100 sec bins |
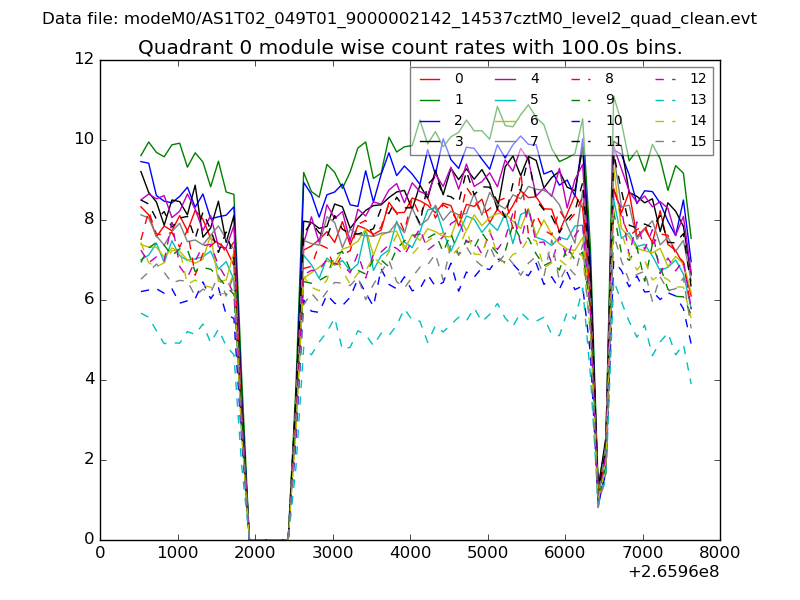 |
 |
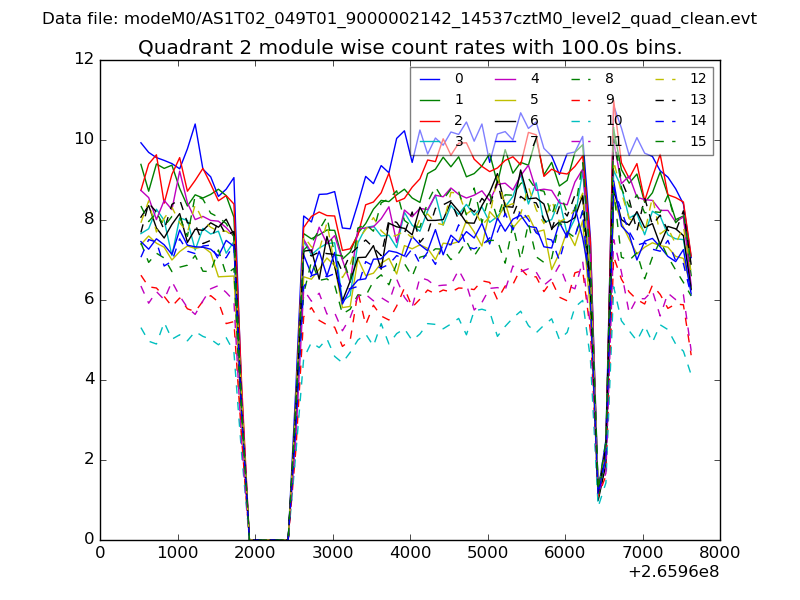
| Module-wise count rates for Quadrant B Data is divided into 100 sec bins |
 |
 |
| Module-wise count rates for Quadrant C Data is divided into 100 sec bins |
 |
 |
| Module-wise count rates for Quadrant D Data is divided into 100 sec bins |
 |
 |
| Parameter | Plot |
|---|---|
| CZT HV Monitor | 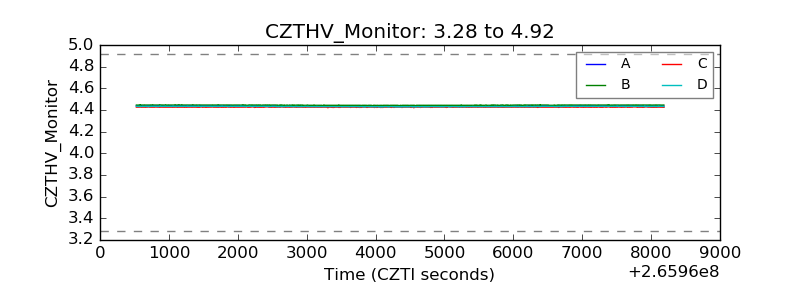 |
| D_VDD | 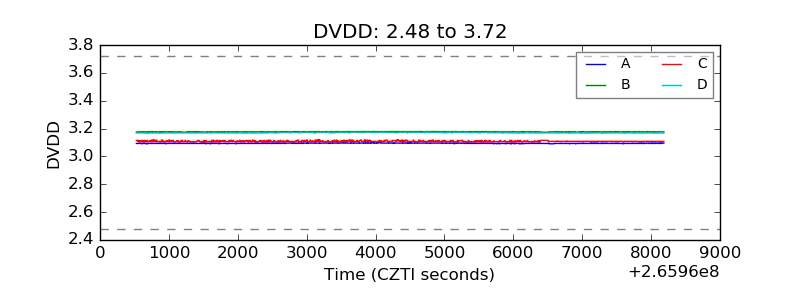 |
| Temperature 1 | 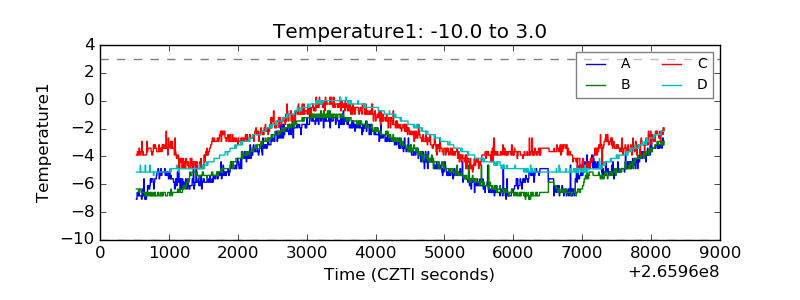 |
| Veto HV Monitor | 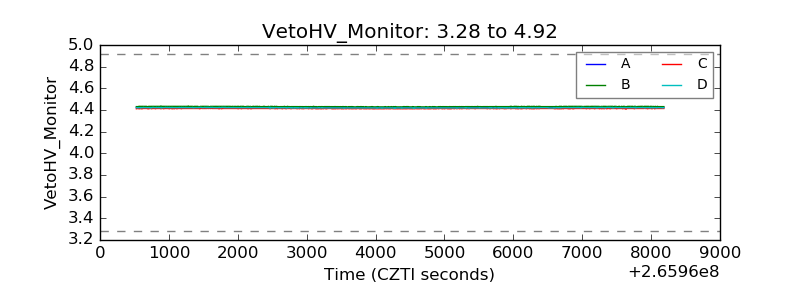 |
| Veto LLD | 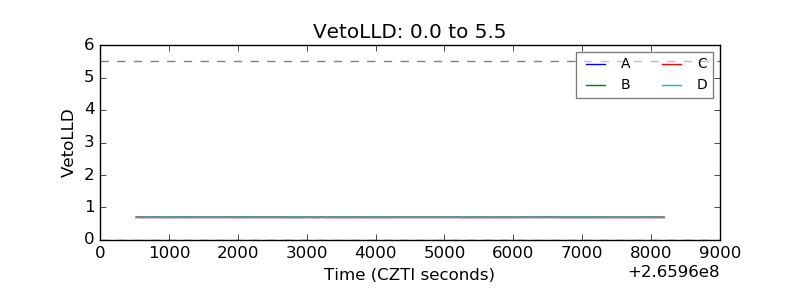 |
| Alpha Counter | 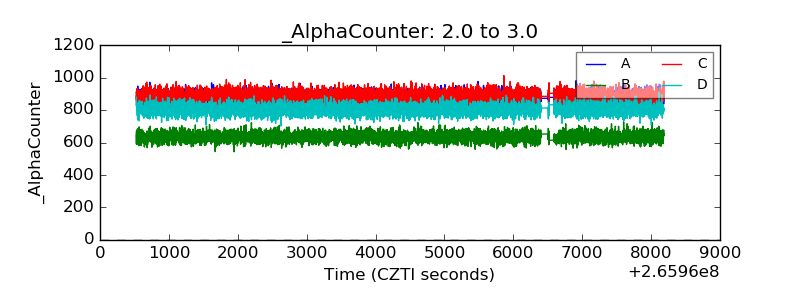 |
| _CPM_Rate | 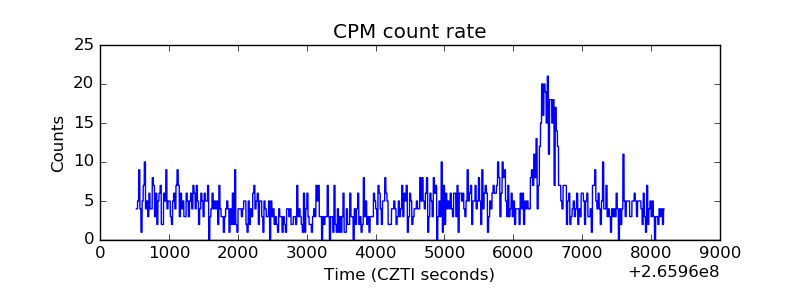 |
| CZT Counter | 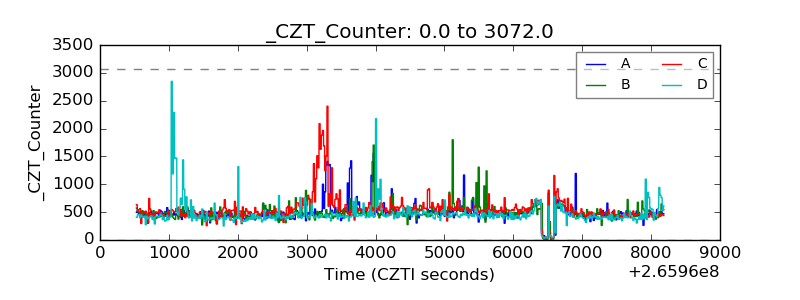 |
| +2.5 Volts monitor |  |
| +5 Volts monitor |  |
| _ROLL_ROT | 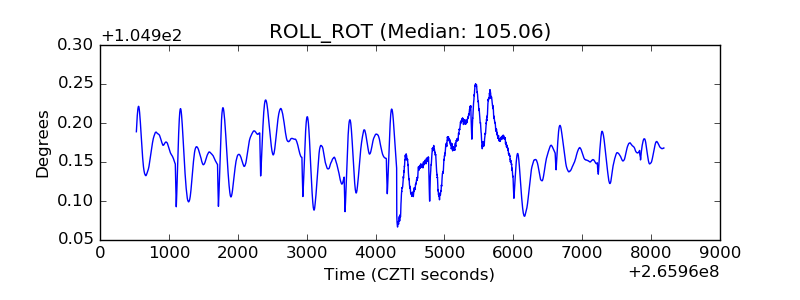 |
| _Roll_DEC | 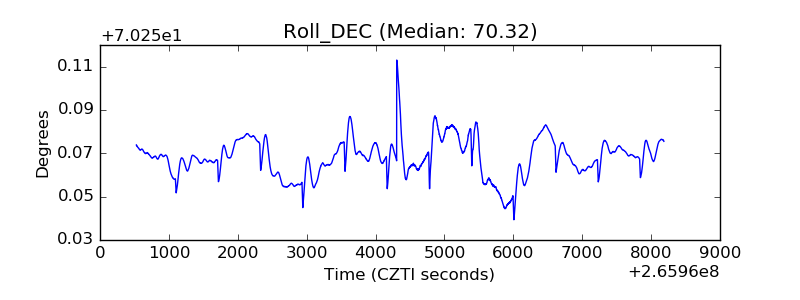 |
| _Roll_RA | 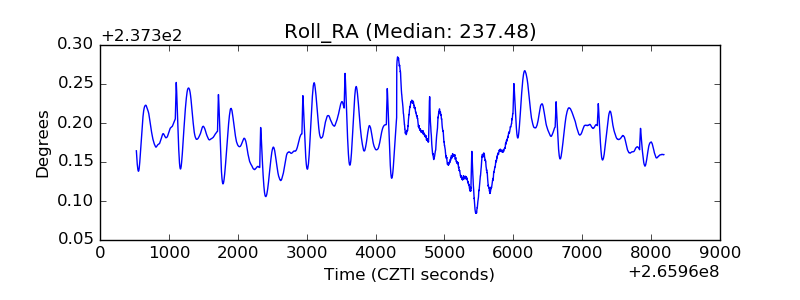 |
| Veto Counter | 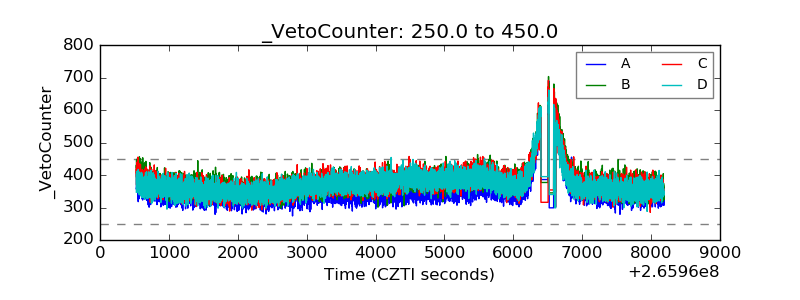 |