| Param | Original file | Final file |
|---|---|---|
| Filename | modeM0/AS1G08_081T01_9000002144cztM0_level2.fits | modeM0/AS1G08_081T01_9000002144cztM0_level2_quad_clean.evt |
| Size (bytes) | 760,469,760 | 713,672,640 |
| Size | 725.2 MB | 680.6 MB |
| Events in quadrant A | 4,613,570 | 4,299,318 |
| Events in quadrant B | 4,440,126 | 4,147,487 |
| Events in quadrant C | 4,563,198 | 3,964,702 |
| Events in quadrant D | 4,000,616 | 3,789,177 |
| Mode M9 | |||
|---|---|---|---|
| Quadrant | BADHDUFLAG | Total packets | Discarded packets |
| A | 0 | 126 | 0 |
| B | 0 | 126 | 0 |
| C | 0 | 126 | 0 |
| D | 0 | 126 | 0 |
| Mode SS | |||
|---|---|---|---|
| Quadrant | BADHDUFLAG | Total packets | Discarded packets |
| A | 0 | 1612 | 0 |
| B | 0 | 1612 | 0 |
| C | 0 | 1612 | 0 |
| D | 0 | 1612 | 0 |
| Mode M0 | |||
|---|---|---|---|
| Quadrant | BADHDUFLAG | Total packets | Discarded packets |
| A | 0 | 174039 | 0 |
| B | 0 | 171246 | 0 |
| C | 0 | 173510 | 0 |
| D | 0 | 186746 | 0 |
| Quadrant | Total seconds | Saturated seconds | Saturation percentage |
|---|---|---|---|
| A | 78951 | 1063 | 1.346405% |
| B | 78951 | 1278 | 1.618726% |
| C | 78951 | 778 | 0.985421% |
| D | 78951 | 1611 | 2.040506% |
Noise dominated data is calculated using 1-second bins in cleaned event files. If a bin has >2000 counts, and if more than 50% of those come from <1% of pixels, then it is considered to be noise-dominated and hence unusable.
| Quadrant | # 1 sec bins | Bins with >0 counts | Bins with >2000 counts | High rate bins dominated by noise | Noise dominated (total time) | Noise dominated (detector-on time) | Marked lightcurve |
|---|---|---|---|---|---|---|---|
| A | 91631 | 78951 | 0 | 0 | 0.00% | 0.00% |  |
| B | 91631 | 78949 | 0 | 0 | 0.00% | 0.00% |  |
| C | 91631 | 78950 | 0 | 0 | 0.00% | 0.00% |  |
| D | 91631 | 78938 | 0 | 0 | 0.00% | 0.00% |  |
Top three noisy pixels from each quadrant. If the there are fewer than three noisy pixels in the level2.evt file, extra rows are filled as -1
| Pixel properties | Quadrant properties | ||||||
|---|---|---|---|---|---|---|---|
| Quadrant | DetID | PixID | Counts | Sigma | Mean | Median | Sigma |
| A | 0 | 29 | 4397 | 10.99 | 1199 | 1122 | 298.0 |
| A | 7 | 110 | 3806 | 9.01 | 1199 | 1122 | 298.0 |
| A | 9 | 19 | 3528 | 8.07 | 1199 | 1122 | 298.0 |
| B | 2 | 9 | 3787 | 11.68 | 1171 | 1116 | 228.6 |
| B | 3 | 17 | 2897 | 7.79 | 1171 | 1116 | 228.6 |
| B | 3 | 80 | 2896 | 7.79 | 1171 | 1116 | 228.6 |
| C | 1 | 80 | 3506 | 7.78 | 1204 | 1122 | 306.6 |
| C | 1 | 81 | 3404 | 7.44 | 1204 | 1122 | 306.6 |
| C | 12 | 241 | 3217 | 6.83 | 1204 | 1122 | 306.6 |
| D | 3 | 14 | 2898 | 6.09 | 1139 | 1035 | 305.7 |
| D | 6 | 231 | 2891 | 6.07 | 1139 | 1035 | 305.7 |
| D | 6 | 67 | 2858 | 5.96 | 1139 | 1035 | 305.7 |
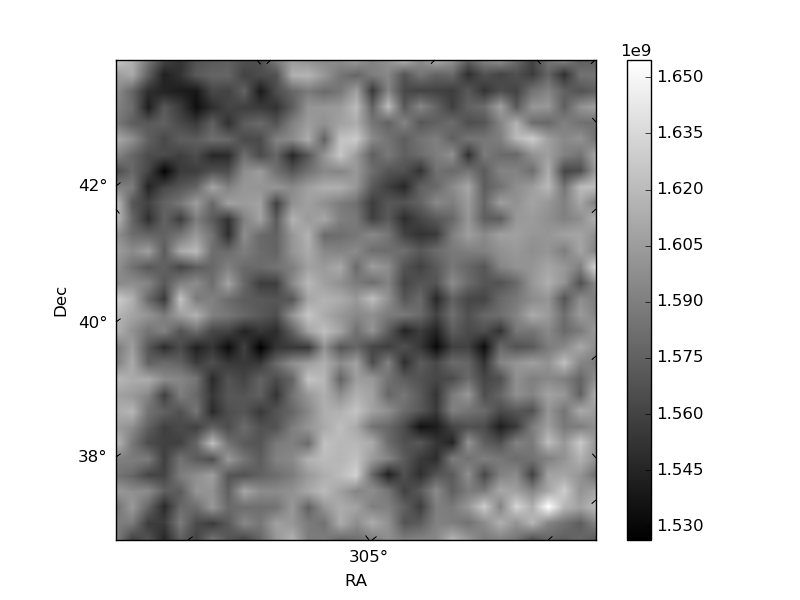
Histogram calculated using DETX and DETY for each event in the final _common_clean file
| Quadrant A |  |
 |
Quadrant B |
|---|---|---|---|
| Quadrant D |  |
 |
Quadrant C |
| Plot type | Count rate plots | Images |
|---|---|---|
| Comparison with Poisson distribution Blue bars denote a histogram of data divided into 1 sec bins. Red curve is a Poisson curve with rate = median count rate of data. |
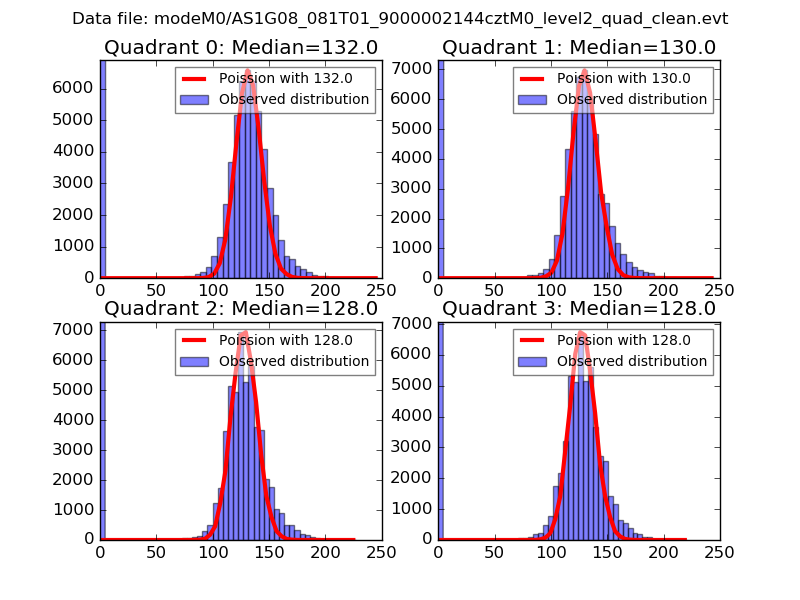 |
 |
| Quadrant-wise count rates Data is divided into 100 sec bins |
 |
|
| Module-wise count rates for Quadrant A Data is divided into 100 sec bins |
 |
 |
| Module-wise count rates for Quadrant B Data is divided into 100 sec bins |
 |
 |
| Module-wise count rates for Quadrant C Data is divided into 100 sec bins |
 |
 |
| Module-wise count rates for Quadrant D Data is divided into 100 sec bins |
 |
 |
| Parameter | Plot |
|---|---|
| CZT HV Monitor |  |
| D_VDD |  |
| Temperature 1 |  |
| Veto HV Monitor |  |
| Veto LLD |  |
| Alpha Counter |  |
| _CPM_Rate |  |
| CZT Counter |  |
| +2.5 Volts monitor |  |
| +5 Volts monitor |  |
| _ROLL_ROT |  |
| _Roll_DEC |  |
| _Roll_RA |  |
| Veto Counter |  |