| Param | Original file | Final file |
|---|---|---|
| Filename | modeM0/AS1G08_081T01_9000002144_14540cztM0_level2.evt | modeM0/AS1G08_081T01_9000002144_14540cztM0_level2_quad_clean.evt |
| Size (bytes) | 132,969,600 | 6,194,880 |
| Size | 126.8 MB | 5.9 MB |
| Events in quadrant A | 974,507 | 15,701 |
| Events in quadrant B | 959,025 | 15,544 |
| Events in quadrant C | 994,937 | 15,982 |
| Events in quadrant D | 980,678 | 14,767 |
| Mode M9 | |||
|---|---|---|---|
| Quadrant | BADHDUFLAG | Total packets | Discarded packets |
| A | 0 | 7 | 0 |
| B | 0 | 7 | 0 |
| C | 0 | 7 | 0 |
| D | 0 | 7 | 0 |
| Mode SS | |||
|---|---|---|---|
| Quadrant | BADHDUFLAG | Total packets | Discarded packets |
| A | 0 | 36 | 0 |
| B | 0 | 36 | 0 |
| C | 0 | 36 | 0 |
| D | 0 | 36 | 0 |
| Mode M0 | |||
|---|---|---|---|
| Quadrant | BADHDUFLAG | Total packets | Discarded packets |
| A | 0 | 3863 | 2 |
| B | 0 | 3846 | 1 |
| C | 0 | 3969 | 1 |
| D | 0 | 3937 | 1 |
| Quadrant | Total seconds | Saturated seconds | Saturation percentage |
|---|---|---|---|
| A | 1697 | 75 | 4.419564% |
| B | 1697 | 71 | 4.183854% |
| C | 1697 | 59 | 3.476724% |
| D | 1697 | 66 | 3.889216% |
Noise dominated data is calculated using 1-second bins in cleaned event files. If a bin has >2000 counts, and if more than 50% of those come from <1% of pixels, then it is considered to be noise-dominated and hence unusable.
| Quadrant | # 1 sec bins | Bins with >0 counts | Bins with >2000 counts | High rate bins dominated by noise | Noise dominated (total time) | Noise dominated (detector-on time) | Marked lightcurve |
|---|---|---|---|---|---|---|---|
| A | 2408 | 1699 | 4 | 4 | 0.17% | 0.24% | 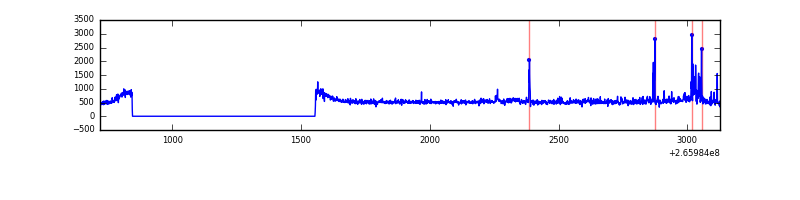 |
| B | 2408 | 1699 | 1 | 1 | 0.04% | 0.06% | 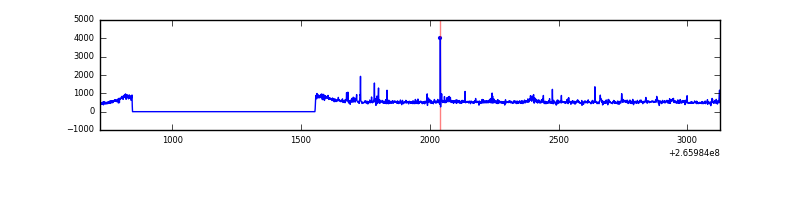 |
| C | 2408 | 1699 | 0 | 0 | 0.00% | 0.00% | 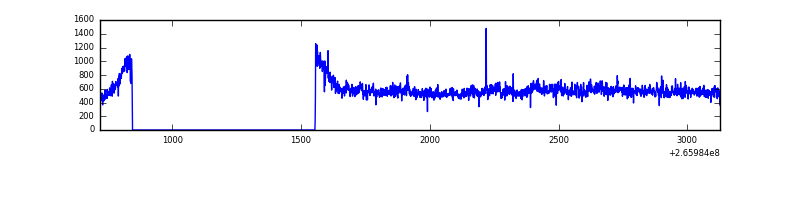 |
| D | 2408 | 1699 | 1 | 1 | 0.04% | 0.06% | 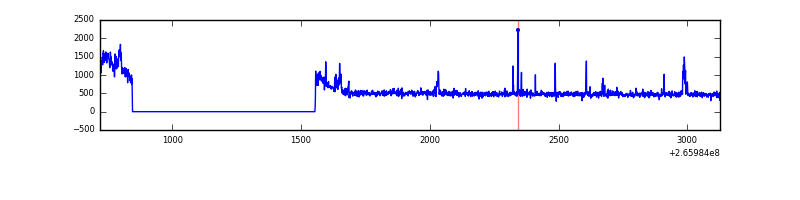 |
Top three noisy pixels from each quadrant. If the there are fewer than three noisy pixels in the level2.evt file, extra rows are filled as -1
| Pixel properties | Quadrant properties | ||||||
|---|---|---|---|---|---|---|---|
| Quadrant | DetID | PixID | Counts | Sigma | Mean | Median | Sigma |
| A | 8 | 15 | 85545 | 1755.02 | 228 | 222 | 48.6 |
| A | 12 | 189 | 9461 | 190.04 | 228 | 222 | 48.6 |
| A | 0 | 226 | 2066 | 37.93 | 228 | 222 | 48.6 |
| B | 0 | 189 | 17397 | 373.31 | 224 | 218 | 46.0 |
| B | 0 | 219 | 11944 | 254.81 | 224 | 218 | 46.0 |
| B | 3 | 209 | 11589 | 247.1 | 224 | 218 | 46.0 |
| C | 3 | 233 | 151931 | 2932.41 | 215 | 216 | 51.7 |
| C | 13 | 61 | 1504 | 24.89 | 215 | 216 | 51.7 |
| C | 14 | 225 | 962 | 14.42 | 215 | 216 | 51.7 |
| D | 12 | 110 | 103394 | 1867.11 | 219 | 212 | 55.3 |
| D | 2 | 152 | 19412 | 347.43 | 219 | 212 | 55.3 |
| D | 10 | 199 | 10494 | 186.06 | 219 | 212 | 55.3 |
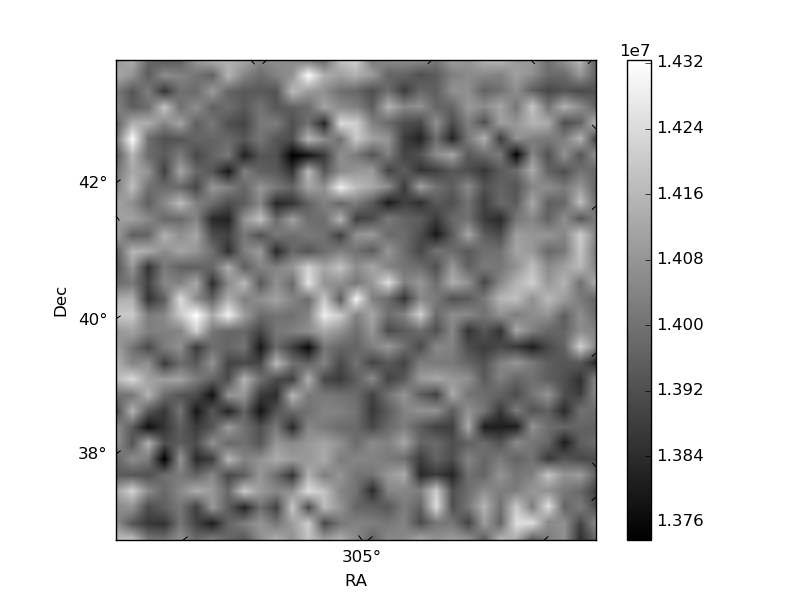
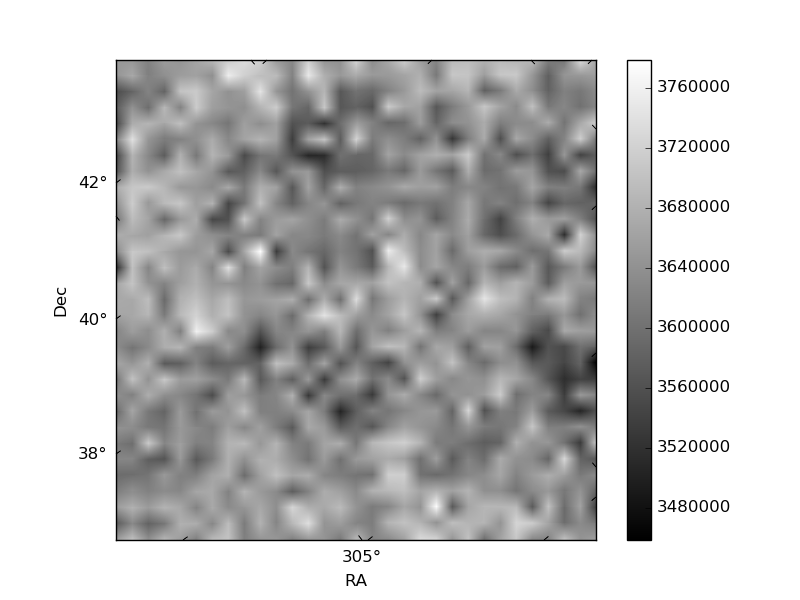
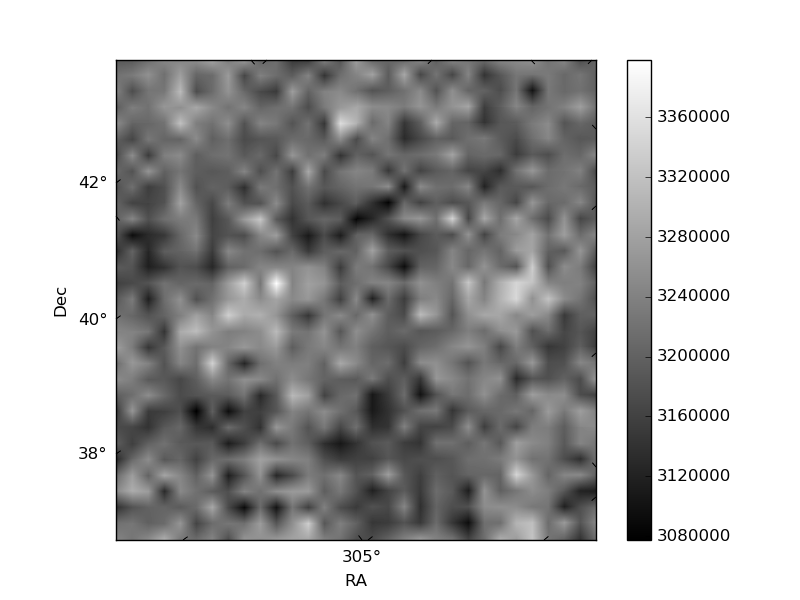
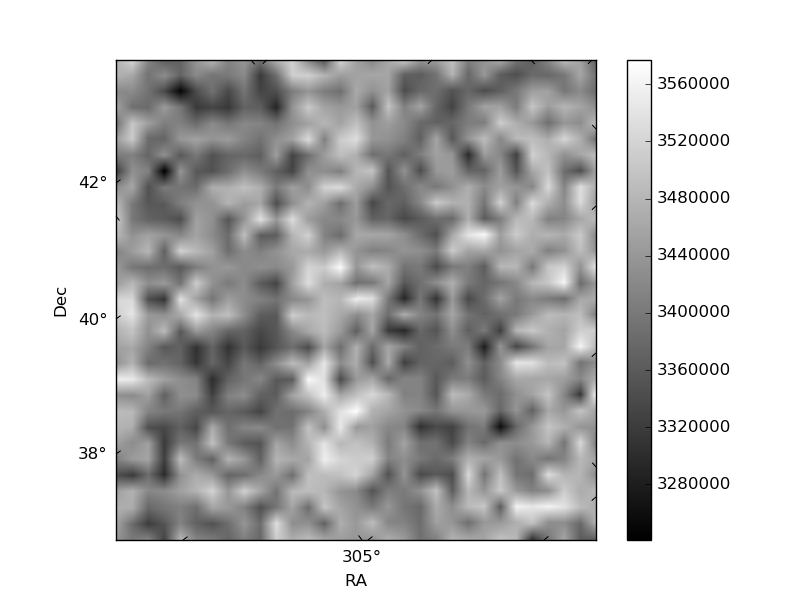
Histogram calculated using DETX and DETY for each event in the final _common_clean file
| Quadrant A | 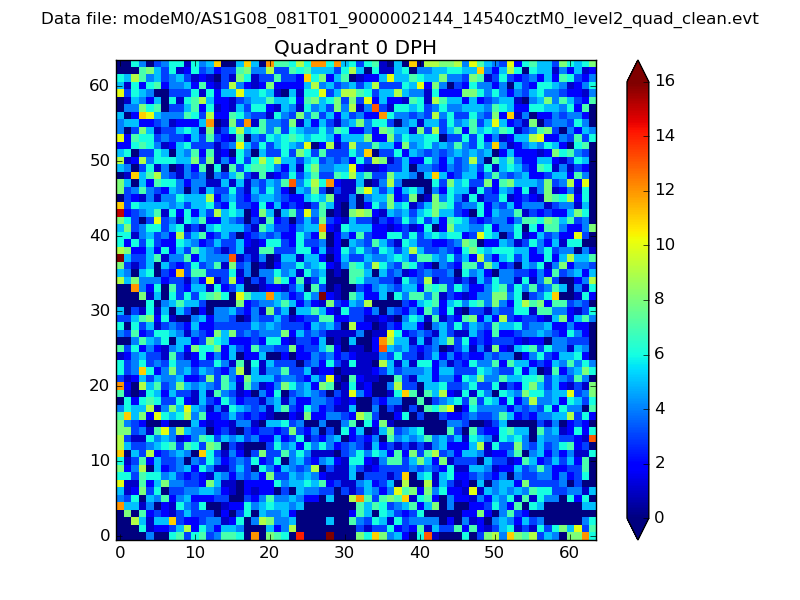 |
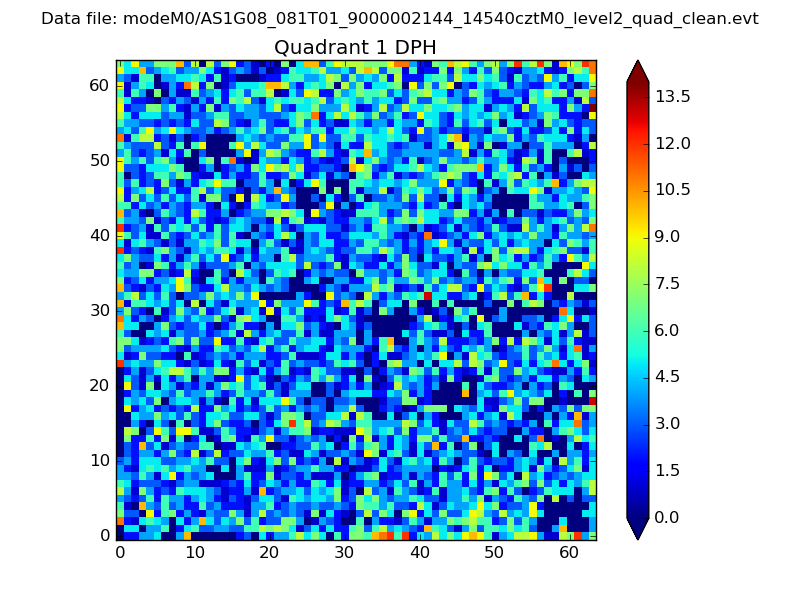 |
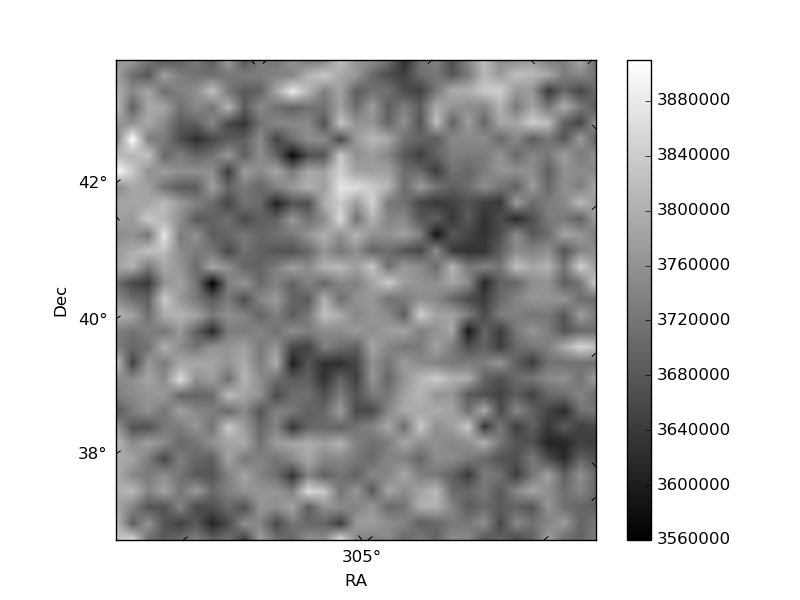
Quadrant B |
|---|---|---|---|
| Quadrant D | 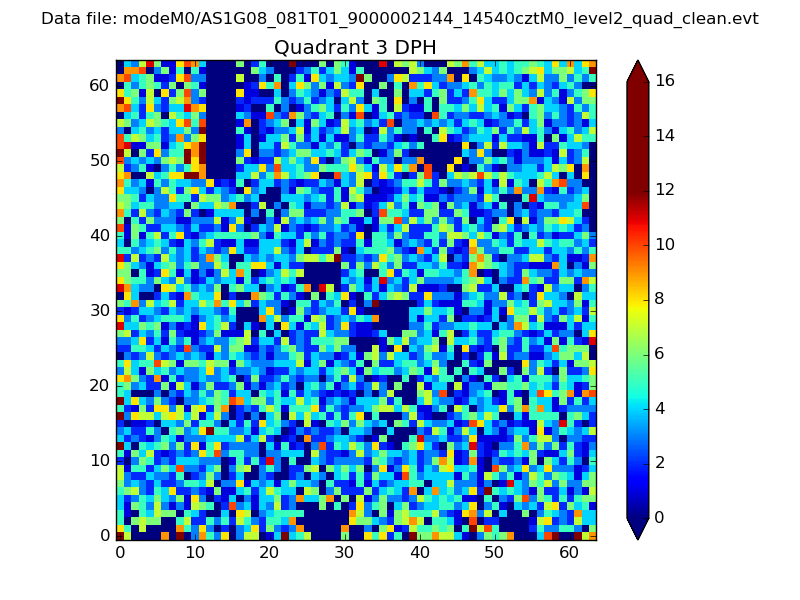 |
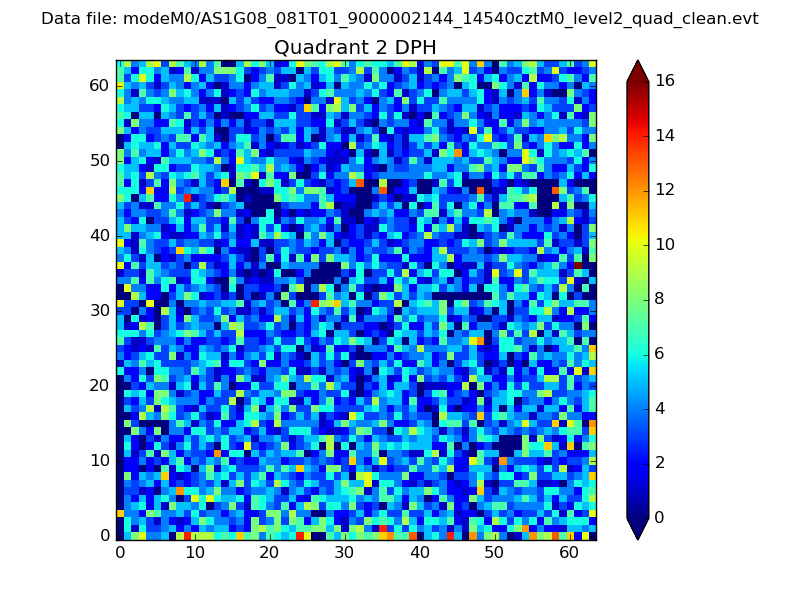 |
Quadrant C |
| Plot type | Count rate plots | Images |
|---|---|---|
| Comparison with Poisson distribution Blue bars denote a histogram of data divided into 1 sec bins. Red curve is a Poisson curve with rate = median count rate of data. |
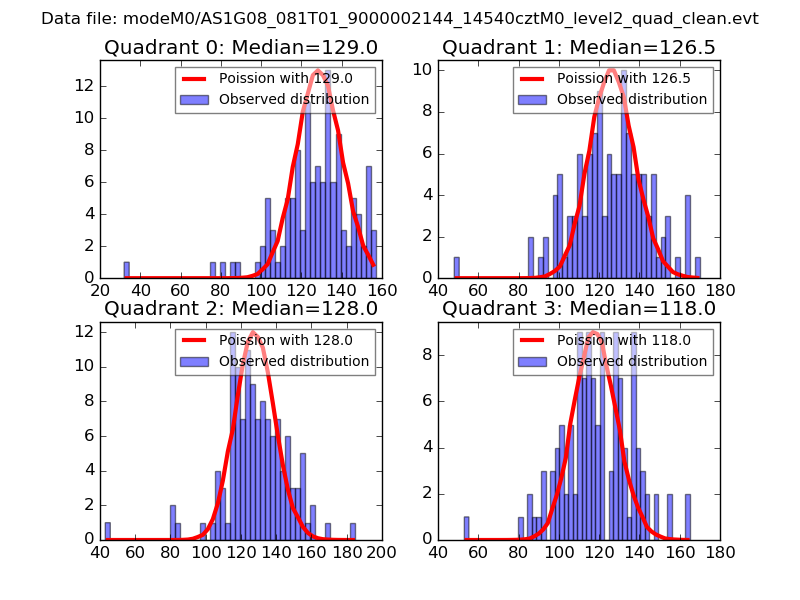 |
 |
| Quadrant-wise count rates Data is divided into 100 sec bins |
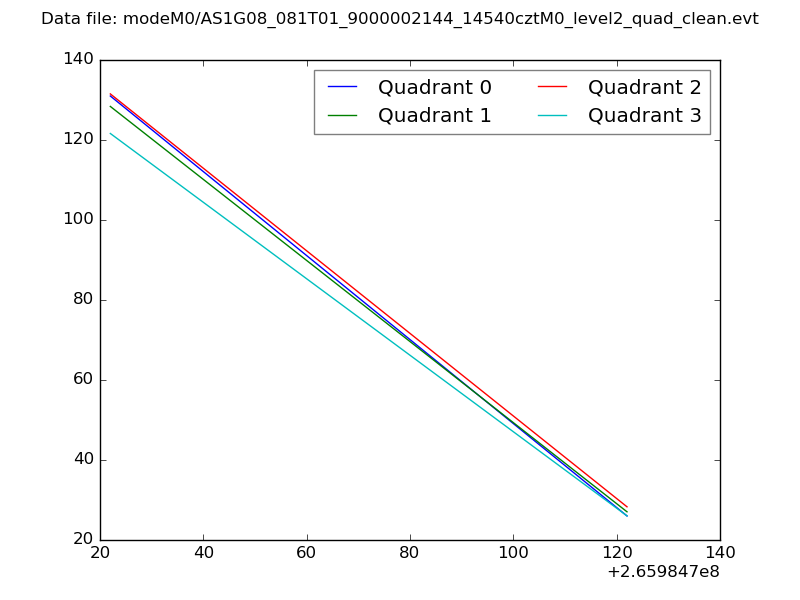 |
|
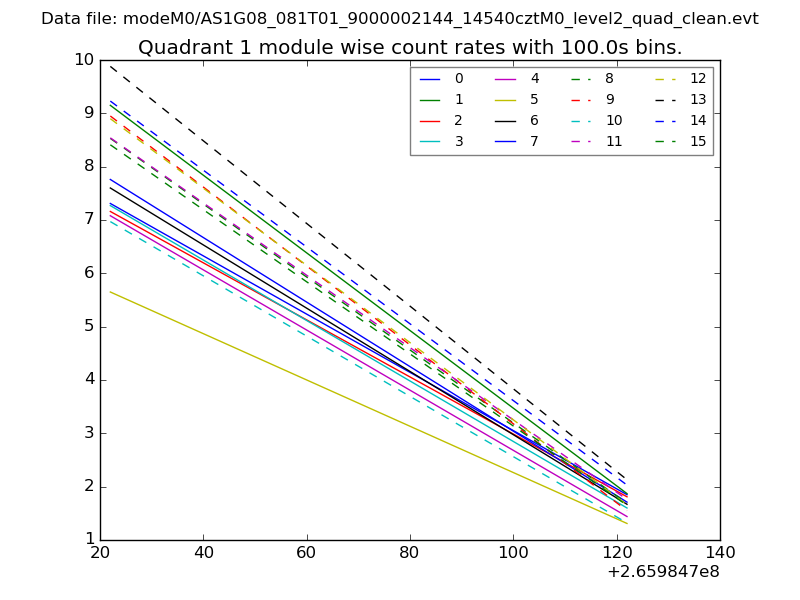
| Module-wise count rates for Quadrant A Data is divided into 100 sec bins |
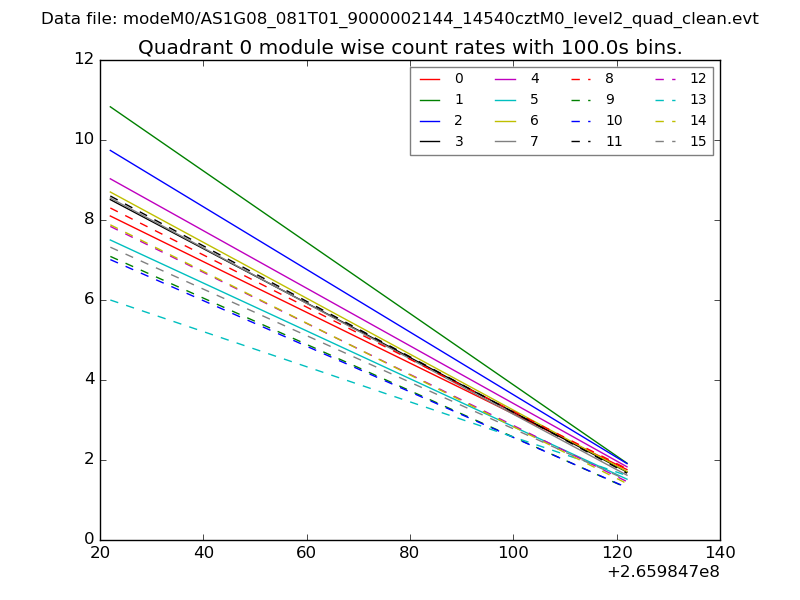 |
 |
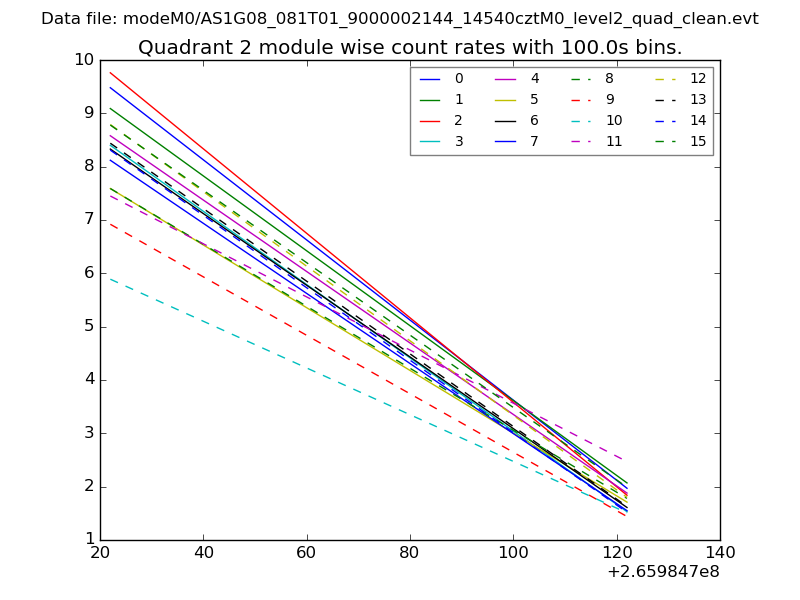
| Module-wise count rates for Quadrant B Data is divided into 100 sec bins |
 |
 |
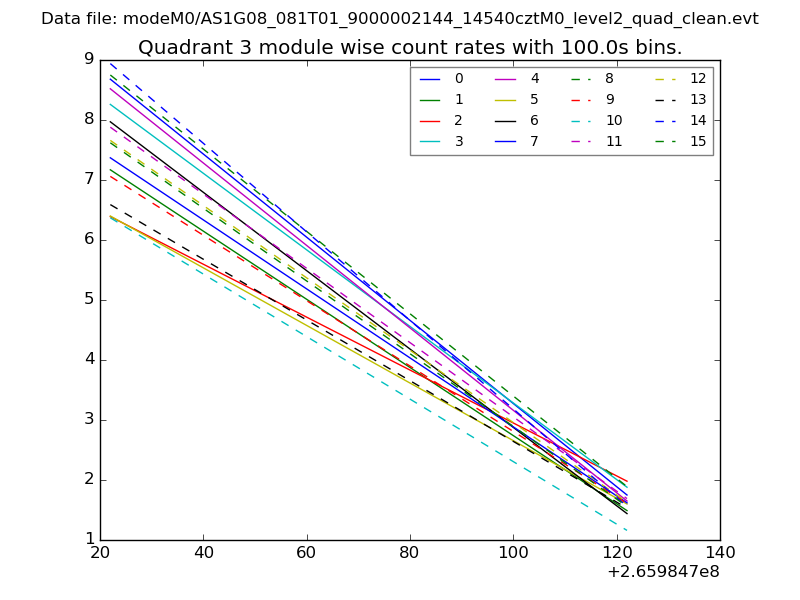
| Module-wise count rates for Quadrant C Data is divided into 100 sec bins |
 |
 |
| Module-wise count rates for Quadrant D Data is divided into 100 sec bins |
 |
 |
| Parameter | Plot |
|---|---|
| CZT HV Monitor | 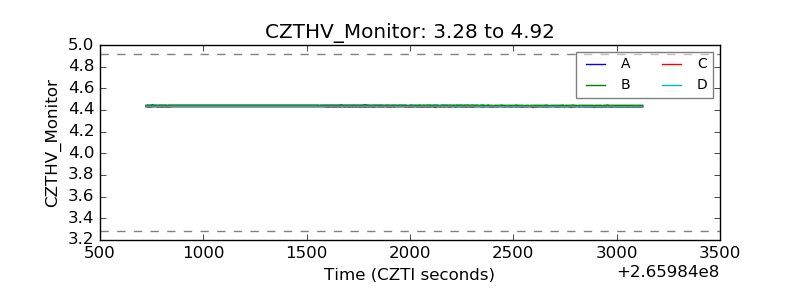 |
| D_VDD | 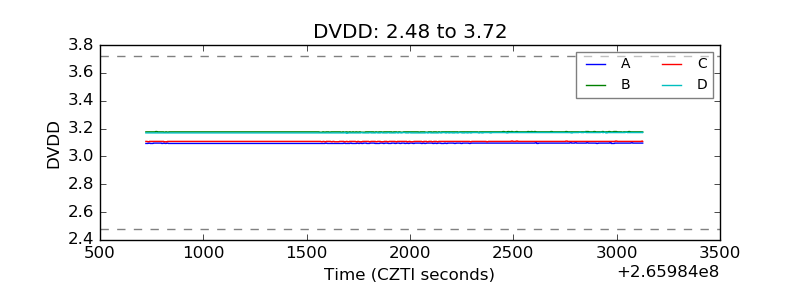 |
| Temperature 1 | 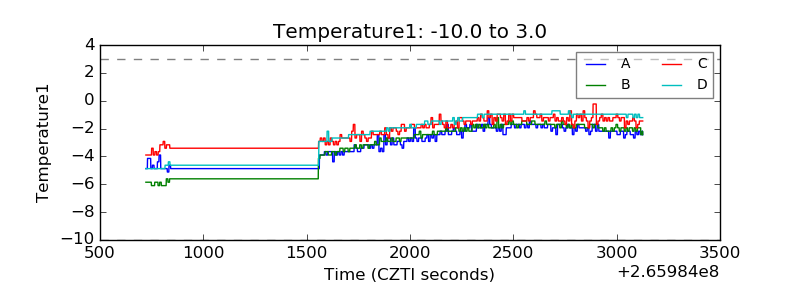 |
| Veto HV Monitor | 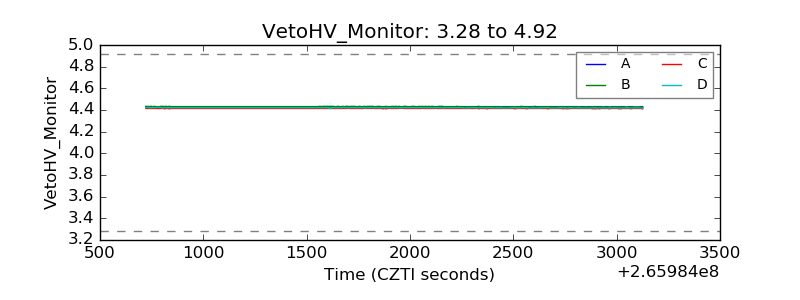 |
| Veto LLD | 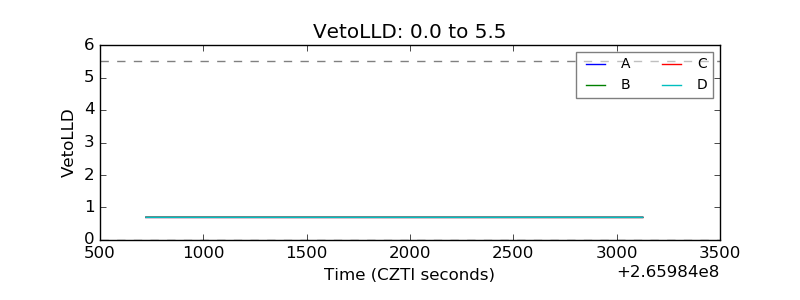 |
| Alpha Counter | 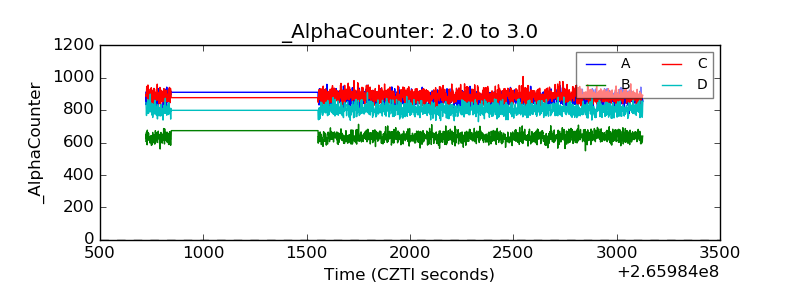 |
| _CPM_Rate | 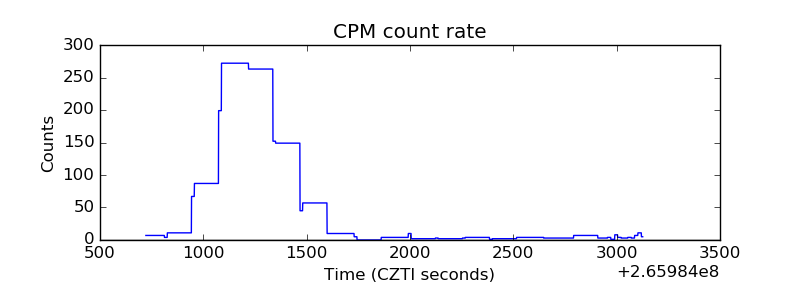 |
| CZT Counter | 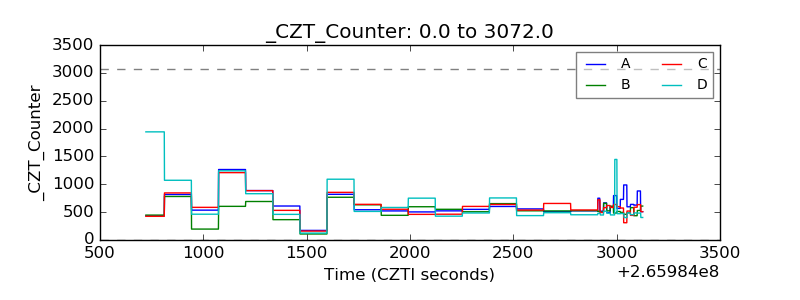 |
| +2.5 Volts monitor | 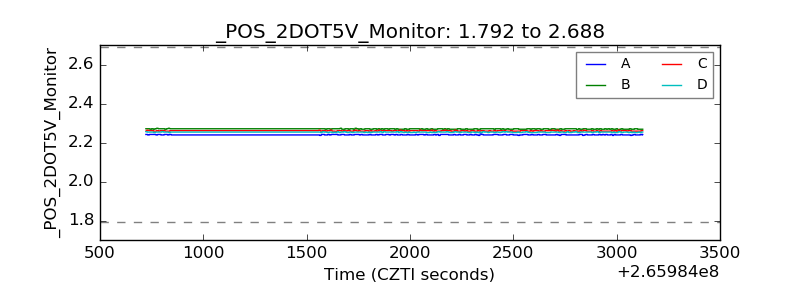 |
| +5 Volts monitor | 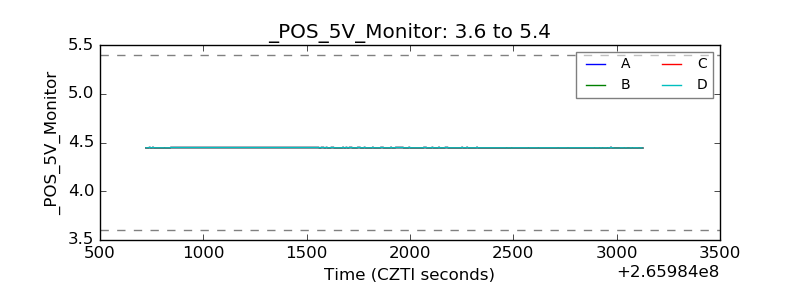 |
| _ROLL_ROT | 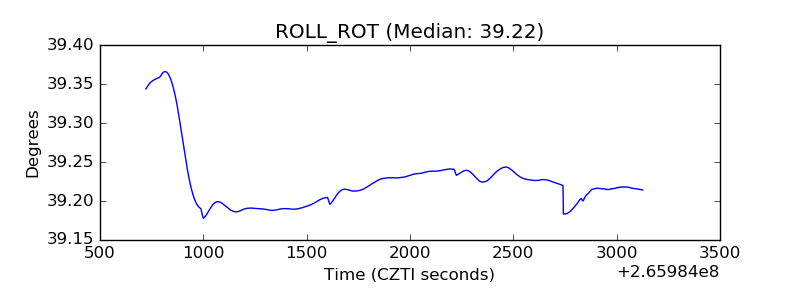 |
| _Roll_DEC | 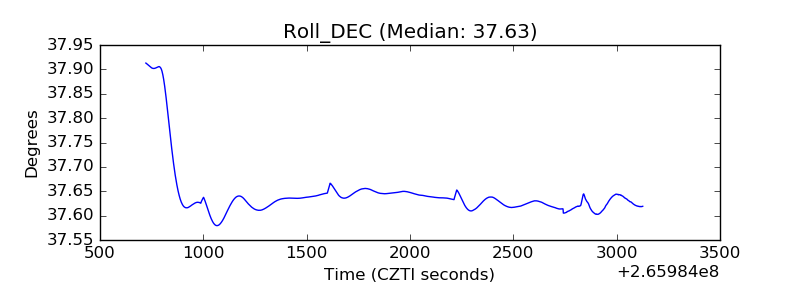 |
| _Roll_RA | 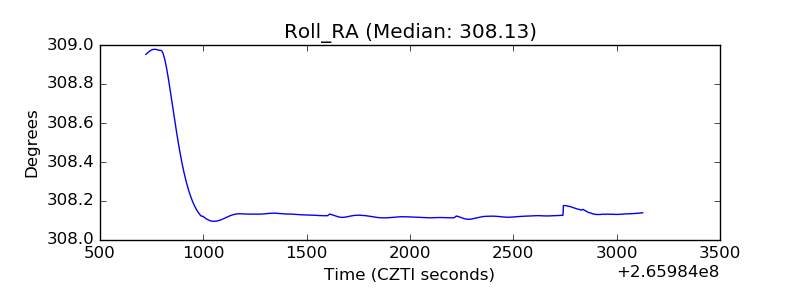 |
| Veto Counter |  |