| Param | Original file | Final file |
|---|---|---|
| Filename | modeM0/AS1G08_081T01_9000002144_14541cztM0_level2.evt | modeM0/AS1G08_081T01_9000002144_14541cztM0_level2_quad_clean.evt |
| Size (bytes) | 477,789,120 | 71,277,120 |
| Size | 455.7 MB | 68.0 MB |
| Events in quadrant A | 3,648,182 | 433,737 |
| Events in quadrant B | 3,477,136 | 420,929 |
| Events in quadrant C | 3,616,534 | 412,607 |
| Events in quadrant D | 3,269,593 | 420,436 |
| Mode M9 | |||
|---|---|---|---|
| Quadrant | BADHDUFLAG | Total packets | Discarded packets |
| A | 0 | 15 | 0 |
| B | 0 | 15 | 0 |
| C | 0 | 15 | 0 |
| D | 0 | 15 | 0 |
| Mode SS | |||
|---|---|---|---|
| Quadrant | BADHDUFLAG | Total packets | Discarded packets |
| A | 0 | 138 | 0 |
| B | 0 | 138 | 0 |
| C | 0 | 138 | 0 |
| D | 0 | 138 | 0 |
| Mode M0 | |||
|---|---|---|---|
| Quadrant | BADHDUFLAG | Total packets | Discarded packets |
| A | 0 | 14971 | 3 |
| B | 0 | 14540 | 2 |
| C | 0 | 14805 | 2 |
| D | 0 | 14133 | 2 |
| Quadrant | Total seconds | Saturated seconds | Saturation percentage |
|---|---|---|---|
| A | 6746 | 91 | 1.348948% |
| B | 6746 | 88 | 1.304477% |
| C | 6746 | 69 | 1.022828% |
| D | 6746 | 64 | 0.948710% |
Noise dominated data is calculated using 1-second bins in cleaned event files. If a bin has >2000 counts, and if more than 50% of those come from <1% of pixels, then it is considered to be noise-dominated and hence unusable.
| Quadrant | # 1 sec bins | Bins with >0 counts | Bins with >2000 counts | High rate bins dominated by noise | Noise dominated (total time) | Noise dominated (detector-on time) | Marked lightcurve |
|---|---|---|---|---|---|---|---|
| A | 7652 | 6748 | 4 | 4 | 0.05% | 0.06% | 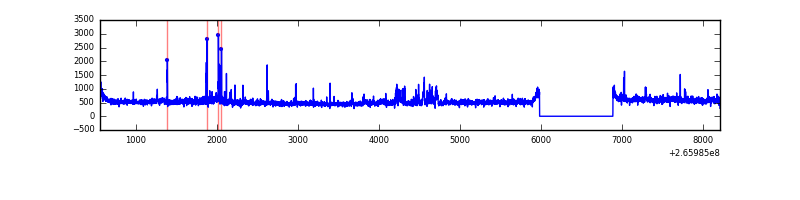 |
| B | 7652 | 6748 | 5 | 5 | 0.07% | 0.07% | 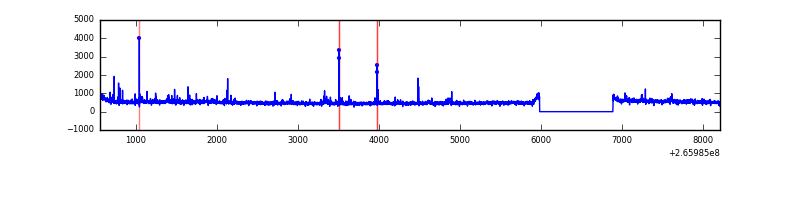 |
| C | 7652 | 6748 | 0 | 0 | 0.00% | 0.00% | 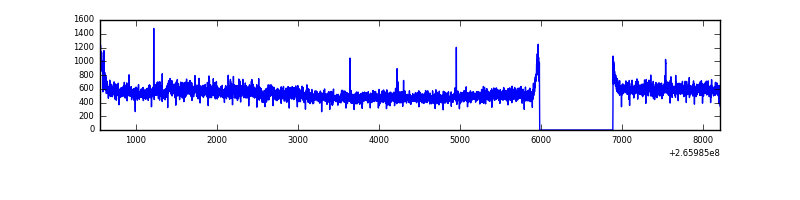 |
| D | 7652 | 6748 | 1 | 1 | 0.01% | 0.01% | 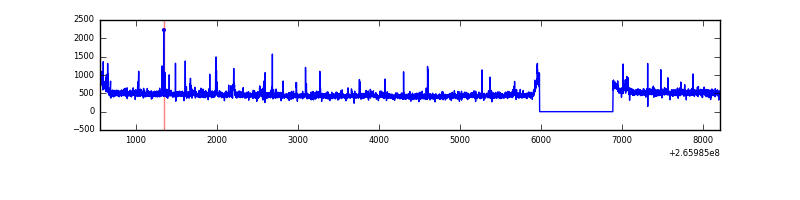 |
Top three noisy pixels from each quadrant. If the there are fewer than three noisy pixels in the level2.evt file, extra rows are filled as -1
| Pixel properties | Quadrant properties | ||||||
|---|---|---|---|---|---|---|---|
| Quadrant | DetID | PixID | Counts | Sigma | Mean | Median | Sigma |
| A | 8 | 15 | 334317 | 1970.4 | 838 | 818 | 169.3 |
| A | 0 | 23 | 44702 | 259.28 | 838 | 818 | 169.3 |
| A | 12 | 189 | 42282 | 244.98 | 838 | 818 | 169.3 |
| B | 0 | 189 | 40959 | 252.74 | 830 | 809 | 158.9 |
| B | 3 | 209 | 38796 | 239.13 | 830 | 809 | 158.9 |
| B | 4 | 48 | 26924 | 164.39 | 830 | 809 | 158.9 |
| C | 3 | 233 | 482894 | 2602.62 | 801 | 807 | 185.2 |
| C | 13 | 61 | 5709 | 26.46 | 801 | 807 | 185.2 |
| C | 8 | 128 | 3998 | 17.23 | 801 | 807 | 185.2 |
| D | 2 | 152 | 76540 | 373.93 | 814 | 791 | 202.6 |
| D | 12 | 110 | 51940 | 252.49 | 814 | 791 | 202.6 |
| D | 2 | 234 | 40584 | 196.44 | 814 | 791 | 202.6 |
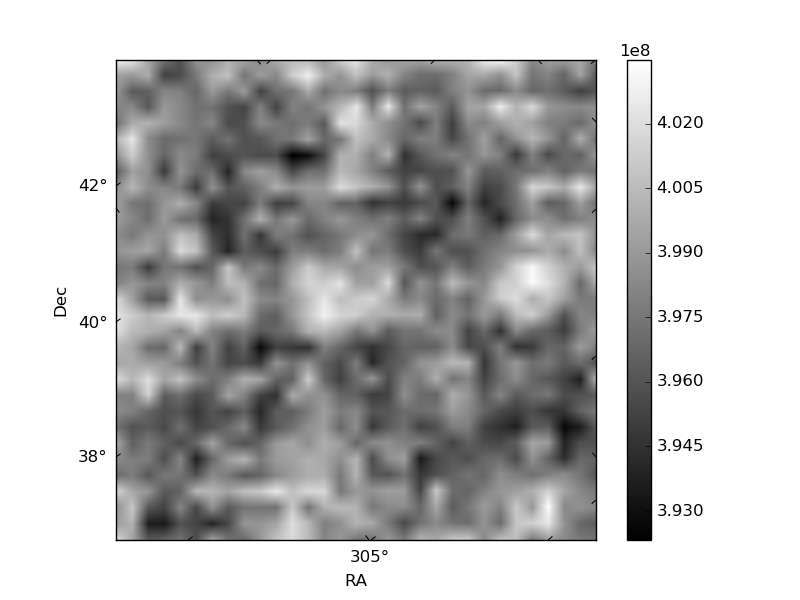
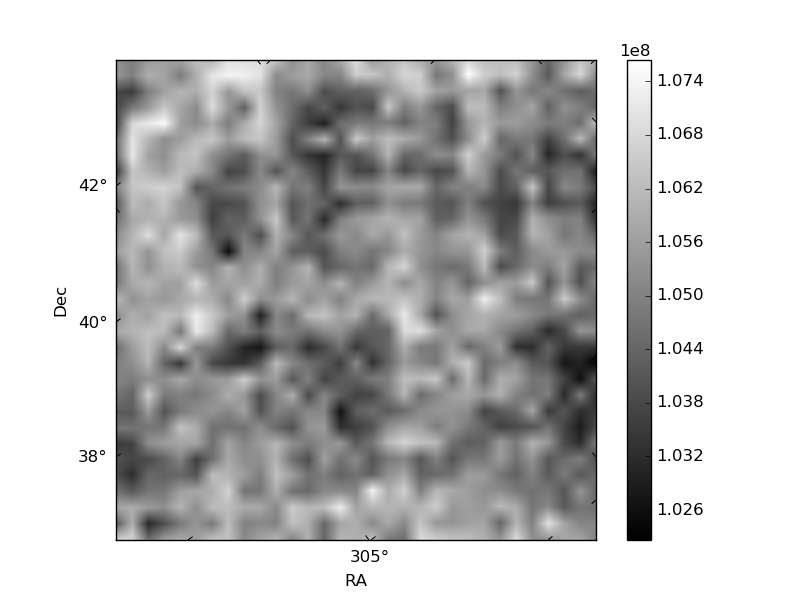
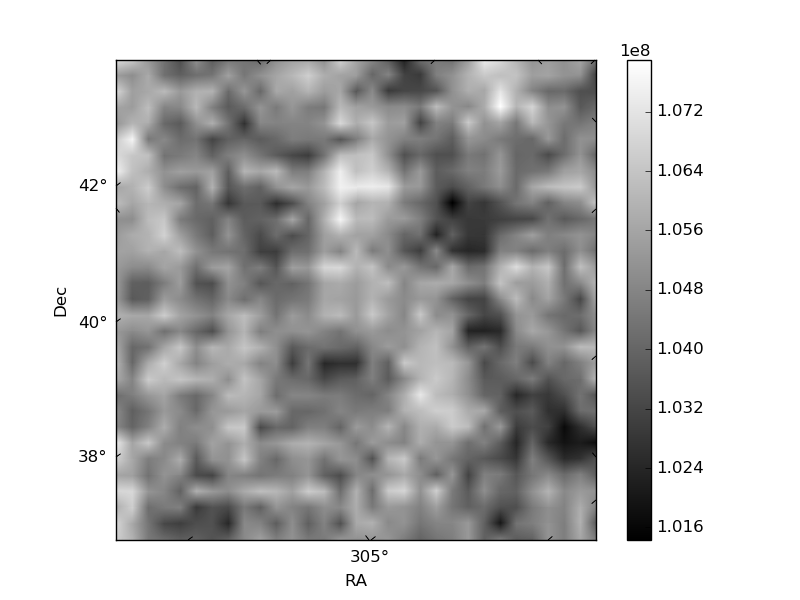
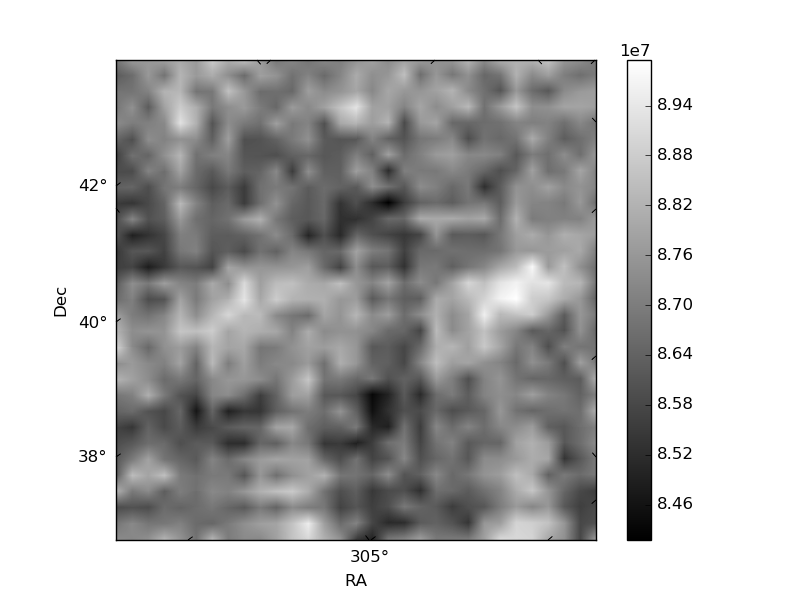
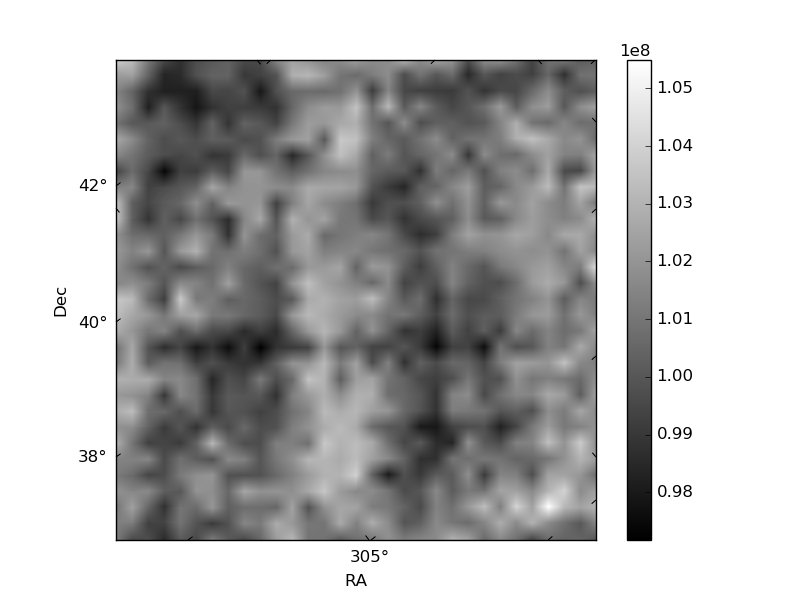
Histogram calculated using DETX and DETY for each event in the final _common_clean file
| Quadrant A | 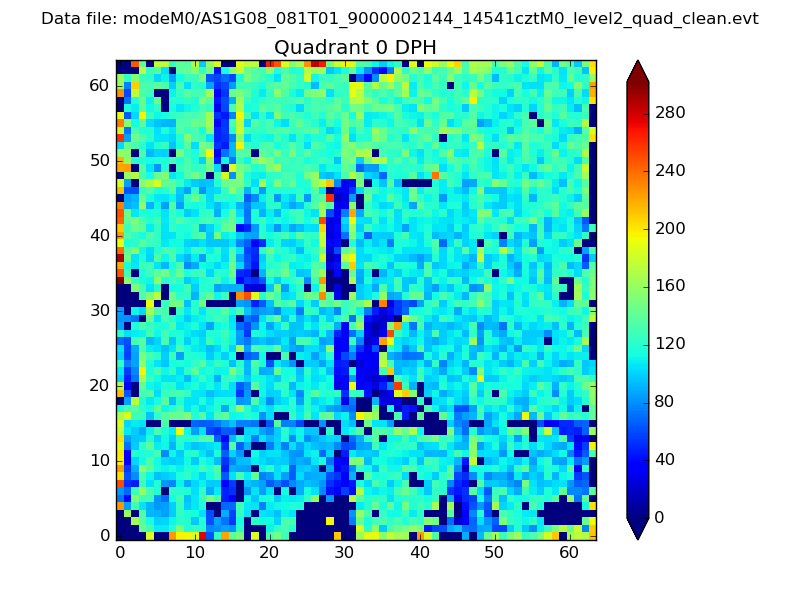 |
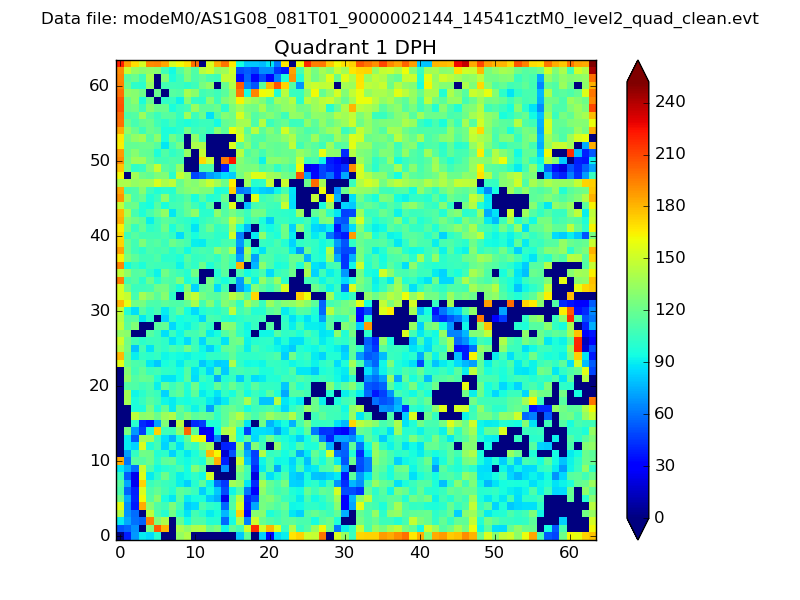 |
Quadrant B |
|---|---|---|---|
| Quadrant D | 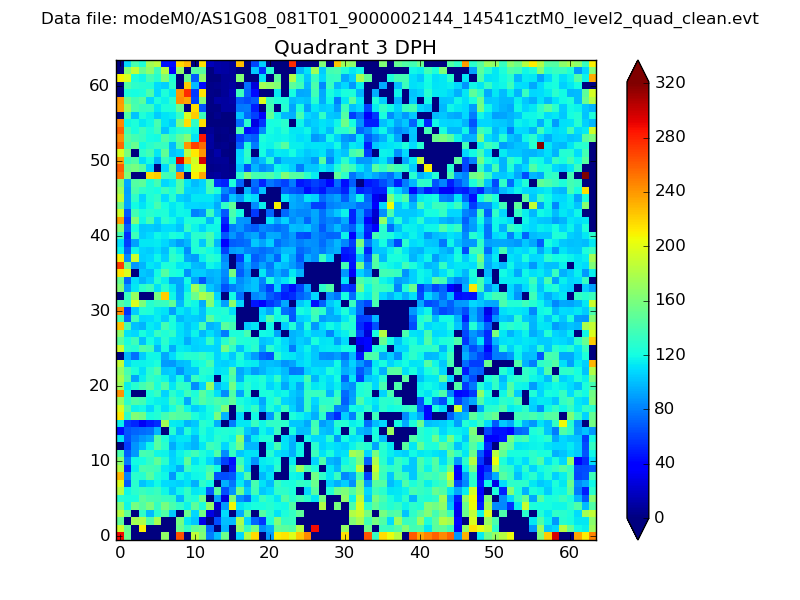 |
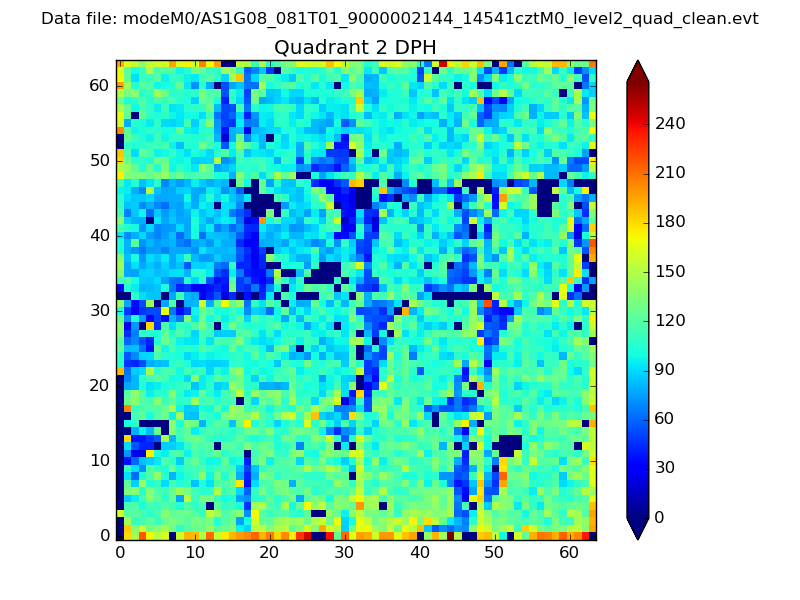 |
Quadrant C |
| Plot type | Count rate plots | Images |
|---|---|---|
| Comparison with Poisson distribution Blue bars denote a histogram of data divided into 1 sec bins. Red curve is a Poisson curve with rate = median count rate of data. |
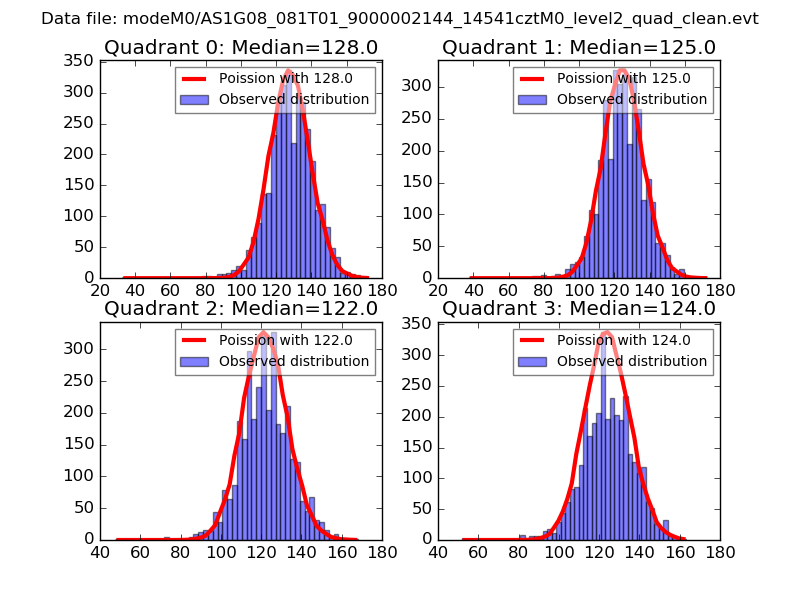 |
 |
| Quadrant-wise count rates Data is divided into 100 sec bins |
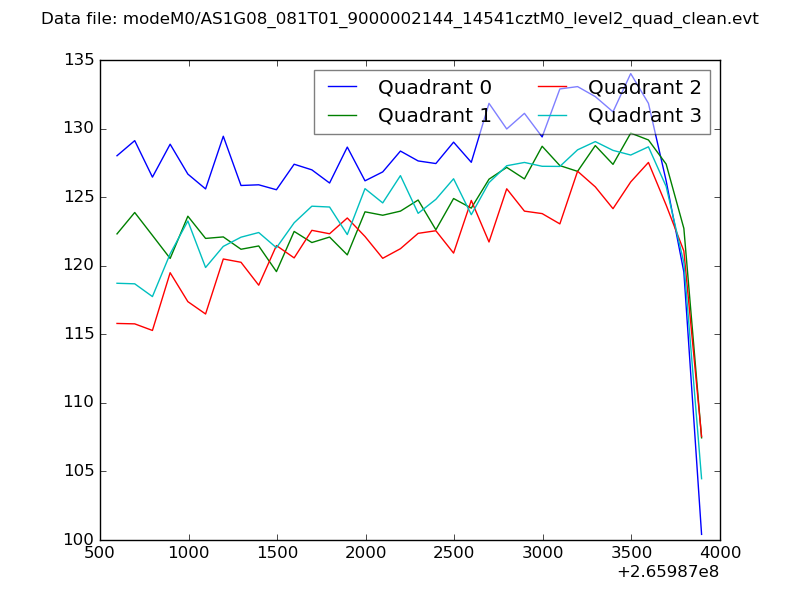 |
|
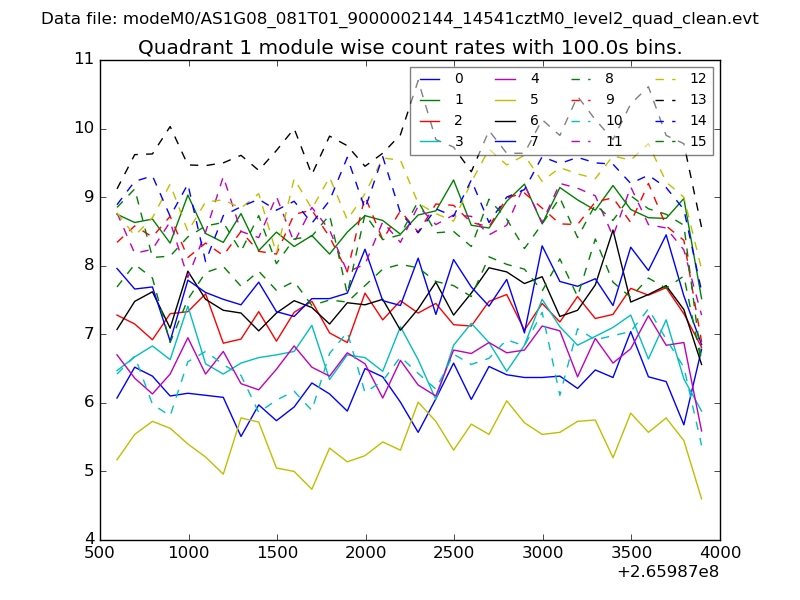
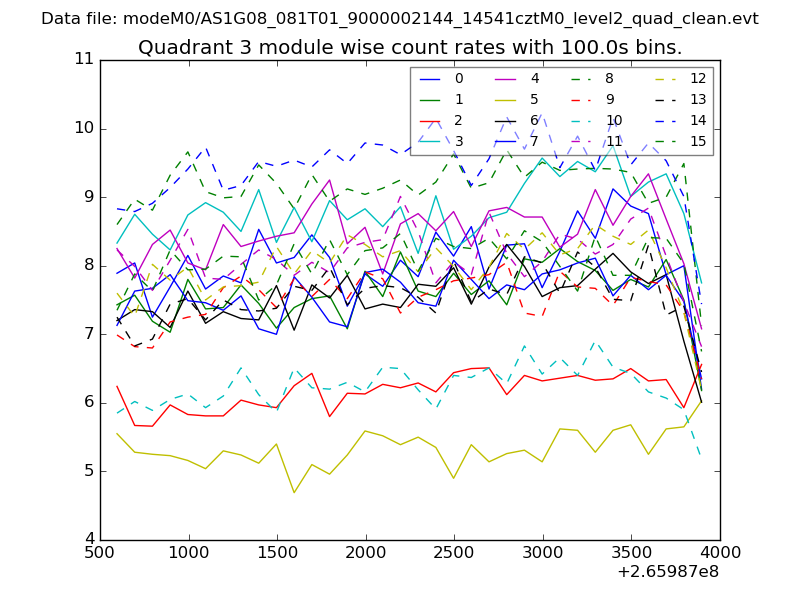
| Module-wise count rates for Quadrant A Data is divided into 100 sec bins |
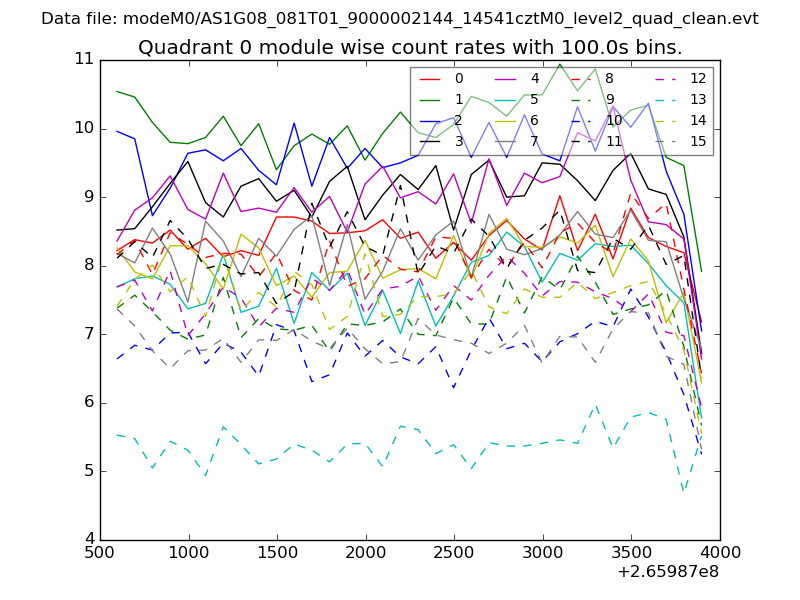 |
 |
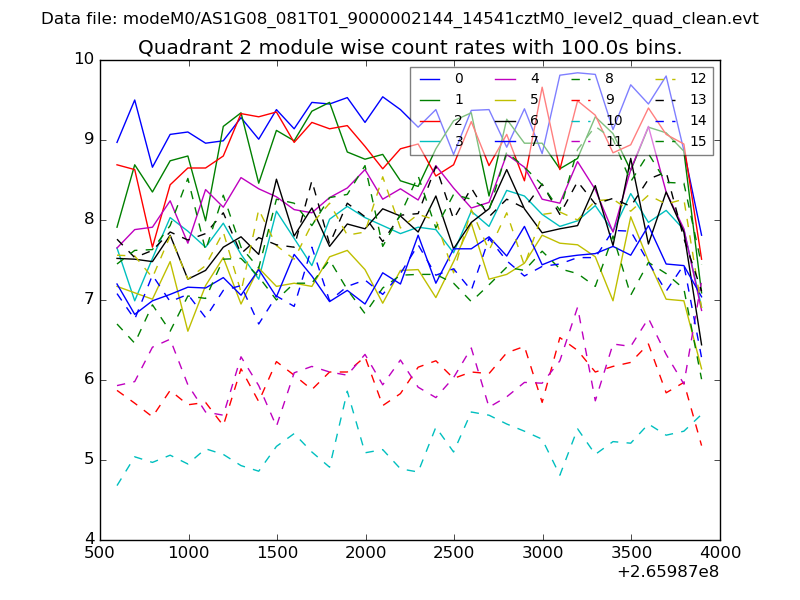
| Module-wise count rates for Quadrant B Data is divided into 100 sec bins |
 |
 |
| Module-wise count rates for Quadrant C Data is divided into 100 sec bins |
 |
 |
| Module-wise count rates for Quadrant D Data is divided into 100 sec bins |
 |
 |
| Parameter | Plot |
|---|---|
| CZT HV Monitor | 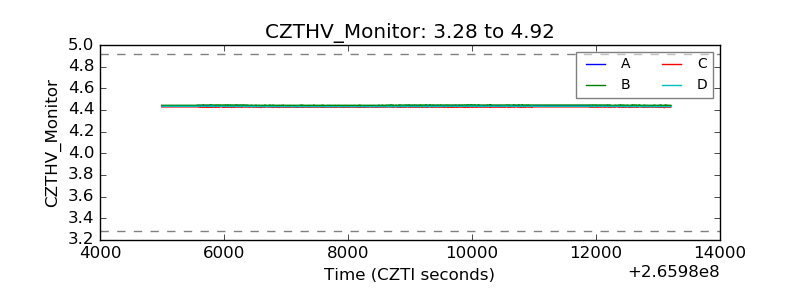 |
| D_VDD |  |
| Temperature 1 | 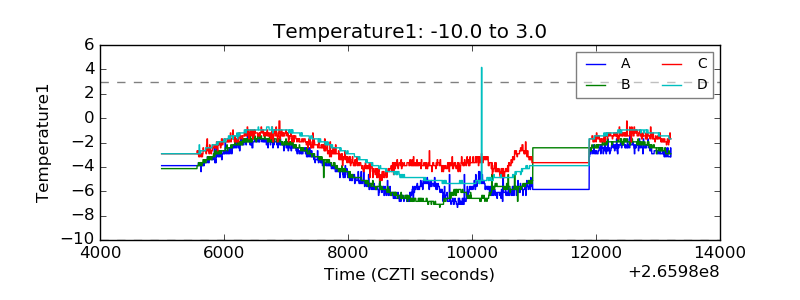 |
| Veto HV Monitor | 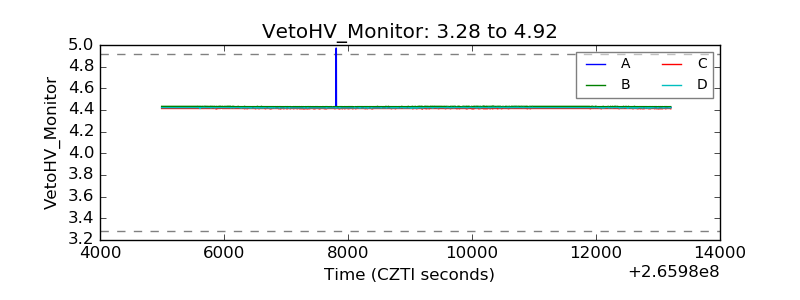 |
| Veto LLD | 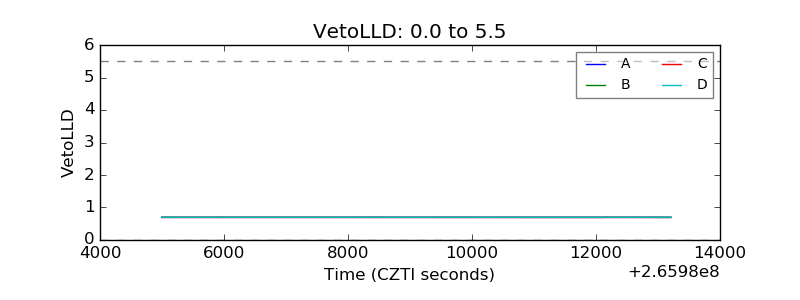 |
| Alpha Counter | 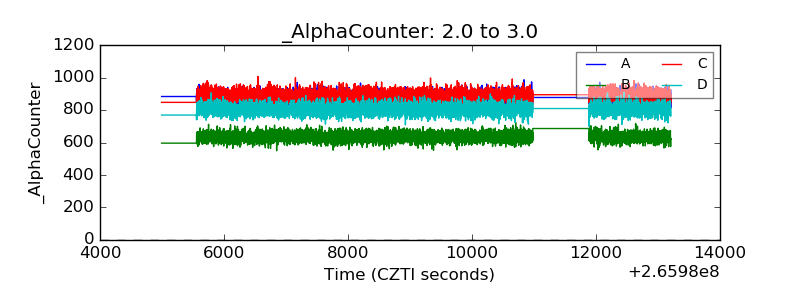 |
| _CPM_Rate | 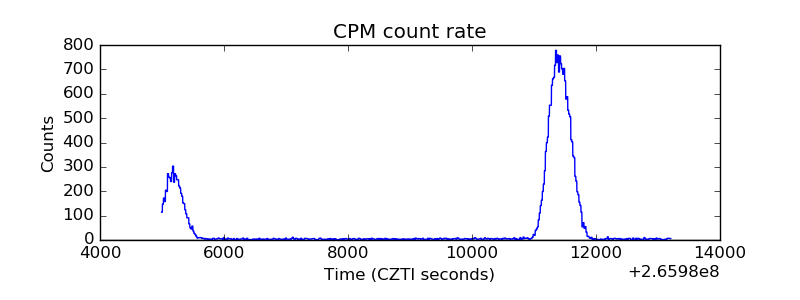 |
| CZT Counter | 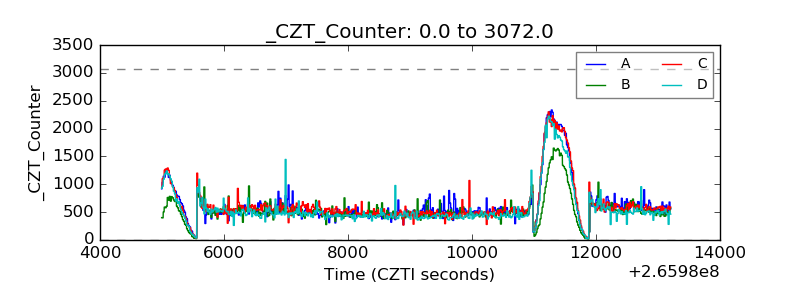 |
| +2.5 Volts monitor |  |
| +5 Volts monitor |  |
| _ROLL_ROT | 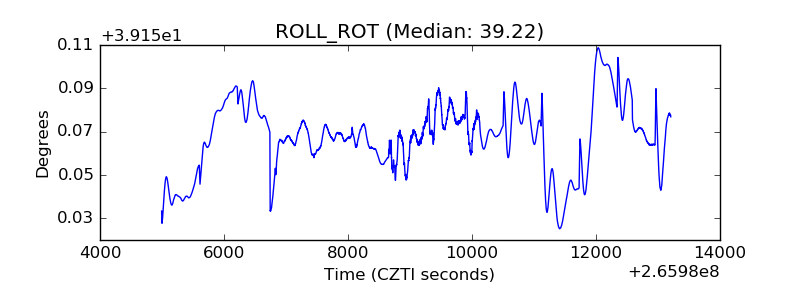 |
| _Roll_DEC | 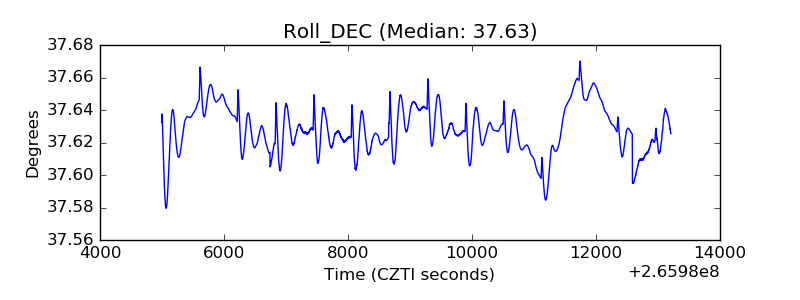 |
| _Roll_RA | 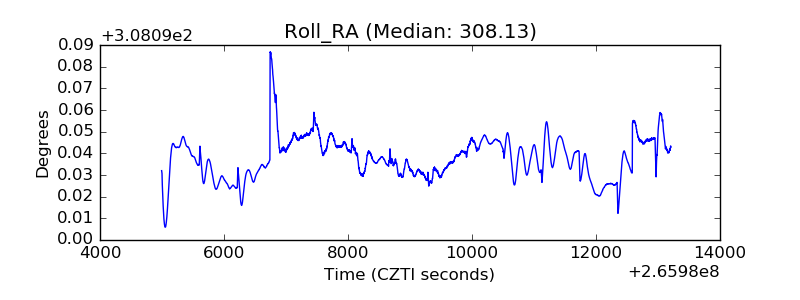 |
| Veto Counter | 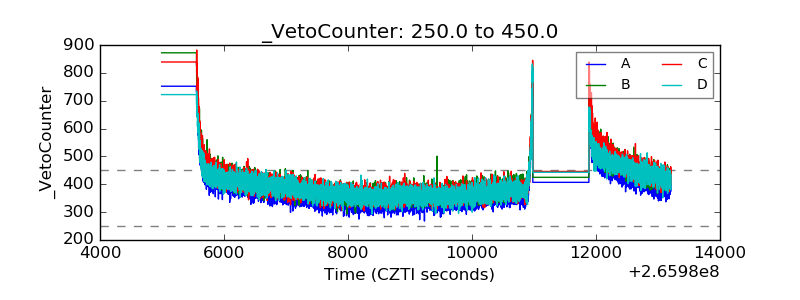 |