| Param | Original file | Final file |
|---|---|---|
| Filename | modeM0/AS1G08_081T01_9000002144_14543cztM0_level2.evt | modeM0/AS1G08_081T01_9000002144_14543cztM0_level2_quad_clean.evt |
| Size (bytes) | 541,414,080 | 88,790,400 |
| Size | 516.3 MB | 84.7 MB |
| Events in quadrant A | 3,478,648 | 584,036 |
| Events in quadrant B | 3,359,147 | 570,510 |
| Events in quadrant C | 3,418,107 | 563,684 |
| Events in quadrant D | 5,726,385 | 542,927 |
| Mode M9 | |||
|---|---|---|---|
| Quadrant | BADHDUFLAG | Total packets | Discarded packets |
| A | 0 | 12 | 0 |
| B | 0 | 12 | 0 |
| C | 0 | 12 | 0 |
| D | 0 | 12 | 0 |
| Mode SS | |||
|---|---|---|---|
| Quadrant | BADHDUFLAG | Total packets | Discarded packets |
| A | 0 | 124 | 0 |
| B | 0 | 124 | 0 |
| C | 0 | 124 | 0 |
| D | 0 | 124 | 0 |
| Mode M0 | |||
|---|---|---|---|
| Quadrant | BADHDUFLAG | Total packets | Discarded packets |
| A | 0 | 14409 | 2 |
| B | 0 | 14095 | 1 |
| C | 0 | 14175 | 1 |
| D | 0 | 21072 | 1 |
| Quadrant | Total seconds | Saturated seconds | Saturation percentage |
|---|---|---|---|
| A | 6126 | 50 | 0.816193% |
| B | 6126 | 89 | 1.452824% |
| C | 6126 | 58 | 0.946784% |
| D | 6126 | 356 | 5.811296% |
Noise dominated data is calculated using 1-second bins in cleaned event files. If a bin has >2000 counts, and if more than 50% of those come from <1% of pixels, then it is considered to be noise-dominated and hence unusable.
| Quadrant | # 1 sec bins | Bins with >0 counts | Bins with >2000 counts | High rate bins dominated by noise | Noise dominated (total time) | Noise dominated (detector-on time) | Marked lightcurve |
|---|---|---|---|---|---|---|---|
| A | 7312 | 6128 | 1 | 1 | 0.01% | 0.02% | 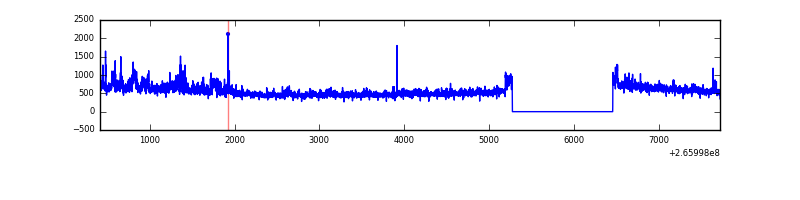 |
| B | 7312 | 6128 | 32 | 32 | 0.44% | 0.52% | 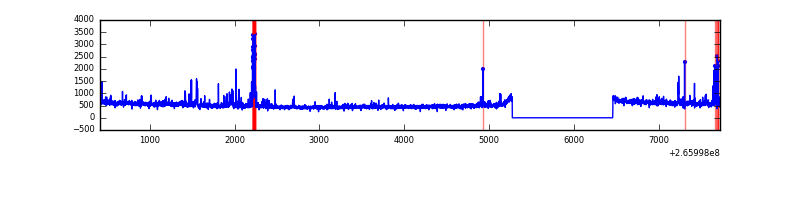 |
| C | 7312 | 6128 | 10 | 10 | 0.14% | 0.16% | 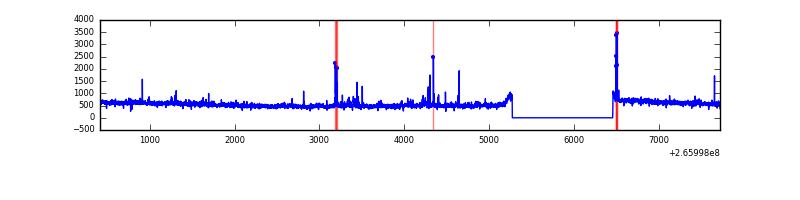 |
| D | 7312 | 6128 | 486 | 486 | 6.65% | 7.93% | 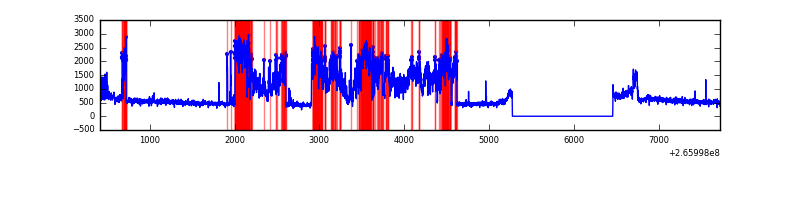 |
Top three noisy pixels from each quadrant. If the there are fewer than three noisy pixels in the level2.evt file, extra rows are filled as -1
| Pixel properties | Quadrant properties | ||||||
|---|---|---|---|---|---|---|---|
| Quadrant | DetID | PixID | Counts | Sigma | Mean | Median | Sigma |
| A | 8 | 15 | 405032 | 2580.38 | 785 | 770 | 156.7 |
| A | 12 | 189 | 44673 | 280.23 | 785 | 770 | 156.7 |
| A | 13 | 248 | 7438 | 42.56 | 785 | 770 | 156.7 |
| B | 0 | 229 | 106415 | 722.41 | 780 | 762 | 146.3 |
| B | 3 | 209 | 41916 | 281.39 | 780 | 762 | 146.3 |
| B | 0 | 189 | 41144 | 276.11 | 780 | 762 | 146.3 |
| C | 3 | 233 | 428385 | 2425.18 | 766 | 773 | 176.3 |
| C | 13 | 61 | 5511 | 26.87 | 766 | 773 | 176.3 |
| C | 14 | 234 | 3337 | 14.54 | 766 | 773 | 176.3 |
| D | 12 | 110 | 2648951 | 14262.84 | 768 | 748 | 185.7 |
| D | 13 | 122 | 77177 | 411.64 | 768 | 748 | 185.7 |
| D | 2 | 152 | 46736 | 247.68 | 768 | 748 | 185.7 |
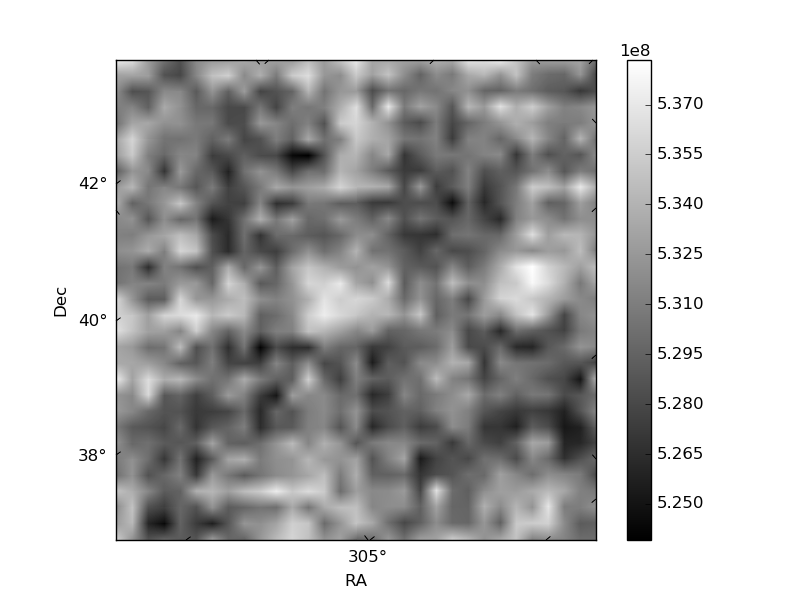
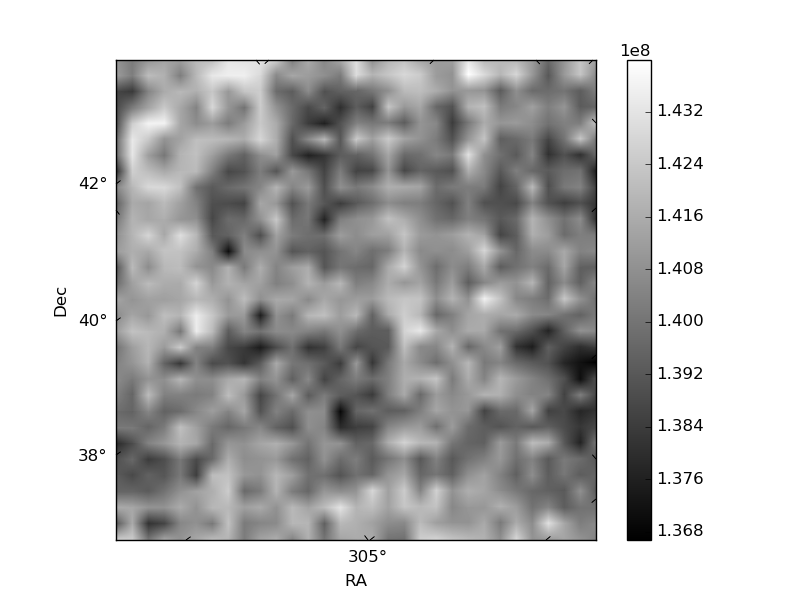
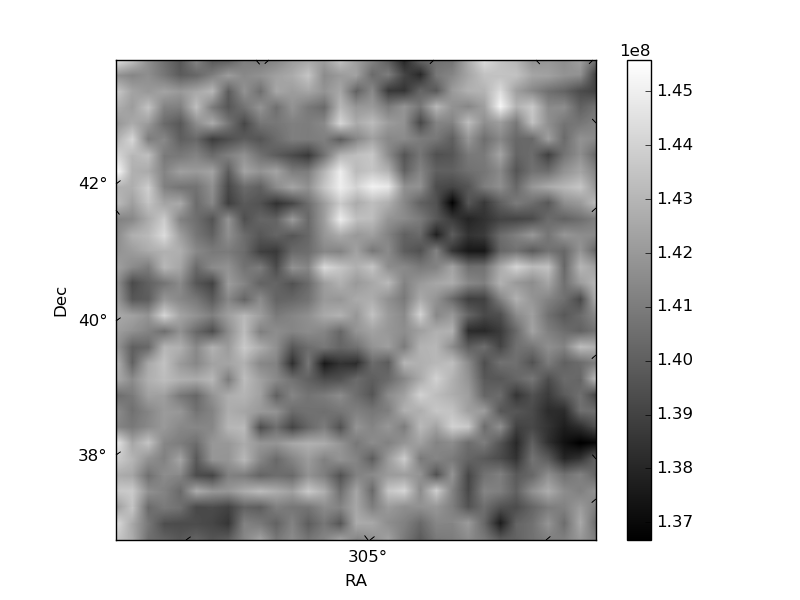
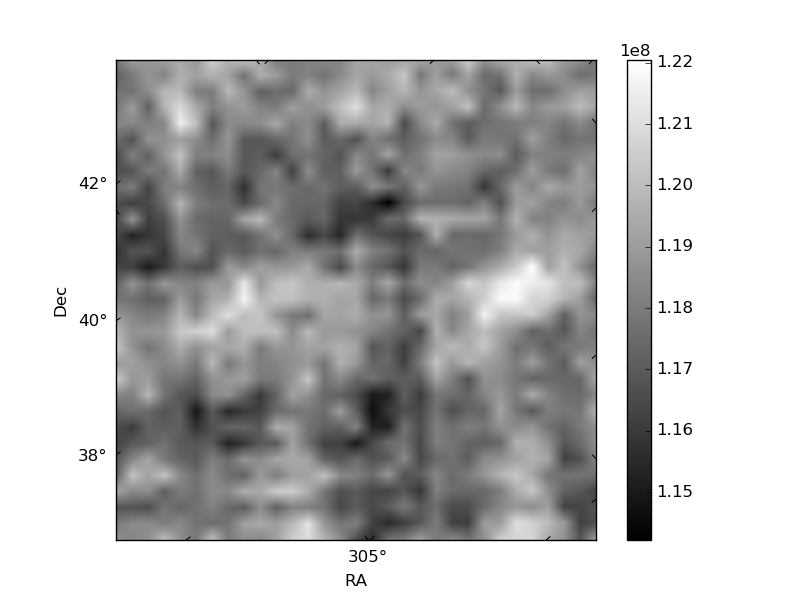
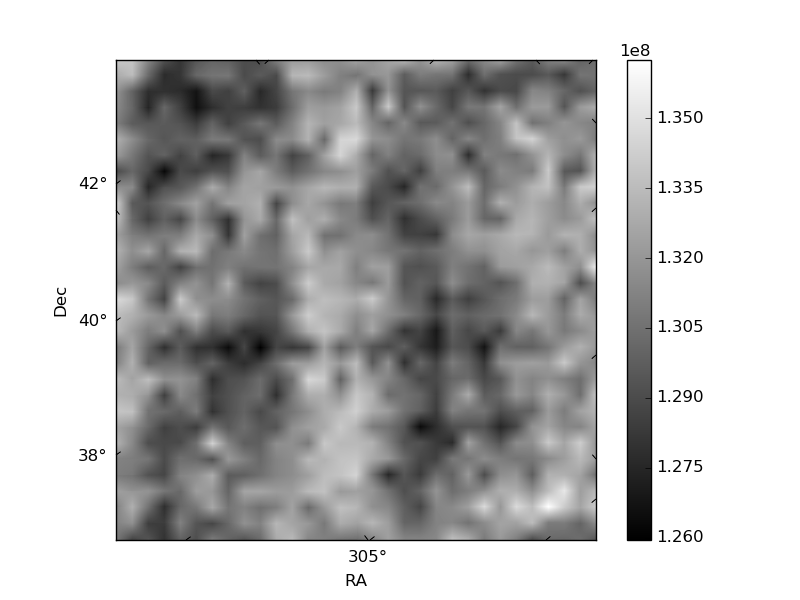
Histogram calculated using DETX and DETY for each event in the final _common_clean file
| Quadrant A | 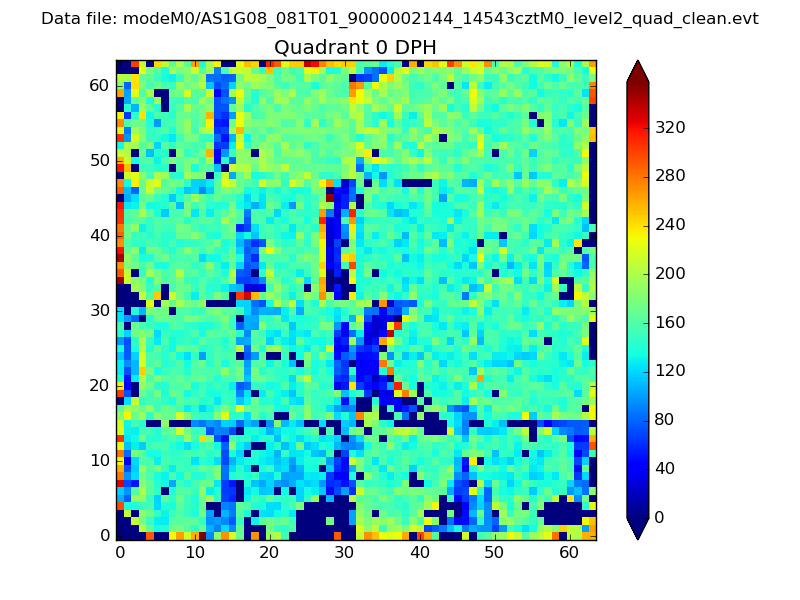 |
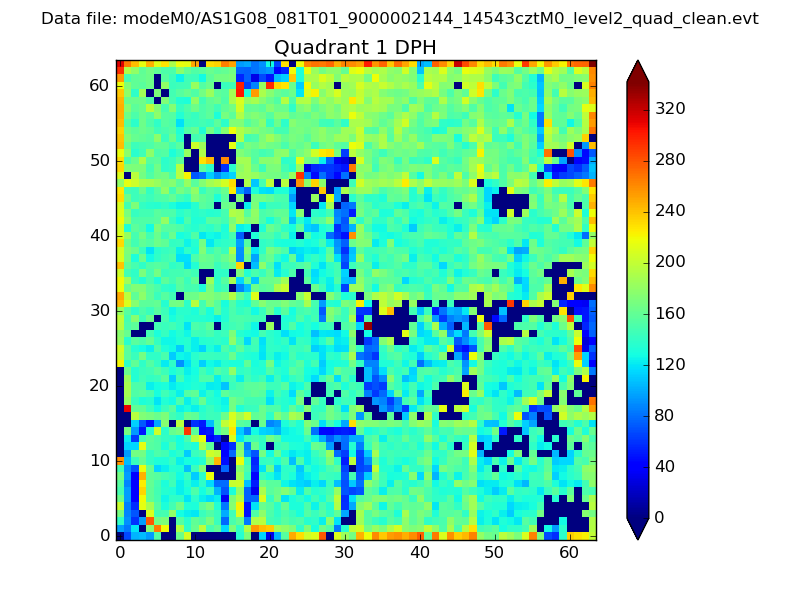 |
Quadrant B |
|---|---|---|---|
| Quadrant D | 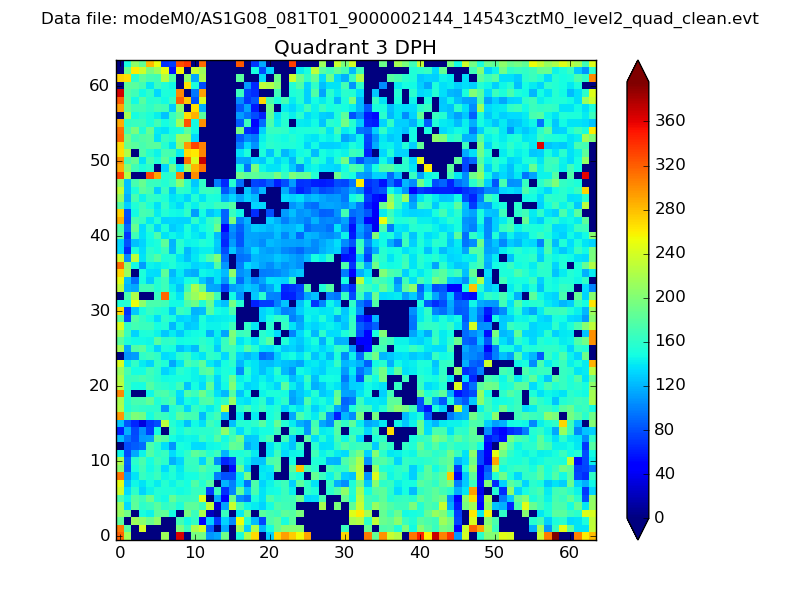 |
 |
Quadrant C |
| Plot type | Count rate plots | Images |
|---|---|---|
| Comparison with Poisson distribution Blue bars denote a histogram of data divided into 1 sec bins. Red curve is a Poisson curve with rate = median count rate of data. |
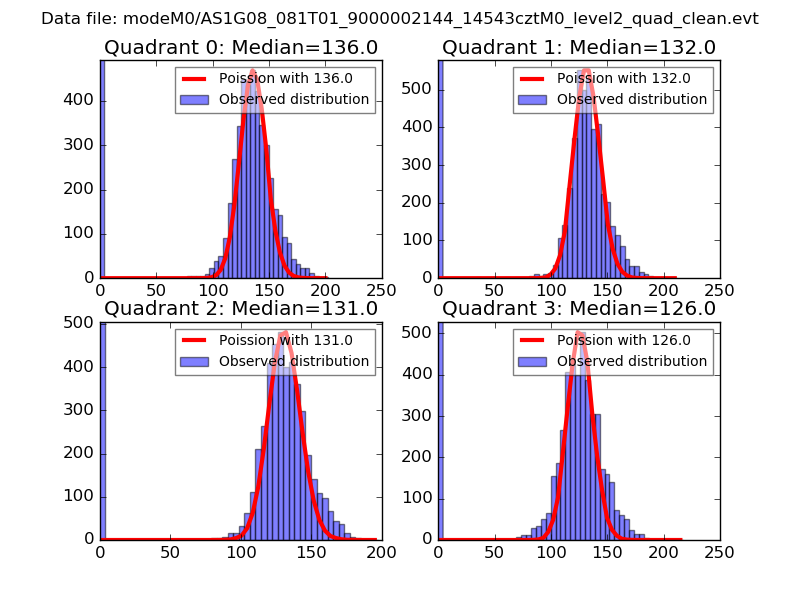 |
 |
| Quadrant-wise count rates Data is divided into 100 sec bins |
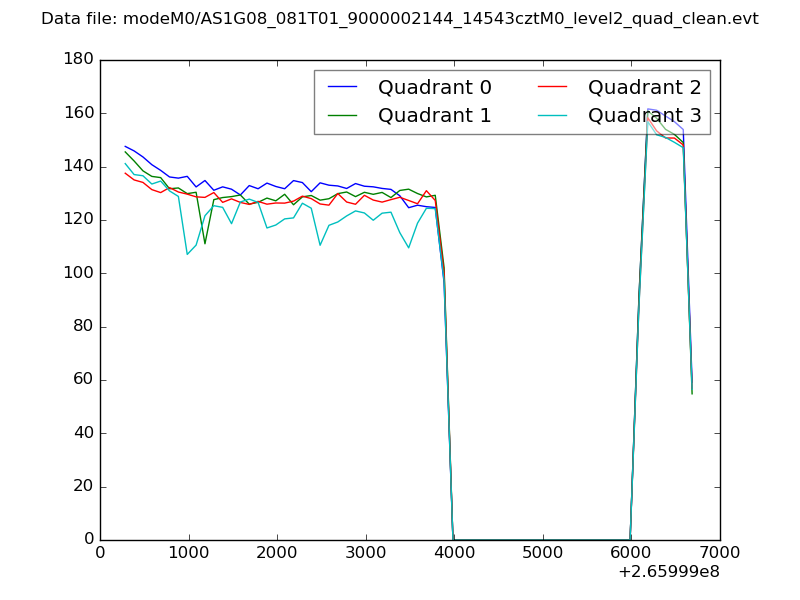 |
|
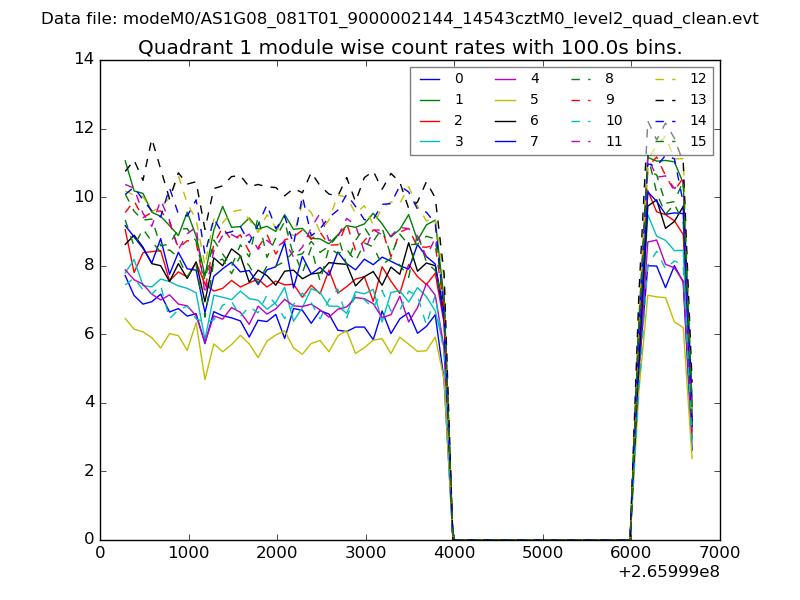
| Module-wise count rates for Quadrant A Data is divided into 100 sec bins |
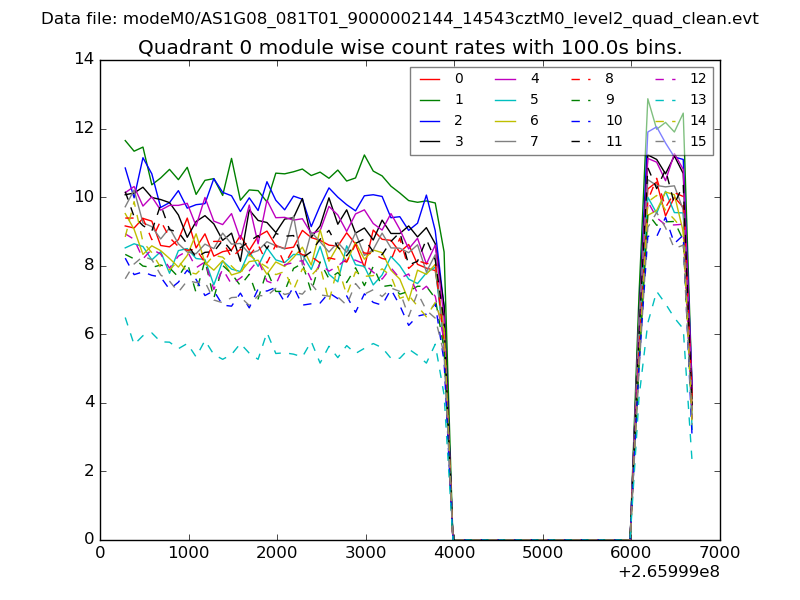 |
 |
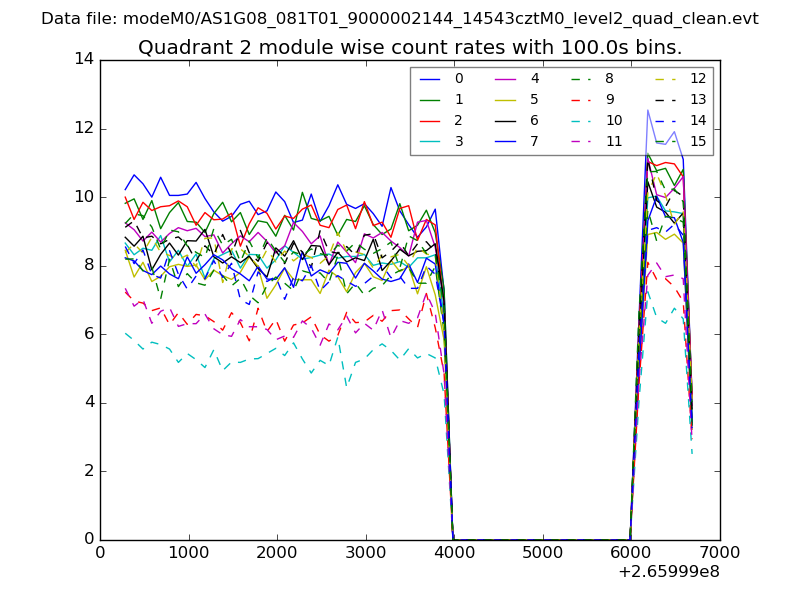
| Module-wise count rates for Quadrant B Data is divided into 100 sec bins |
 |
 |
| Module-wise count rates for Quadrant C Data is divided into 100 sec bins |
 |
 |
| Module-wise count rates for Quadrant D Data is divided into 100 sec bins |
 |
 |
| Parameter | Plot |
|---|---|
| CZT HV Monitor | 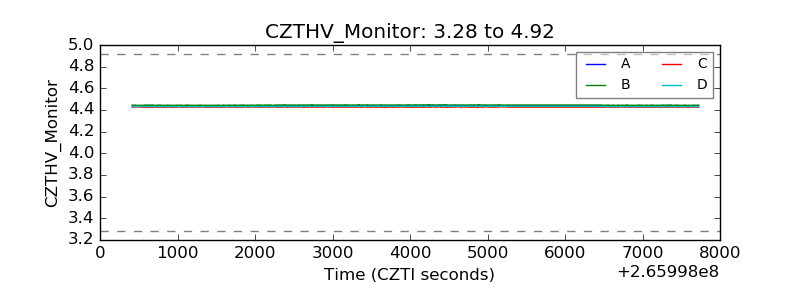 |
| D_VDD | 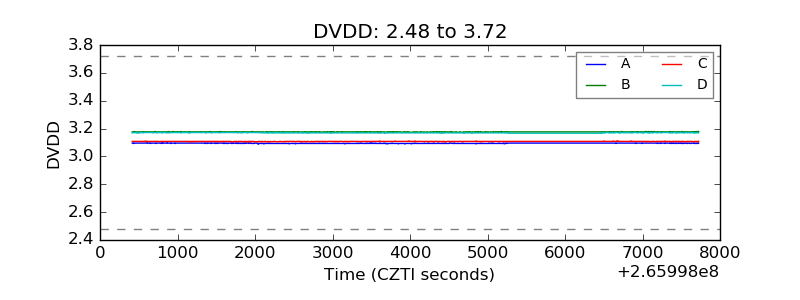 |
| Temperature 1 | 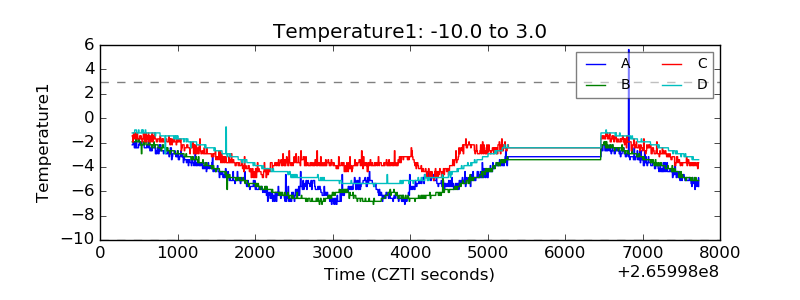 |
| Veto HV Monitor | 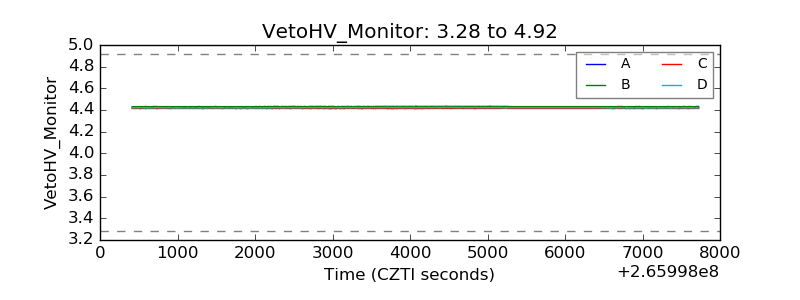 |
| Veto LLD | 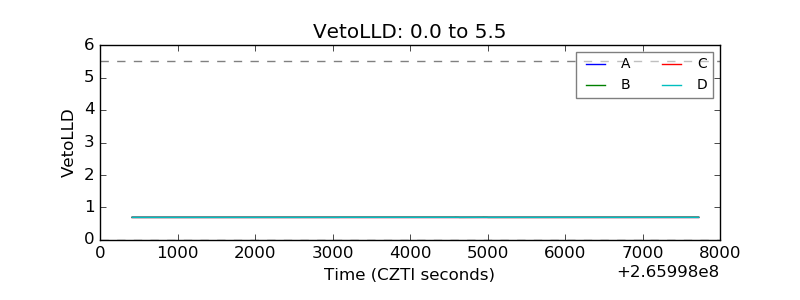 |
| Alpha Counter | 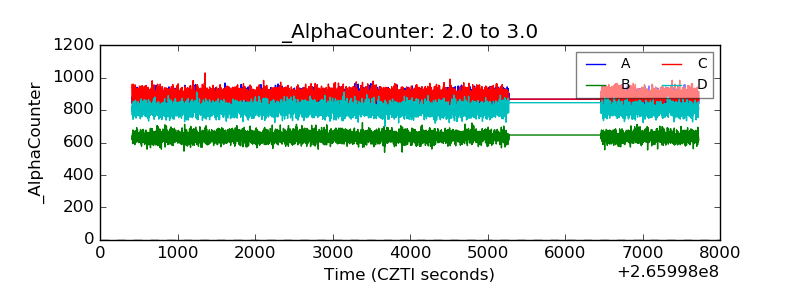 |
| _CPM_Rate | 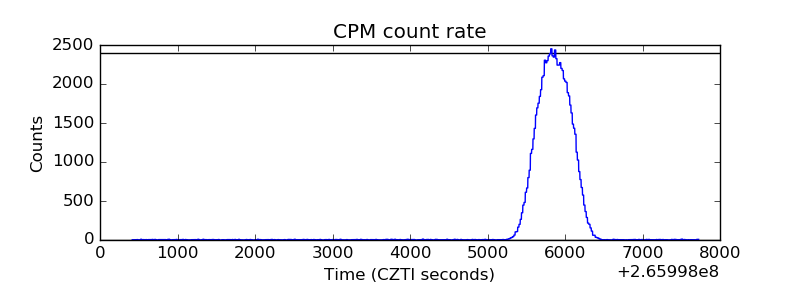 |
| CZT Counter | 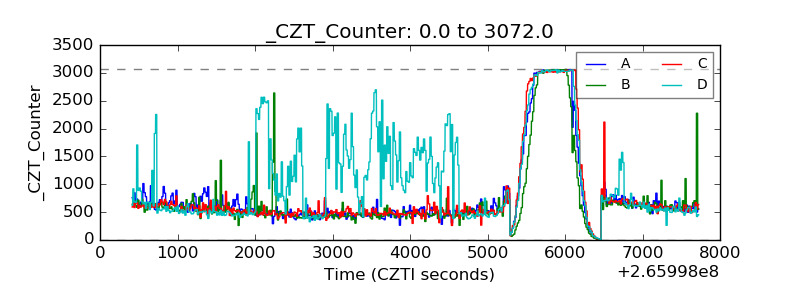 |
| +2.5 Volts monitor |  |
| +5 Volts monitor |  |
| _ROLL_ROT | 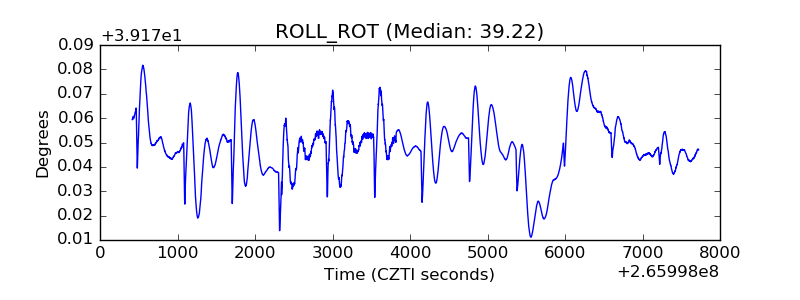 |
| _Roll_DEC |  |
| _Roll_RA | 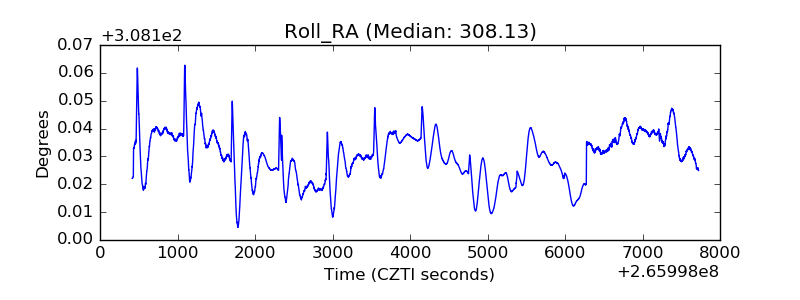 |
| Veto Counter | 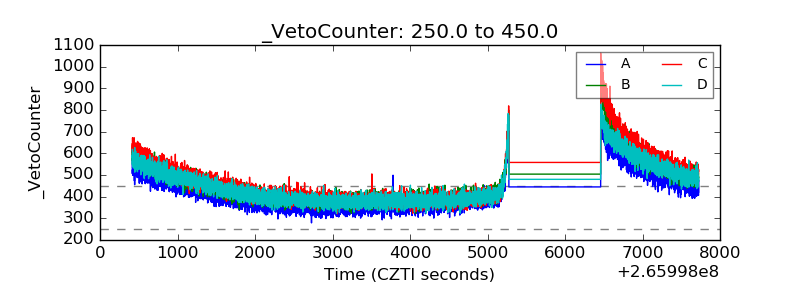 |