| Param | Original file | Final file |
|---|---|---|
| Filename | modeM0/AS1G08_081T01_9000002144_14545cztM0_level2.evt | modeM0/AS1G08_081T01_9000002144_14545cztM0_level2_quad_clean.evt |
| Size (bytes) | 521,193,600 | 107,645,760 |
| Size | 497.0 MB | 102.7 MB |
| Events in quadrant A | 3,772,050 | 707,989 |
| Events in quadrant B | 3,833,353 | 697,556 |
| Events in quadrant C | 3,819,785 | 699,044 |
| Events in quadrant D | 3,901,236 | 684,915 |
| Mode M9 | |||
|---|---|---|---|
| Quadrant | BADHDUFLAG | Total packets | Discarded packets |
| A | 0 | 25 | 0 |
| B | 0 | 25 | 0 |
| C | 0 | 25 | 0 |
| D | 0 | 25 | 0 |
| Mode SS | |||
|---|---|---|---|
| Quadrant | BADHDUFLAG | Total packets | Discarded packets |
| A | 0 | 140 | 0 |
| B | 0 | 140 | 0 |
| C | 0 | 140 | 0 |
| D | 0 | 140 | 0 |
| Mode M0 | |||
|---|---|---|---|
| Quadrant | BADHDUFLAG | Total packets | Discarded packets |
| A | 0 | 15694 | 3 |
| B | 0 | 15940 | 2 |
| C | 0 | 15649 | 2 |
| D | 0 | 16058 | 2 |
| Quadrant | Total seconds | Saturated seconds | Saturation percentage |
|---|---|---|---|
| A | 6752 | 74 | 1.095972% |
| B | 6752 | 122 | 1.806872% |
| C | 6752 | 73 | 1.081161% |
| D | 6752 | 89 | 1.318128% |
Noise dominated data is calculated using 1-second bins in cleaned event files. If a bin has >2000 counts, and if more than 50% of those come from <1% of pixels, then it is considered to be noise-dominated and hence unusable.
| Quadrant | # 1 sec bins | Bins with >0 counts | Bins with >2000 counts | High rate bins dominated by noise | Noise dominated (total time) | Noise dominated (detector-on time) | Marked lightcurve |
|---|---|---|---|---|---|---|---|
| A | 9228 | 6755 | 2 | 2 | 0.02% | 0.03% | 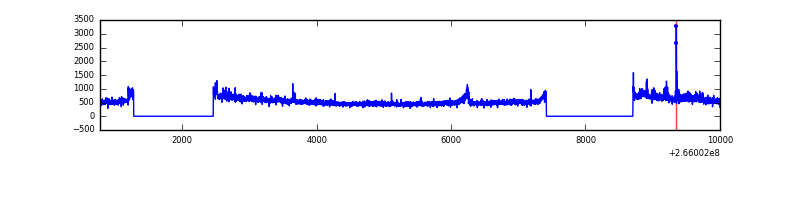 |
| B | 9228 | 6755 | 30 | 30 | 0.33% | 0.44% | 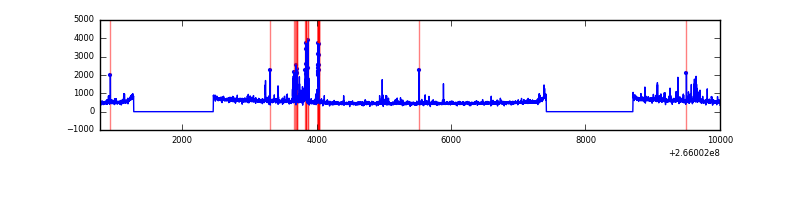 |
| C | 9228 | 6755 | 5 | 5 | 0.05% | 0.07% | 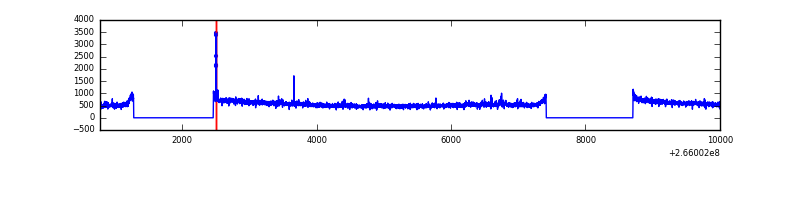 |
| D | 9228 | 6755 | 74 | 74 | 0.80% | 1.10% | 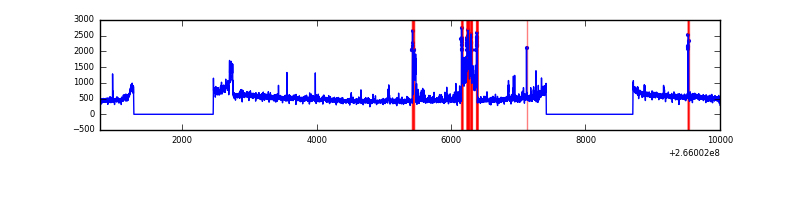 |
Top three noisy pixels from each quadrant. If the there are fewer than three noisy pixels in the level2.evt file, extra rows are filled as -1
| Pixel properties | Quadrant properties | ||||||
|---|---|---|---|---|---|---|---|
| Quadrant | DetID | PixID | Counts | Sigma | Mean | Median | Sigma |
| A | 8 | 15 | 264116 | 1485.37 | 891 | 874 | 177.2 |
| A | 12 | 189 | 40368 | 222.85 | 891 | 874 | 177.2 |
| A | 15 | 69 | 29770 | 163.05 | 891 | 874 | 177.2 |
| B | 4 | 142 | 114673 | 687.83 | 888 | 869 | 165.5 |
| B | 0 | 189 | 94305 | 564.73 | 888 | 869 | 165.5 |
| B | 0 | 229 | 27069 | 158.35 | 888 | 869 | 165.5 |
| C | 3 | 233 | 404655 | 2024.34 | 875 | 882 | 199.5 |
| C | 13 | 61 | 6389 | 27.61 | 875 | 882 | 199.5 |
| C | 14 | 234 | 3730 | 14.28 | 875 | 882 | 199.5 |
| D | 12 | 110 | 347103 | 1650.38 | 878 | 856 | 209.8 |
| D | 2 | 152 | 102813 | 485.97 | 878 | 856 | 209.8 |
| D | 13 | 122 | 78278 | 369.03 | 878 | 856 | 209.8 |
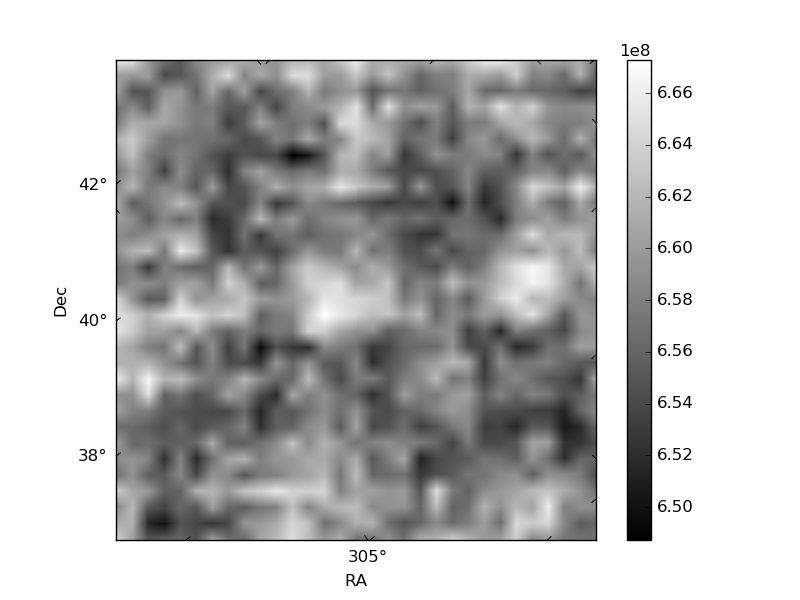
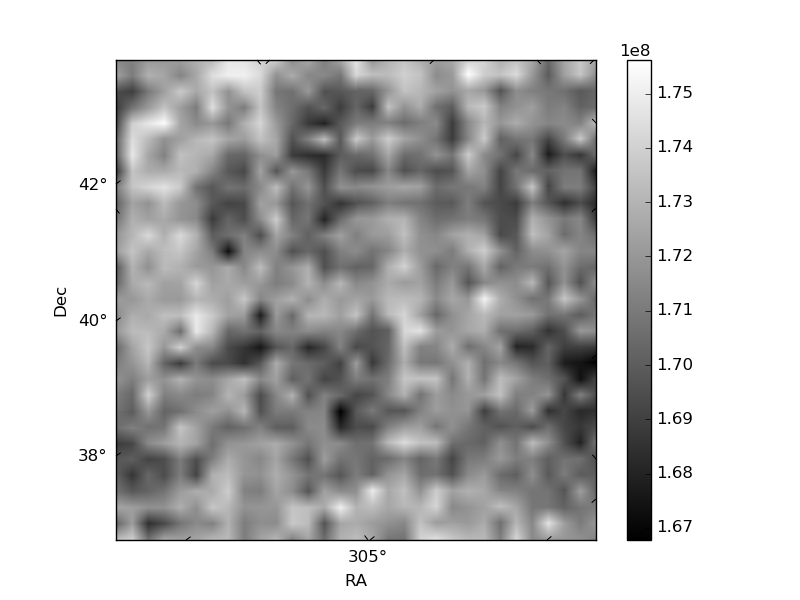
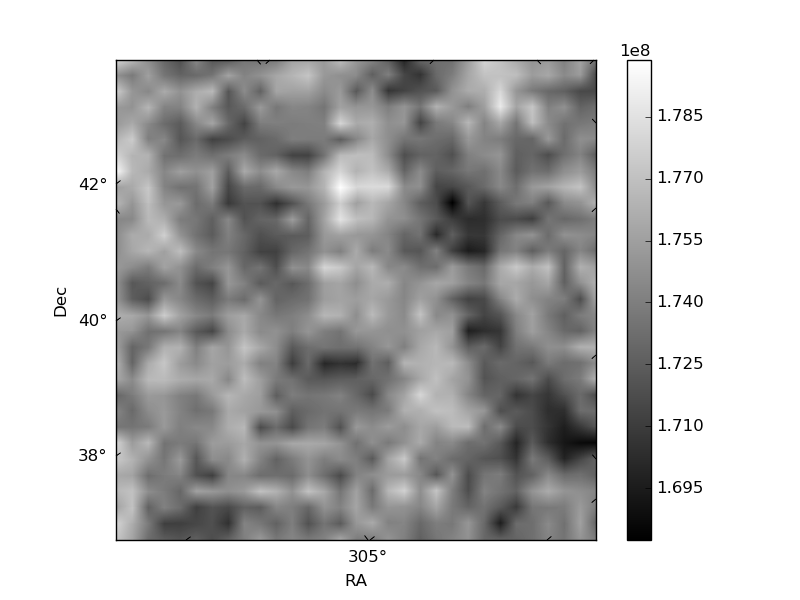
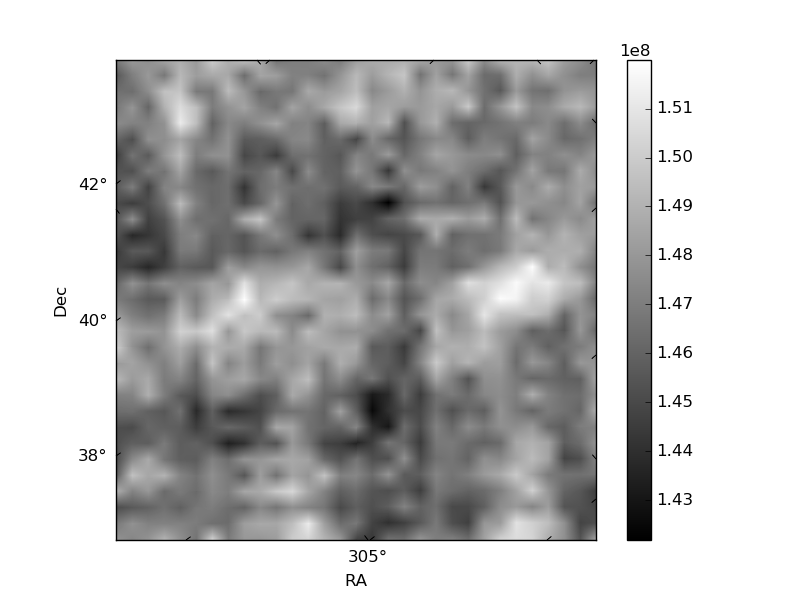
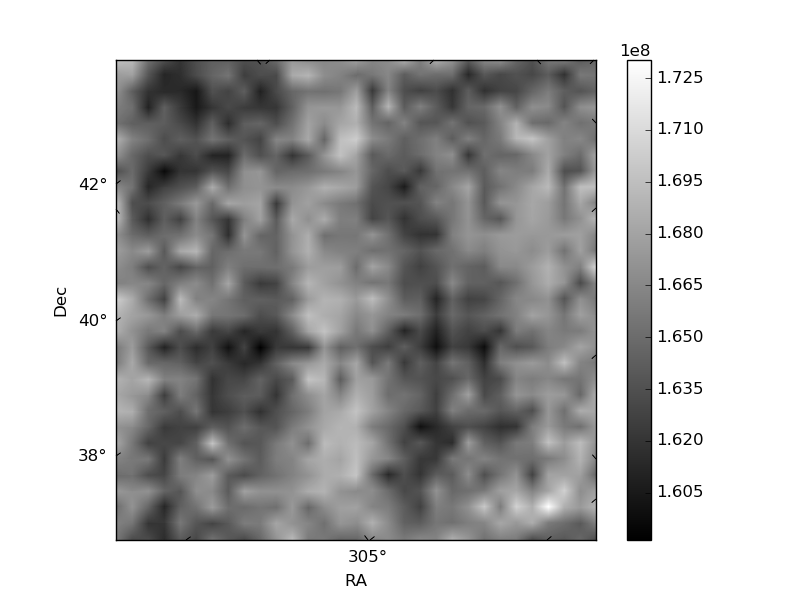
Histogram calculated using DETX and DETY for each event in the final _common_clean file
| Quadrant A | 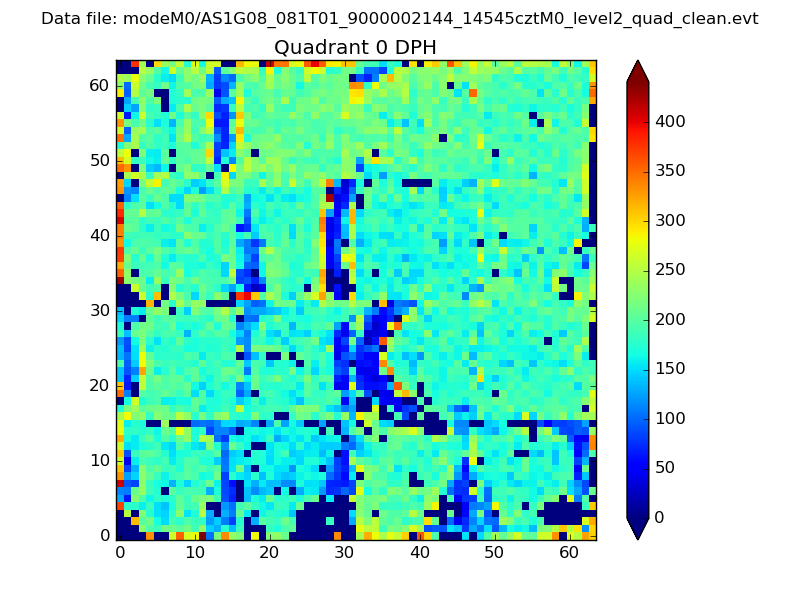 |
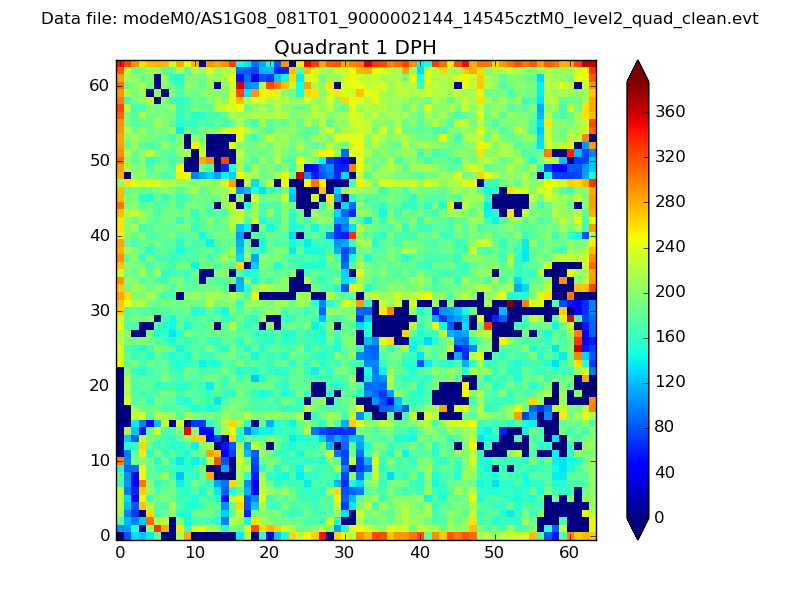 |
Quadrant B |
|---|---|---|---|
| Quadrant D | 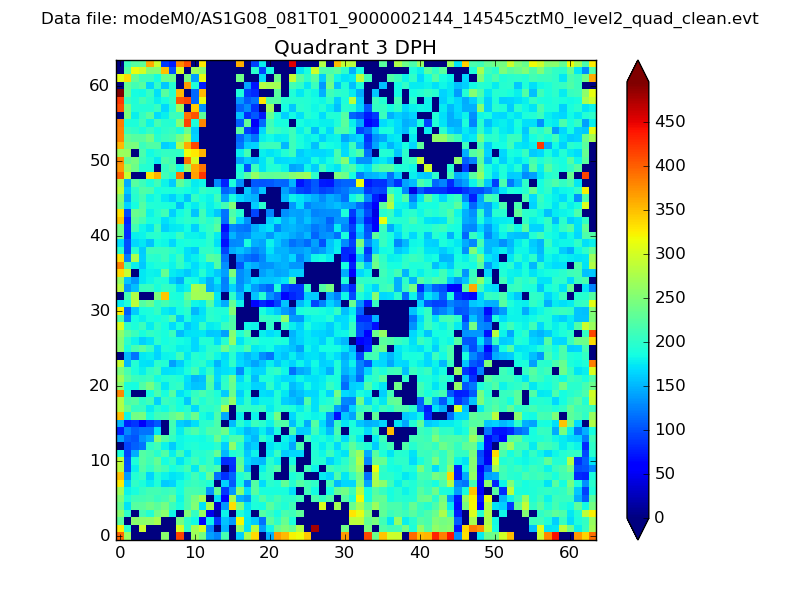 |
 |
Quadrant C |
| Plot type | Count rate plots | Images |
|---|---|---|
| Comparison with Poisson distribution Blue bars denote a histogram of data divided into 1 sec bins. Red curve is a Poisson curve with rate = median count rate of data. |
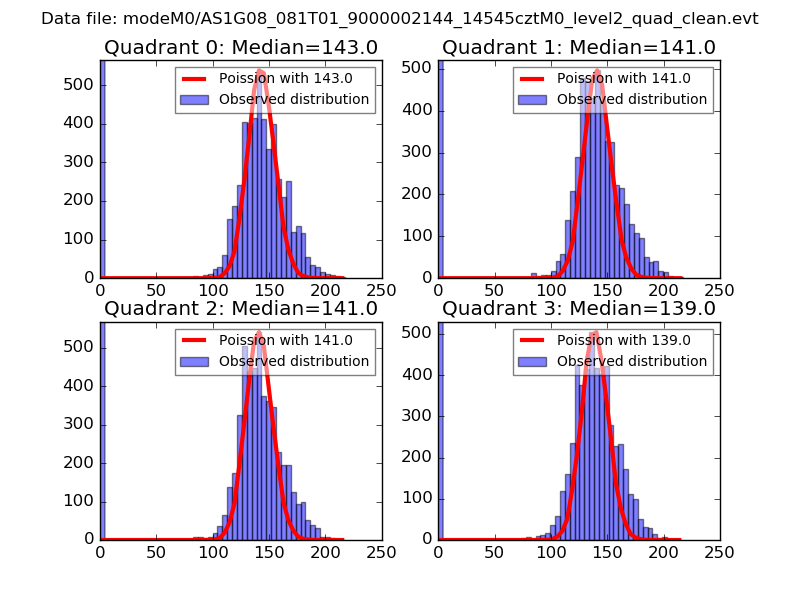 |
 |
| Quadrant-wise count rates Data is divided into 100 sec bins |
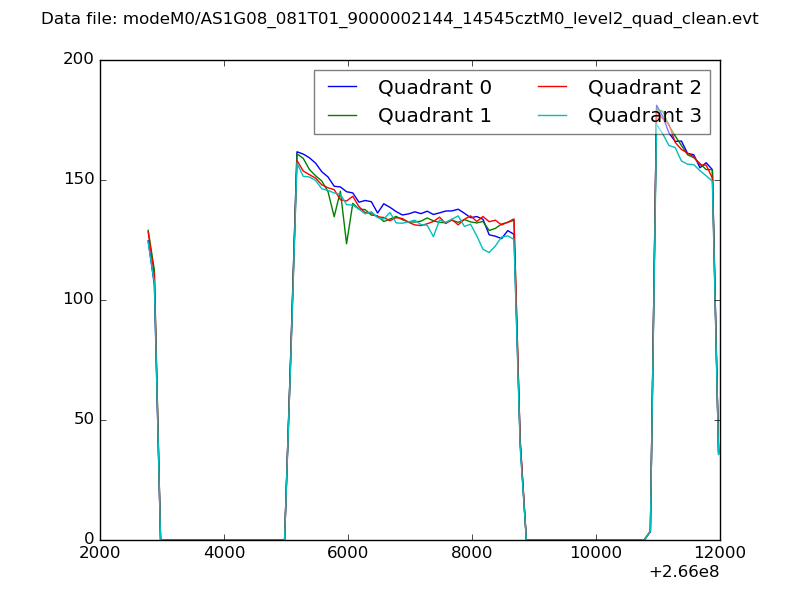 |
|
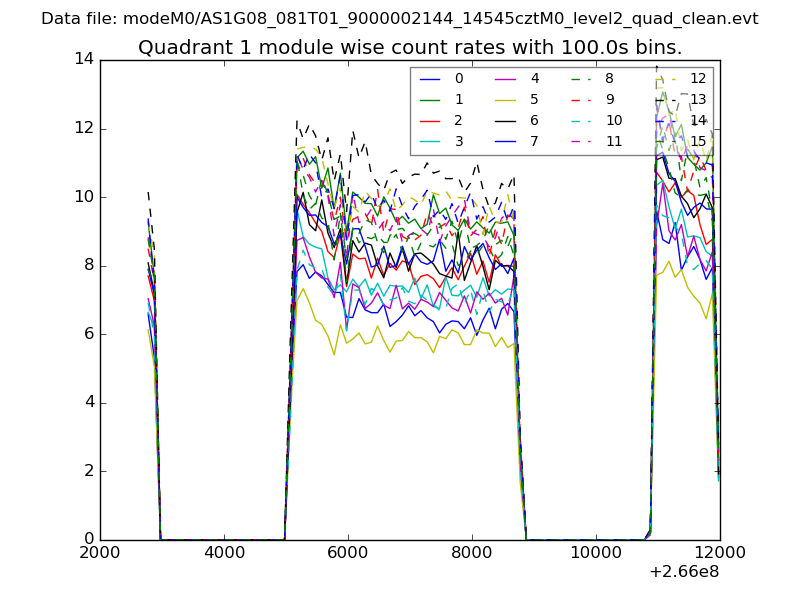
| Module-wise count rates for Quadrant A Data is divided into 100 sec bins |
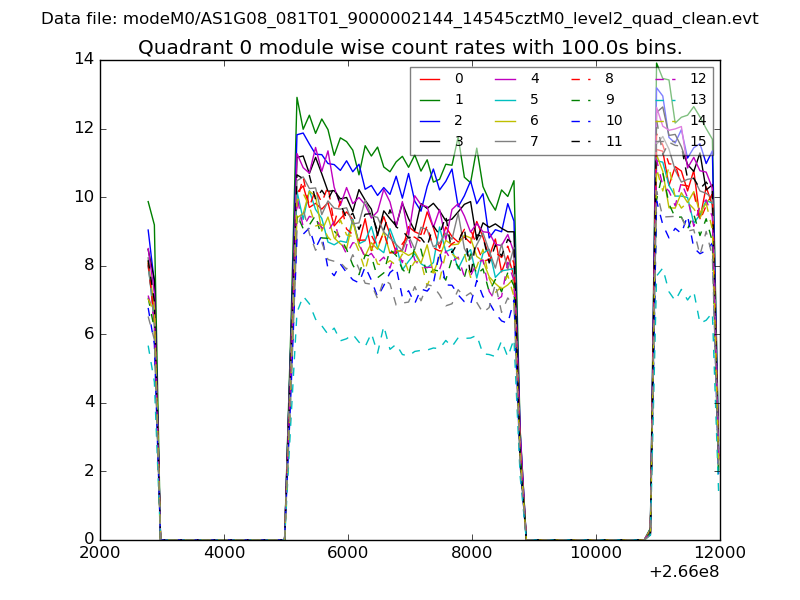 |
 |
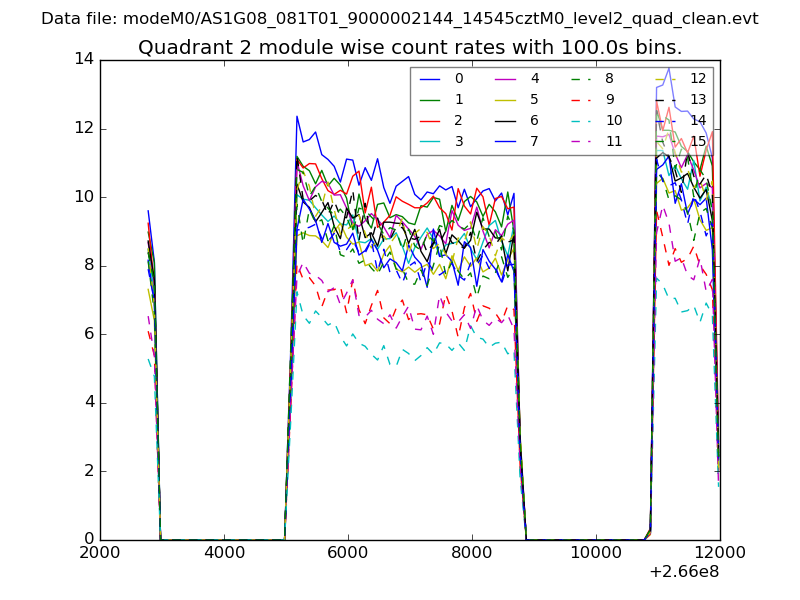
| Module-wise count rates for Quadrant B Data is divided into 100 sec bins |
 |
 |
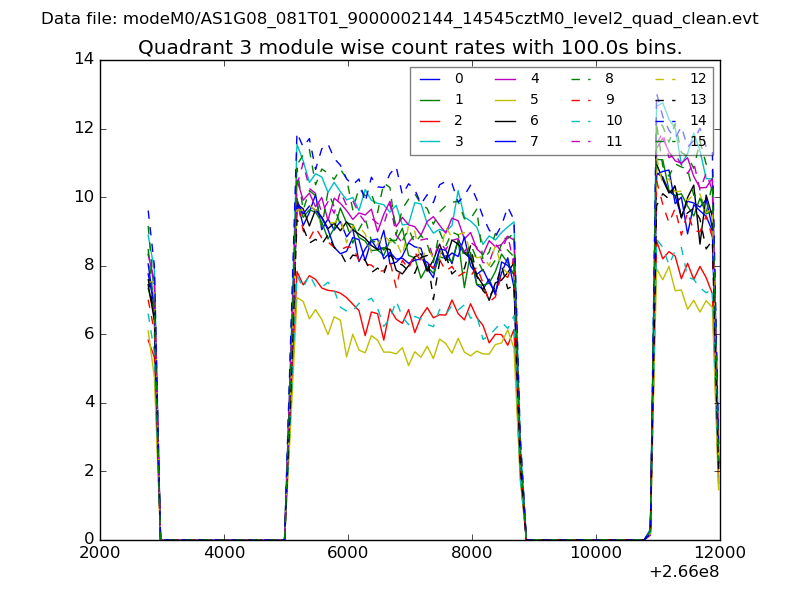
| Module-wise count rates for Quadrant C Data is divided into 100 sec bins |
 |
 |
| Module-wise count rates for Quadrant D Data is divided into 100 sec bins |
 |
 |
| Parameter | Plot |
|---|---|
| CZT HV Monitor | 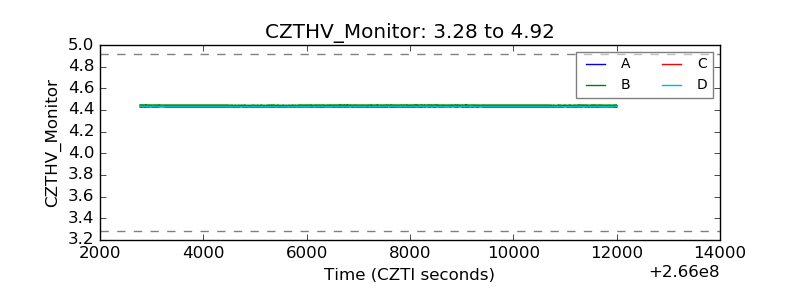 |
| D_VDD | 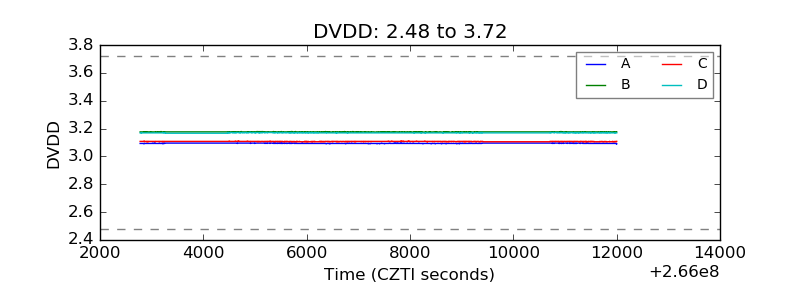 |
| Temperature 1 | 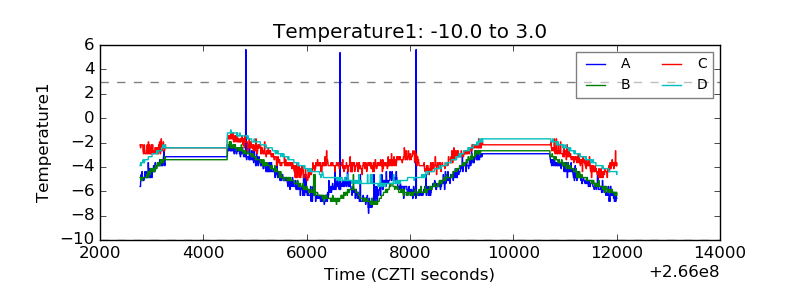 |
| Veto HV Monitor | 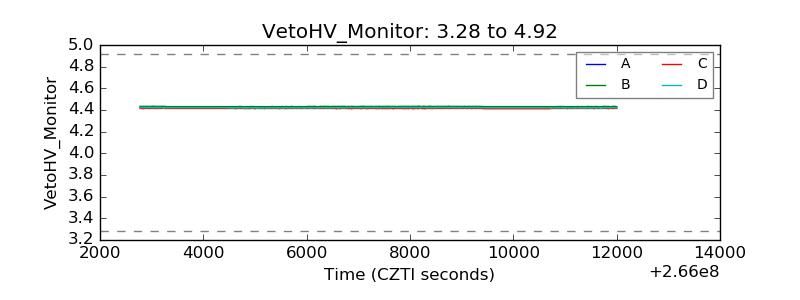 |
| Veto LLD | 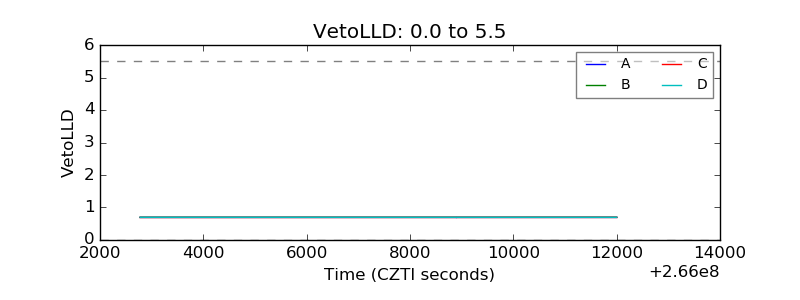 |
| Alpha Counter | 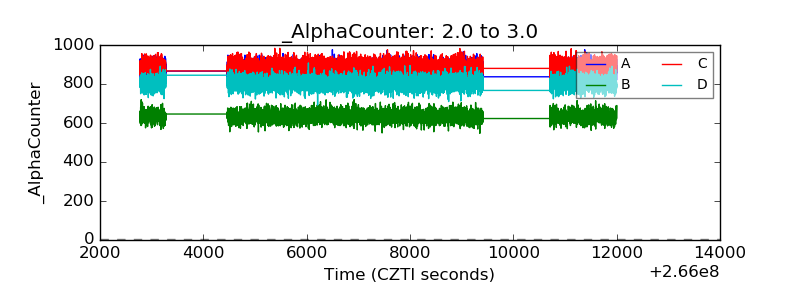 |
| _CPM_Rate | 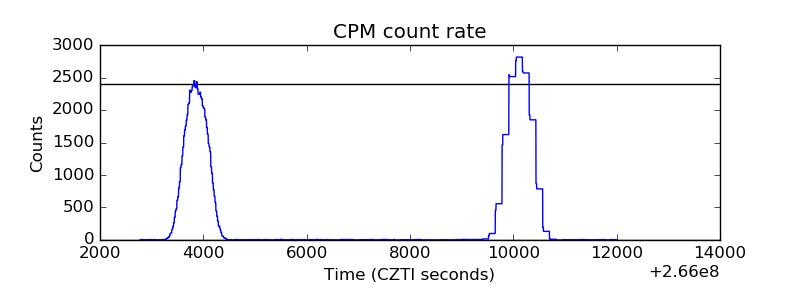 |
| CZT Counter | 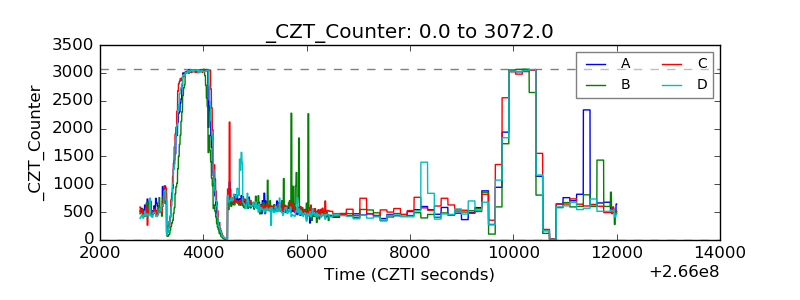 |
| +2.5 Volts monitor | 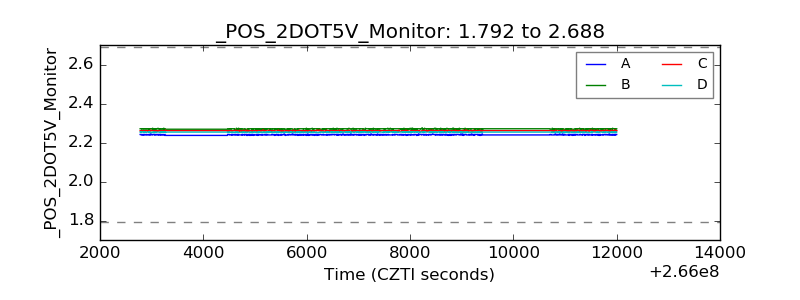 |
| +5 Volts monitor |  |
| _ROLL_ROT | 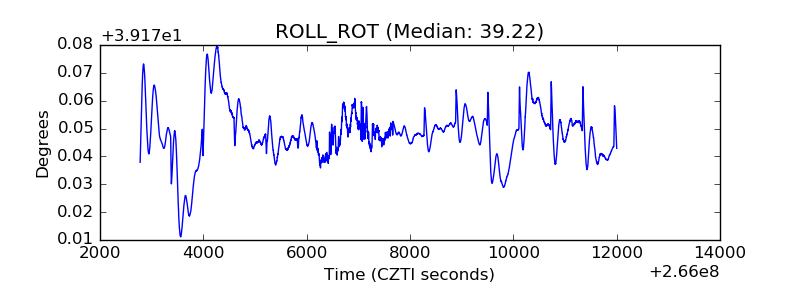 |
| _Roll_DEC |  |
| _Roll_RA | 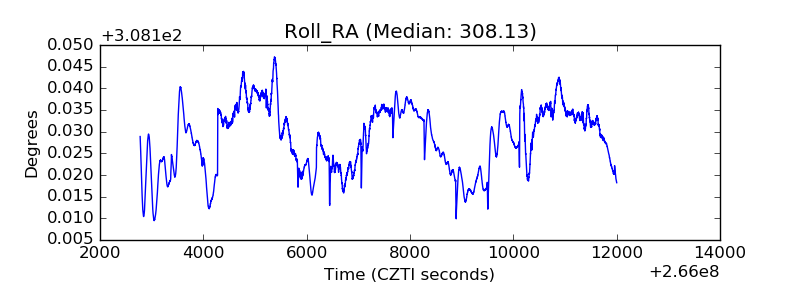 |
| Veto Counter | 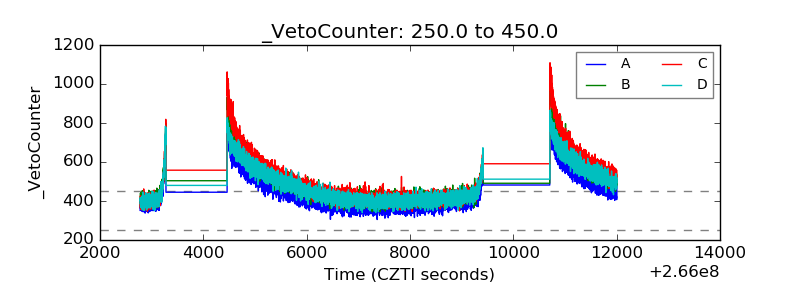 |