| Param | Original file | Final file |
|---|---|---|
| Filename | modeM0/AS1G08_081T01_9000002144_14546cztM0_level2.evt | modeM0/AS1G08_081T01_9000002144_14546cztM0_level2_quad_clean.evt |
| Size (bytes) | 470,508,480 | 112,633,920 |
| Size | 448.7 MB | 107.4 MB |
| Events in quadrant A | 3,512,215 | 748,844 |
| Events in quadrant B | 3,492,309 | 749,631 |
| Events in quadrant C | 3,526,727 | 745,726 |
| Events in quadrant D | 3,290,819 | 727,942 |
| Mode M9 | |||
|---|---|---|---|
| Quadrant | BADHDUFLAG | Total packets | Discarded packets |
| A | 0 | 26 | 0 |
| B | 0 | 26 | 0 |
| C | 0 | 26 | 0 |
| D | 0 | 26 | 0 |
| Mode SS | |||
|---|---|---|---|
| Quadrant | BADHDUFLAG | Total packets | Discarded packets |
| A | 0 | 130 | 0 |
| B | 0 | 130 | 0 |
| C | 0 | 130 | 0 |
| D | 0 | 130 | 0 |
| Mode M0 | |||
|---|---|---|---|
| Quadrant | BADHDUFLAG | Total packets | Discarded packets |
| A | 0 | 14627 | 3 |
| B | 0 | 14547 | 2 |
| C | 0 | 14428 | 2 |
| D | 0 | 13912 | 2 |
| Quadrant | Total seconds | Saturated seconds | Saturation percentage |
|---|---|---|---|
| A | 6293 | 87 | 1.382488% |
| B | 6293 | 112 | 1.779755% |
| C | 6293 | 74 | 1.175910% |
| D | 6293 | 67 | 1.064675% |
Noise dominated data is calculated using 1-second bins in cleaned event files. If a bin has >2000 counts, and if more than 50% of those come from <1% of pixels, then it is considered to be noise-dominated and hence unusable.
| Quadrant | # 1 sec bins | Bins with >0 counts | Bins with >2000 counts | High rate bins dominated by noise | Noise dominated (total time) | Noise dominated (detector-on time) | Marked lightcurve |
|---|---|---|---|---|---|---|---|
| A | 8919 | 6296 | 2 | 2 | 0.02% | 0.03% | 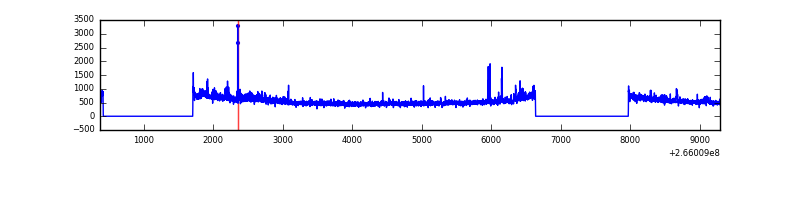 |
| B | 8919 | 6296 | 1 | 1 | 0.01% | 0.02% | 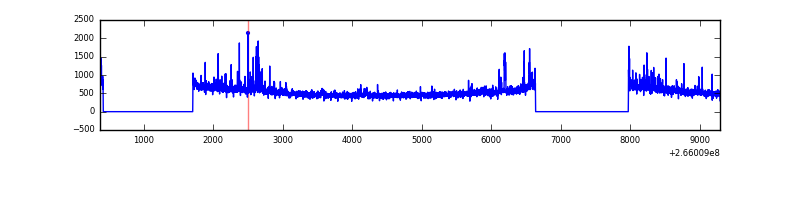 |
| C | 8919 | 6296 | 1 | 1 | 0.01% | 0.02% | 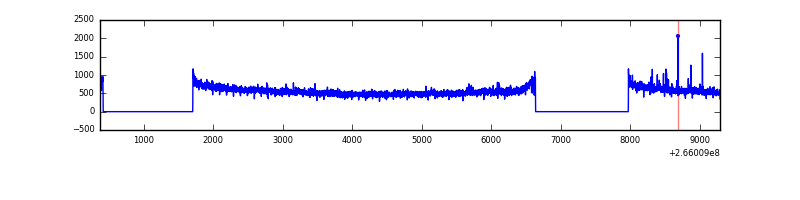 |
| D | 8919 | 6296 | 10 | 10 | 0.11% | 0.16% | 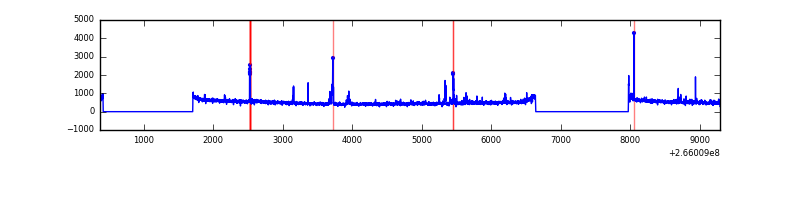 |
Top three noisy pixels from each quadrant. If the there are fewer than three noisy pixels in the level2.evt file, extra rows are filled as -1
| Pixel properties | Quadrant properties | ||||||
|---|---|---|---|---|---|---|---|
| Quadrant | DetID | PixID | Counts | Sigma | Mean | Median | Sigma |
| A | 8 | 15 | 224456 | 1350.56 | 827 | 812 | 165.6 |
| A | 12 | 189 | 60688 | 361.59 | 827 | 812 | 165.6 |
| A | 9 | 143 | 26997 | 158.13 | 827 | 812 | 165.6 |
| B | 0 | 189 | 96026 | 613.72 | 832 | 813 | 155.1 |
| B | 4 | 142 | 32439 | 203.85 | 832 | 813 | 155.1 |
| B | 4 | 48 | 28122 | 176.03 | 832 | 813 | 155.1 |
| C | 3 | 233 | 316942 | 1689.88 | 821 | 826 | 187.1 |
| C | 13 | 61 | 5881 | 27.02 | 821 | 826 | 187.1 |
| C | 8 | 128 | 4770 | 21.08 | 821 | 826 | 187.1 |
| D | 10 | 199 | 53410 | 269.03 | 818 | 797 | 195.6 |
| D | 2 | 152 | 51481 | 259.17 | 818 | 797 | 195.6 |
| D | 2 | 120 | 36314 | 181.61 | 818 | 797 | 195.6 |
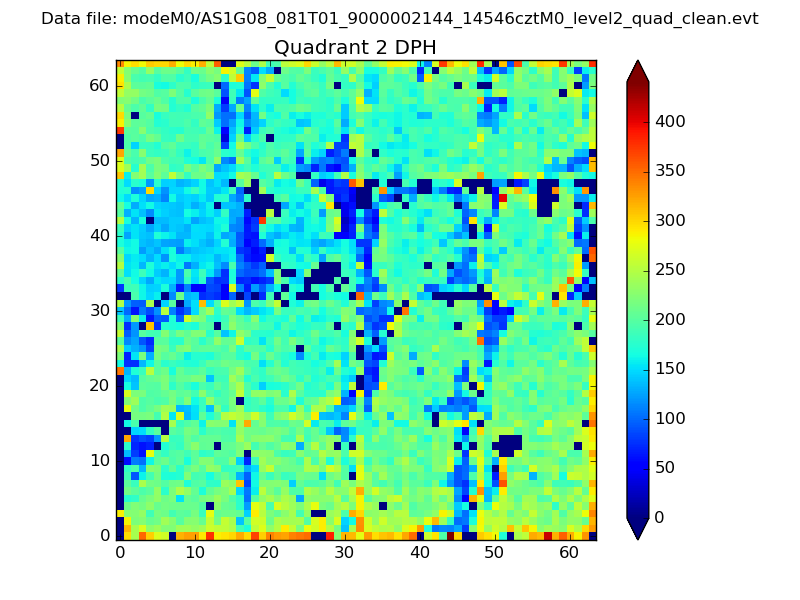
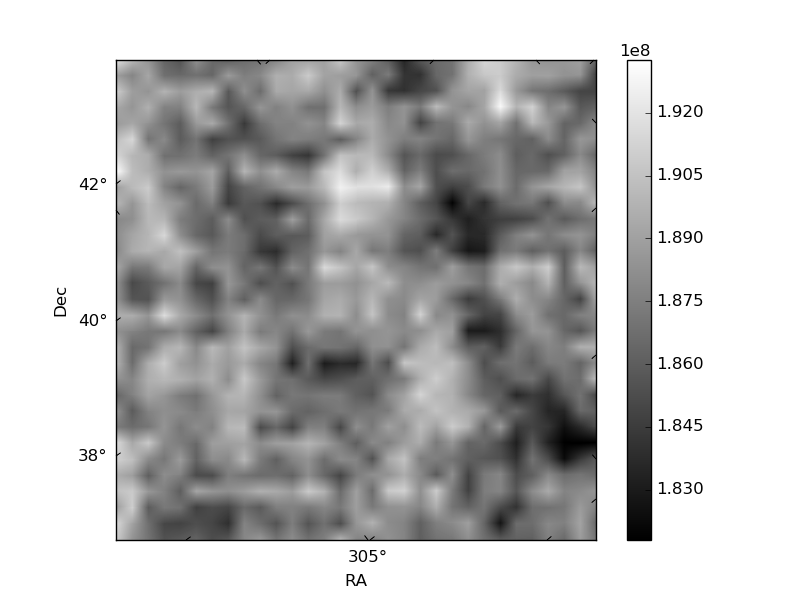
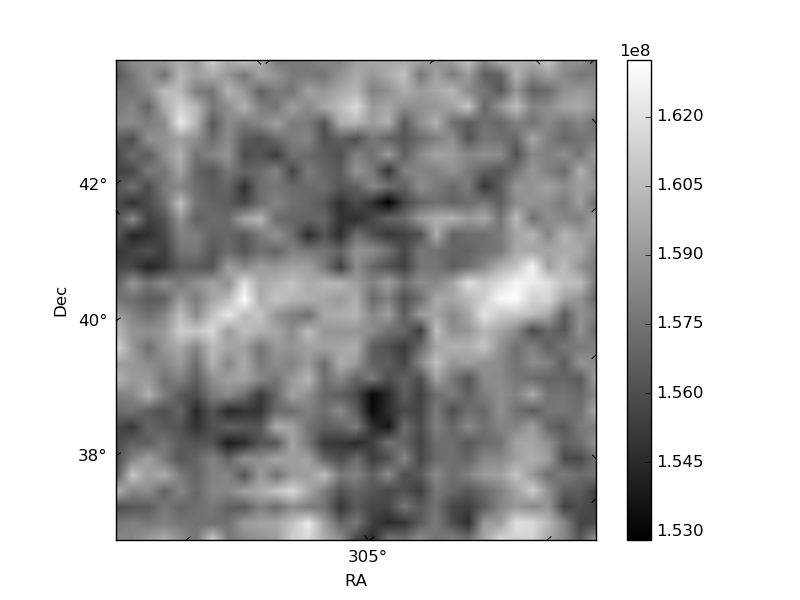
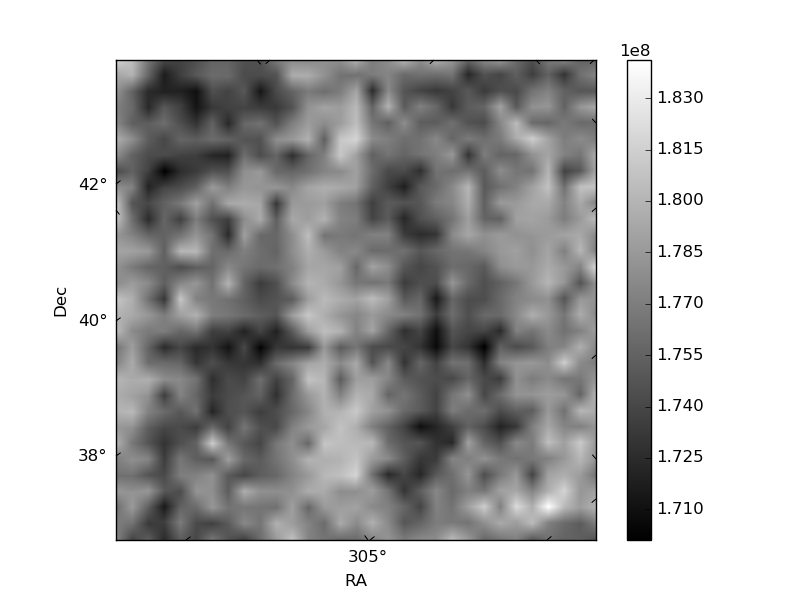
Histogram calculated using DETX and DETY for each event in the final _common_clean file
| Quadrant A | 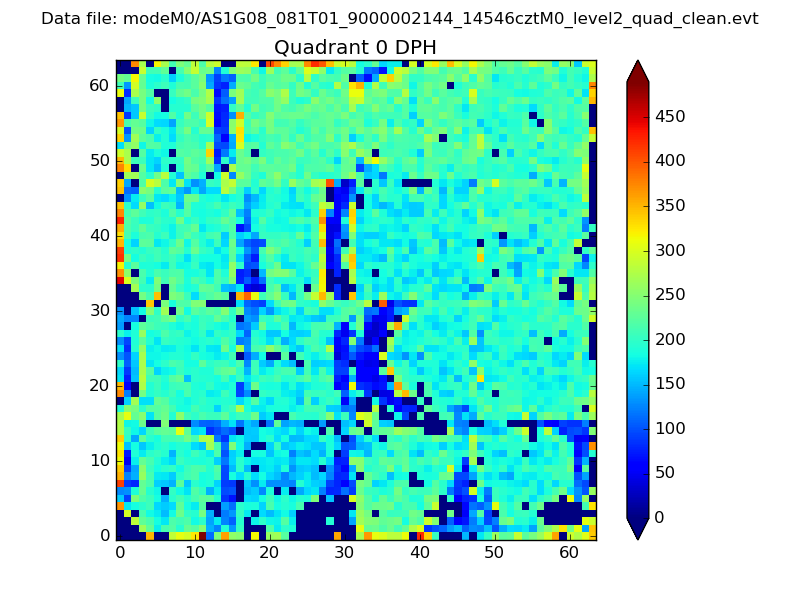 |
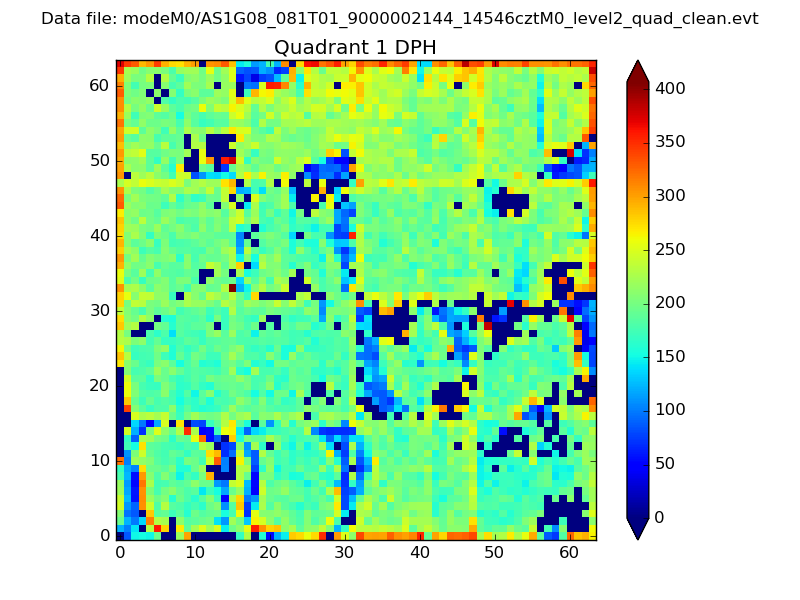 |
Quadrant B |
|---|---|---|---|
| Quadrant D | 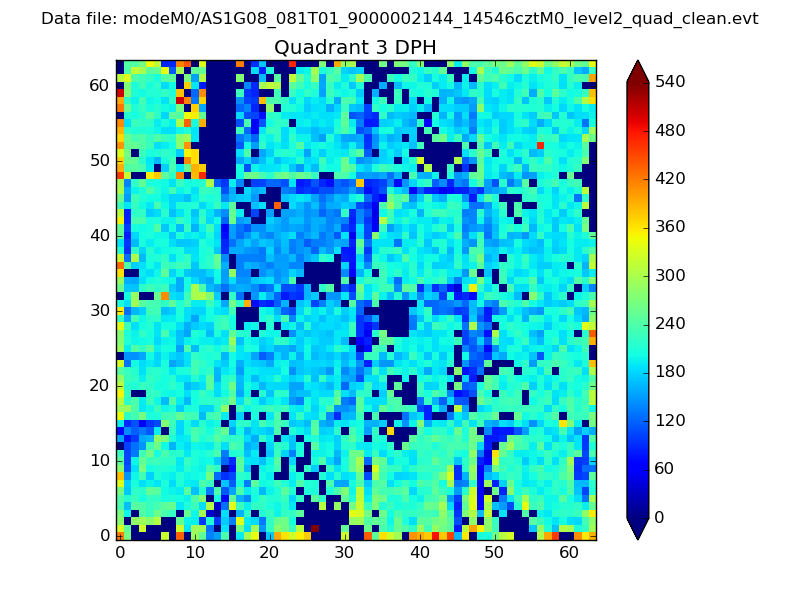 |
 |
Quadrant C |
| Plot type | Count rate plots | Images |
|---|---|---|
| Comparison with Poisson distribution Blue bars denote a histogram of data divided into 1 sec bins. Red curve is a Poisson curve with rate = median count rate of data. |
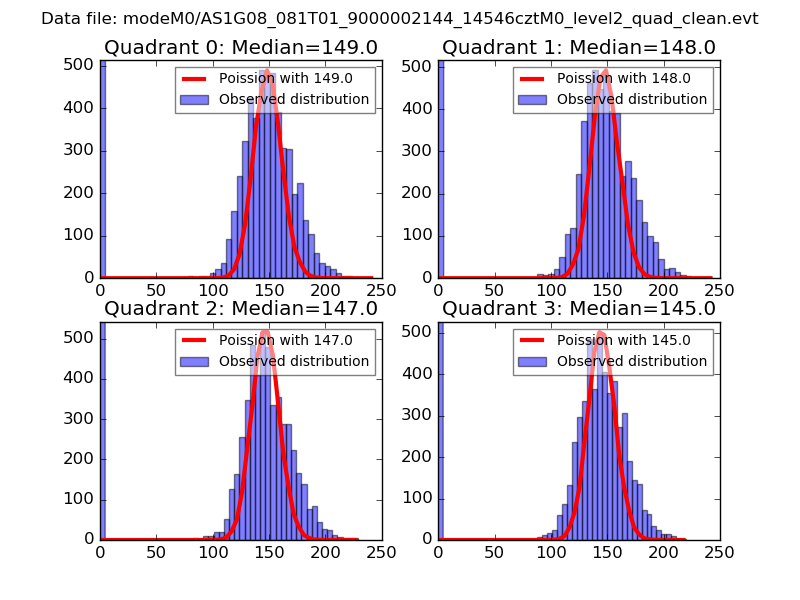 |
 |
| Quadrant-wise count rates Data is divided into 100 sec bins |
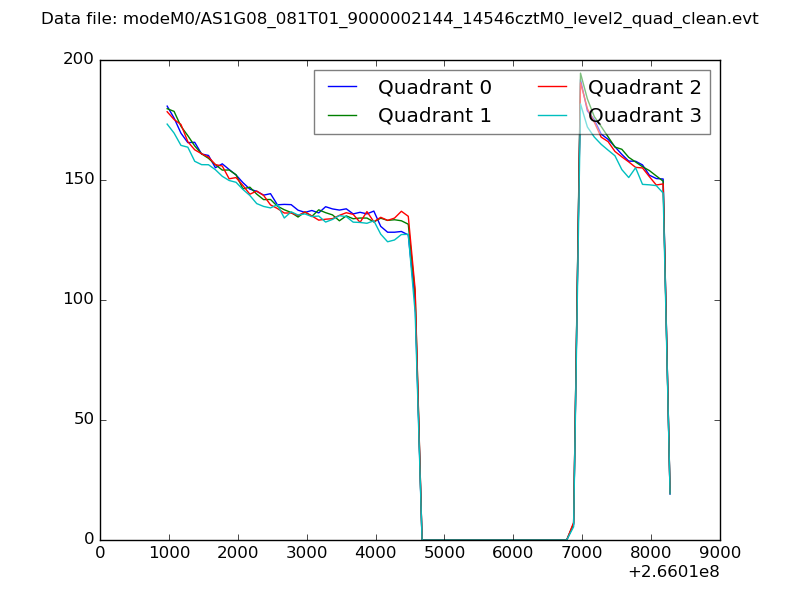 |
|
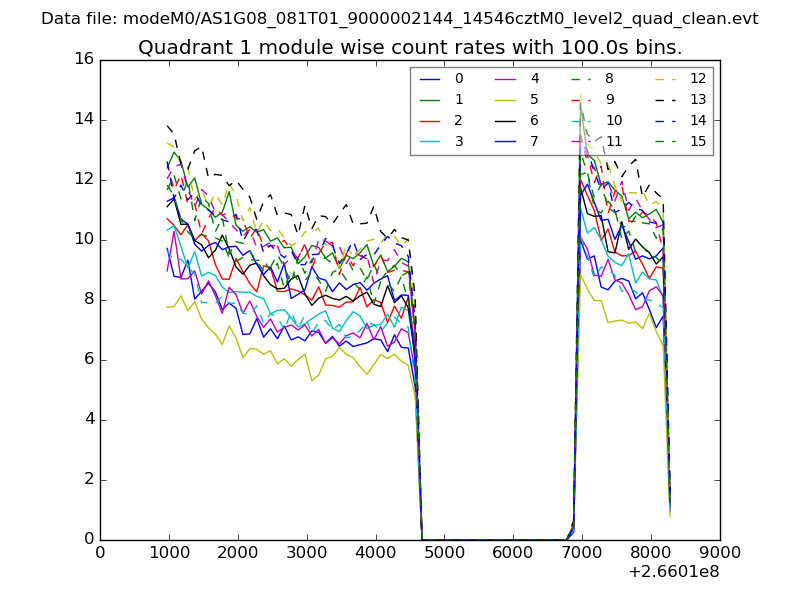
| Module-wise count rates for Quadrant A Data is divided into 100 sec bins |
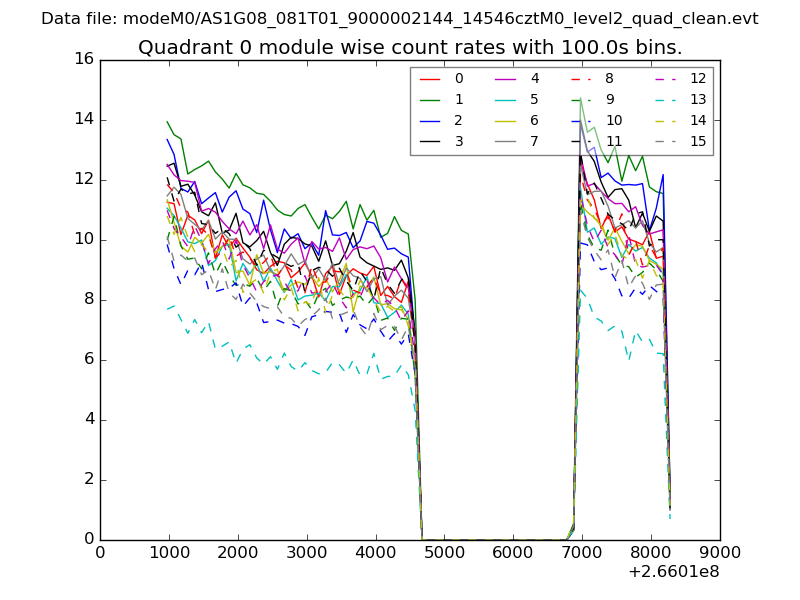 |
 |
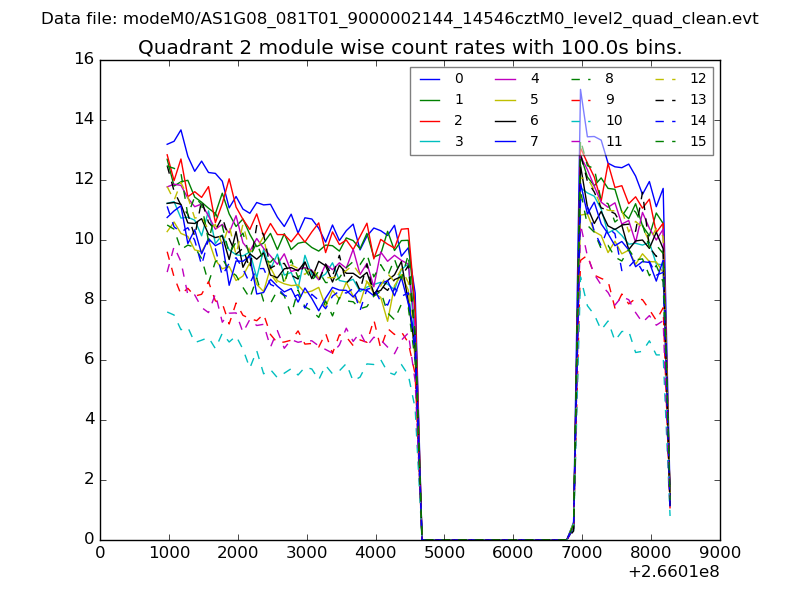
| Module-wise count rates for Quadrant B Data is divided into 100 sec bins |
 |
 |
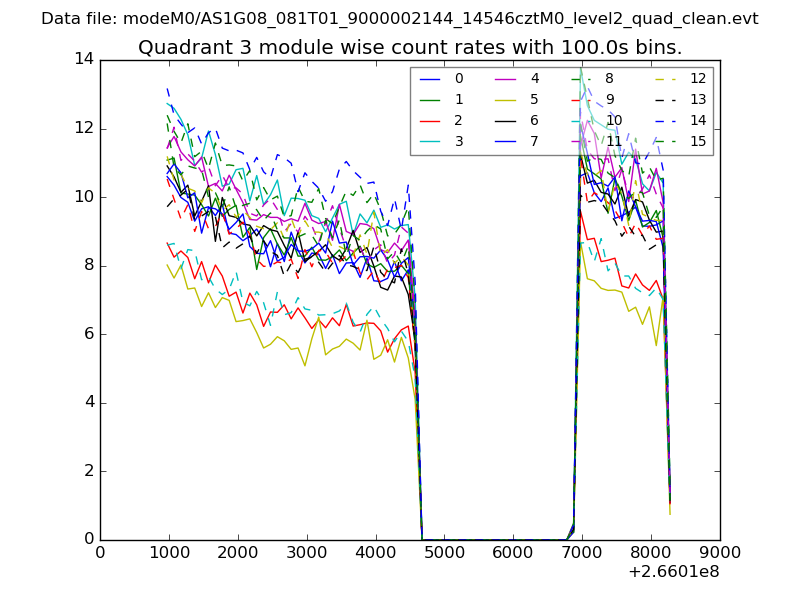
| Module-wise count rates for Quadrant C Data is divided into 100 sec bins |
 |
 |
| Module-wise count rates for Quadrant D Data is divided into 100 sec bins |
 |
 |
| Parameter | Plot |
|---|---|
| CZT HV Monitor | 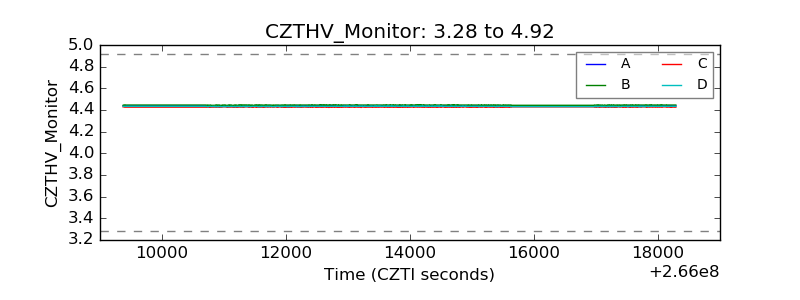 |
| D_VDD | 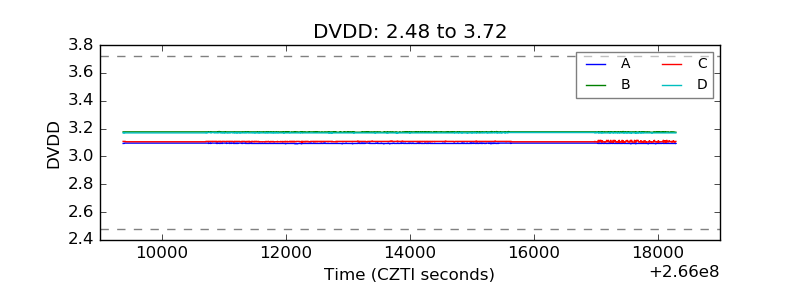 |
| Temperature 1 | 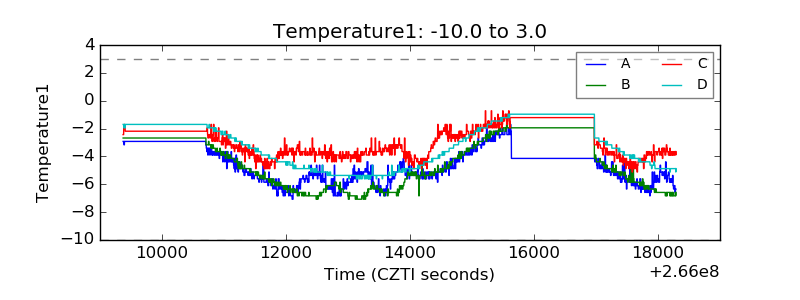 |
| Veto HV Monitor | 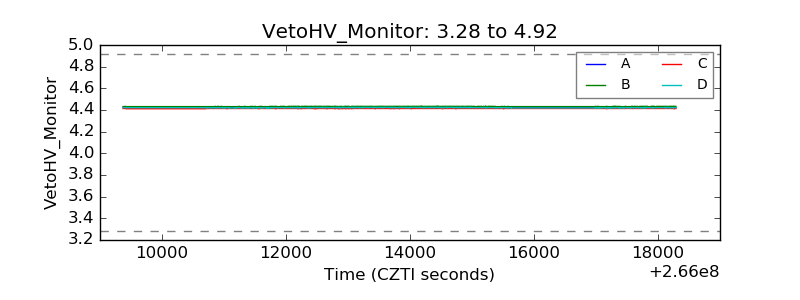 |
| Veto LLD | 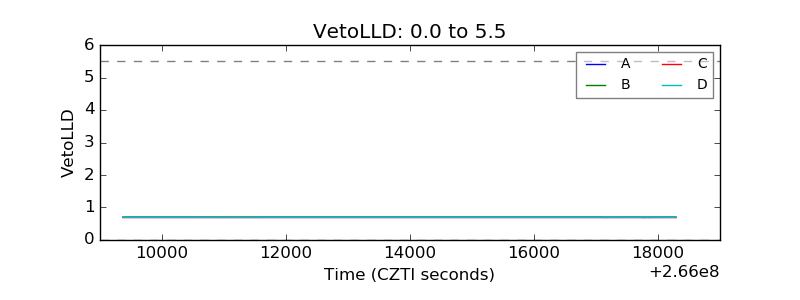 |
| Alpha Counter | 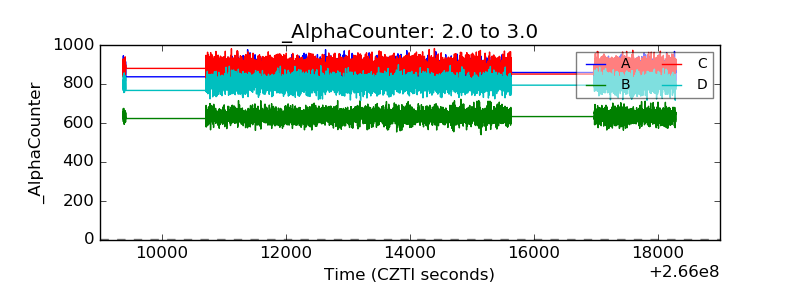 |
| _CPM_Rate | 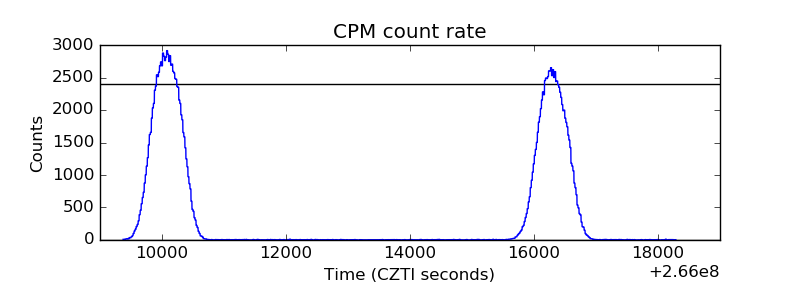 |
| CZT Counter | 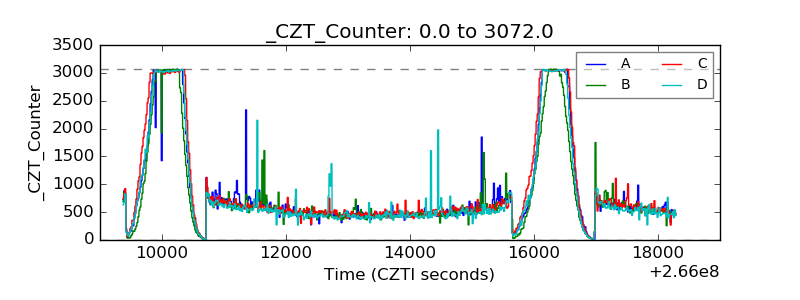 |
| +2.5 Volts monitor |  |
| +5 Volts monitor |  |
| _ROLL_ROT | 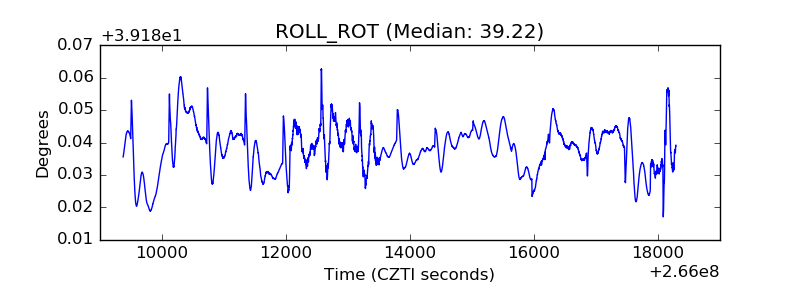 |
| _Roll_DEC | 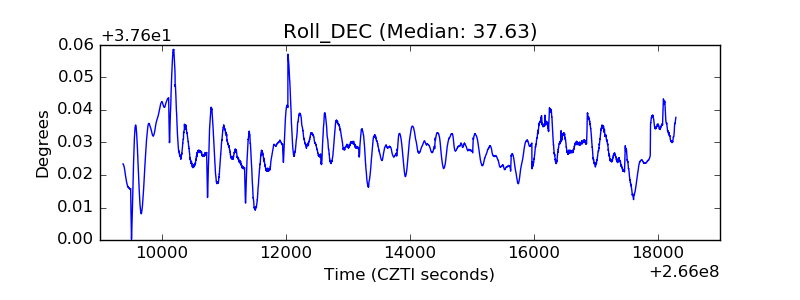 |
| _Roll_RA | 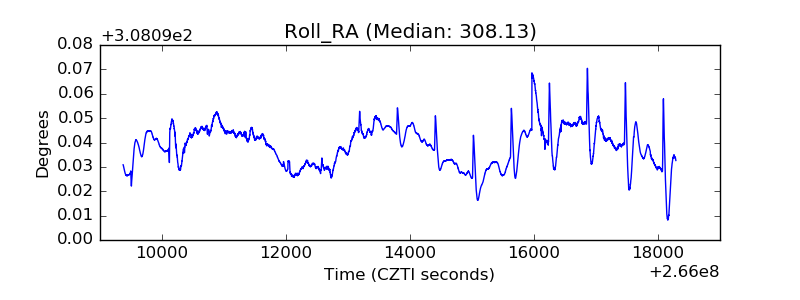 |
| Veto Counter | 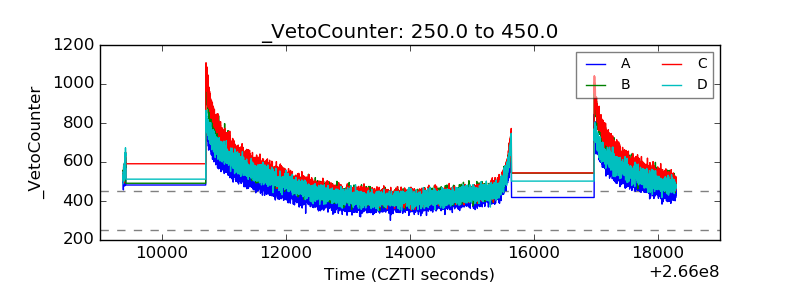 |