| Param | Original file | Final file |
|---|---|---|
| Filename | modeM0/AS1G08_081T01_9000002144_14549cztM0_level2.evt | modeM0/AS1G08_081T01_9000002144_14549cztM0_level2_quad_clean.evt |
| Size (bytes) | 512,043,840 | 94,916,160 |
| Size | 488.3 MB | 90.5 MB |
| Events in quadrant A | 3,850,567 | 605,498 |
| Events in quadrant B | 3,597,436 | 598,071 |
| Events in quadrant C | 3,847,471 | 591,278 |
| Events in quadrant D | 3,729,007 | 584,202 |
| Mode M9 | |||
|---|---|---|---|
| Quadrant | BADHDUFLAG | Total packets | Discarded packets |
| A | 0 | 21 | 0 |
| B | 0 | 21 | 0 |
| C | 0 | 21 | 0 |
| D | 0 | 21 | 0 |
| Mode SS | |||
|---|---|---|---|
| Quadrant | BADHDUFLAG | Total packets | Discarded packets |
| A | 0 | 146 | 0 |
| B | 0 | 146 | 0 |
| C | 0 | 146 | 0 |
| D | 0 | 146 | 0 |
| Mode M0 | |||
|---|---|---|---|
| Quadrant | BADHDUFLAG | Total packets | Discarded packets |
| A | 0 | 16007 | 3 |
| B | 0 | 15440 | 2 |
| C | 0 | 15944 | 2 |
| D | 0 | 16165 | 2 |
| Quadrant | Total seconds | Saturated seconds | Saturation percentage |
|---|---|---|---|
| A | 7116 | 67 | 0.941540% |
| B | 7116 | 81 | 1.138280% |
| C | 7116 | 30 | 0.421585% |
| D | 7116 | 66 | 0.927487% |
Noise dominated data is calculated using 1-second bins in cleaned event files. If a bin has >2000 counts, and if more than 50% of those come from <1% of pixels, then it is considered to be noise-dominated and hence unusable.
| Quadrant | # 1 sec bins | Bins with >0 counts | Bins with >2000 counts | High rate bins dominated by noise | Noise dominated (total time) | Noise dominated (detector-on time) | Marked lightcurve |
|---|---|---|---|---|---|---|---|
| A | 9222 | 7119 | 1 | 1 | 0.01% | 0.01% | 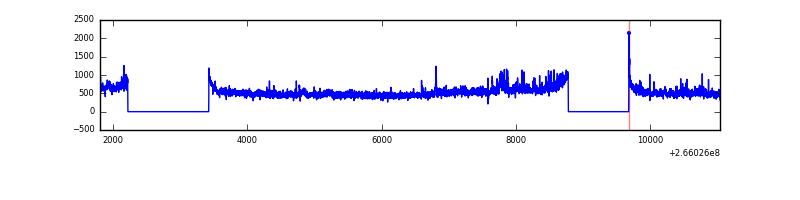 |
| B | 9222 | 7119 | 0 | 0 | 0.00% | 0.00% | 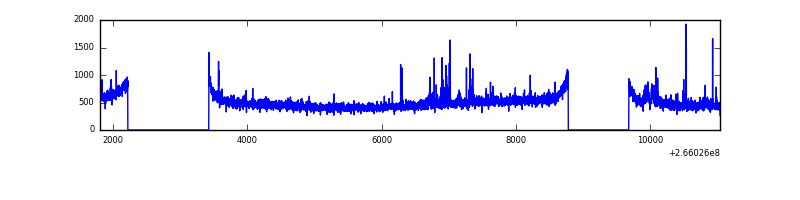 |
| C | 9222 | 7119 | 1 | 1 | 0.01% | 0.01% | 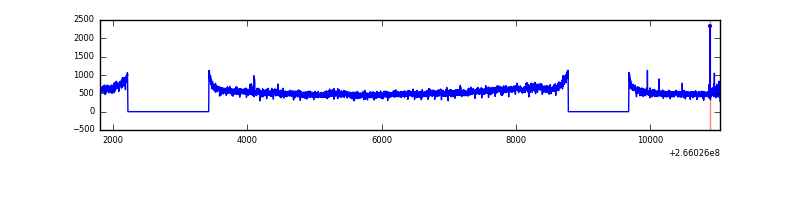 |
| D | 9222 | 7119 | 16 | 16 | 0.17% | 0.22% | 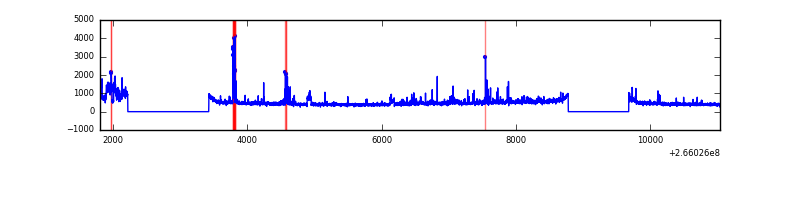 |
Top three noisy pixels from each quadrant. If the there are fewer than three noisy pixels in the level2.evt file, extra rows are filled as -1
| Pixel properties | Quadrant properties | ||||||
|---|---|---|---|---|---|---|---|
| Quadrant | DetID | PixID | Counts | Sigma | Mean | Median | Sigma |
| A | 8 | 15 | 401649 | 2254.26 | 878 | 860 | 177.8 |
| A | 12 | 189 | 33055 | 181.08 | 878 | 860 | 177.8 |
| A | 0 | 23 | 23011 | 124.59 | 878 | 860 | 177.8 |
| B | 0 | 219 | 43372 | 254.14 | 877 | 854 | 167.3 |
| B | 3 | 209 | 24051 | 138.66 | 877 | 854 | 167.3 |
| B | 5 | 29 | 23389 | 134.7 | 877 | 854 | 167.3 |
| C | 3 | 233 | 520311 | 2641.26 | 851 | 854 | 196.7 |
| C | 6 | 96 | 10426 | 48.67 | 851 | 854 | 196.7 |
| C | 13 | 61 | 6309 | 27.74 | 851 | 854 | 196.7 |
| D | 12 | 110 | 231450 | 1122.27 | 852 | 828 | 205.5 |
| D | 10 | 199 | 153737 | 744.1 | 852 | 828 | 205.5 |
| D | 2 | 152 | 79508 | 382.88 | 852 | 828 | 205.5 |
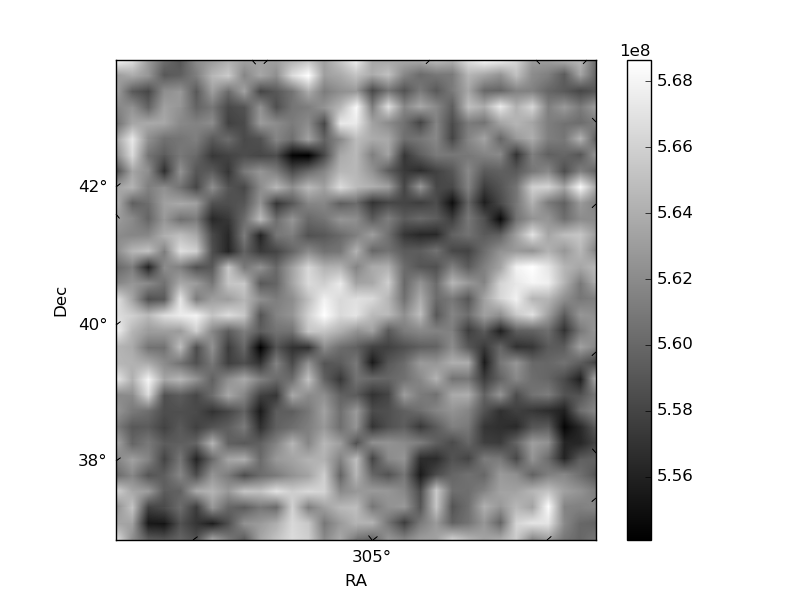
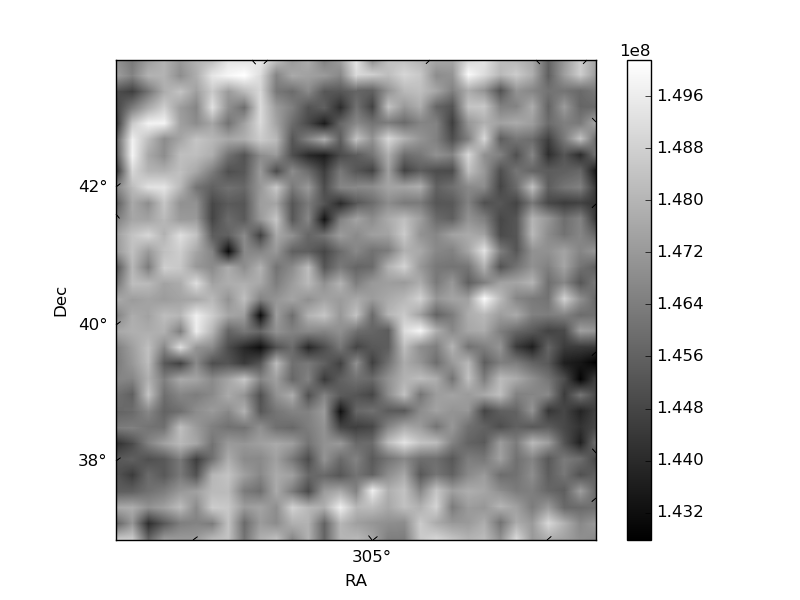
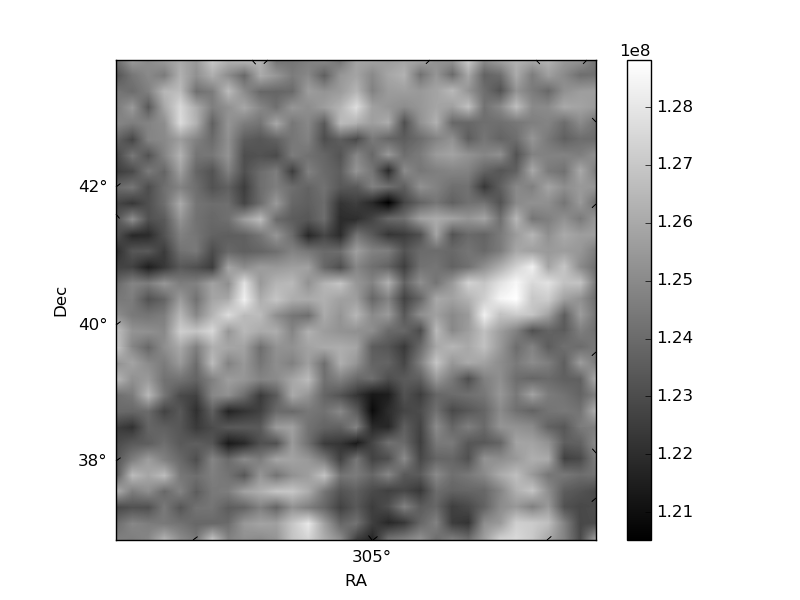
Histogram calculated using DETX and DETY for each event in the final _common_clean file
| Quadrant A | 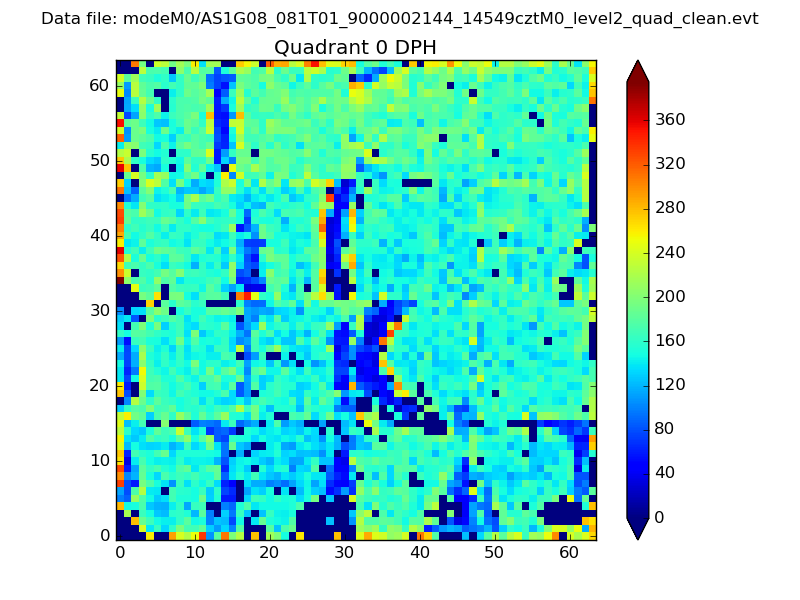 |
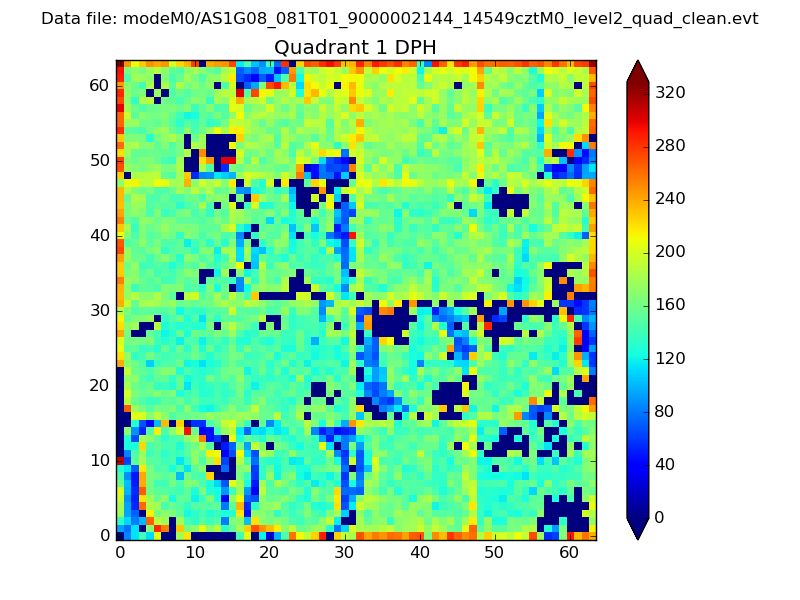 |
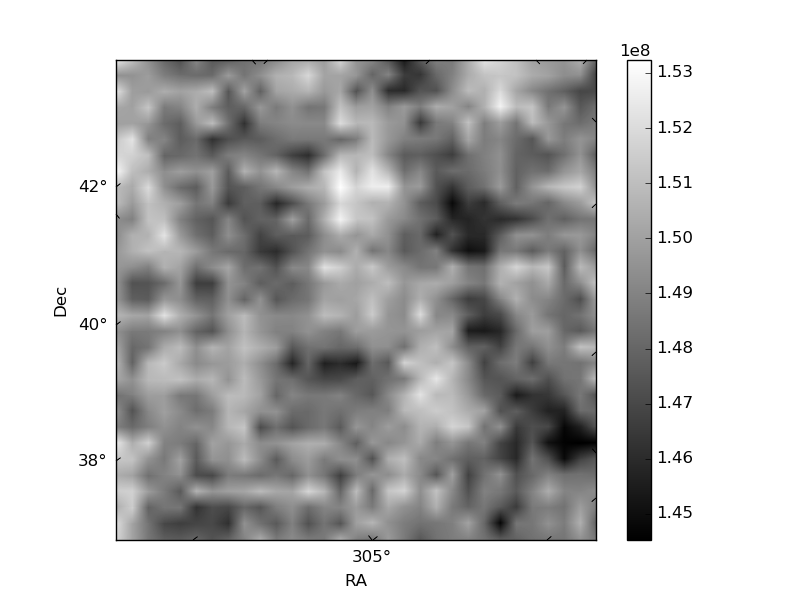
Quadrant B |
|---|---|---|---|
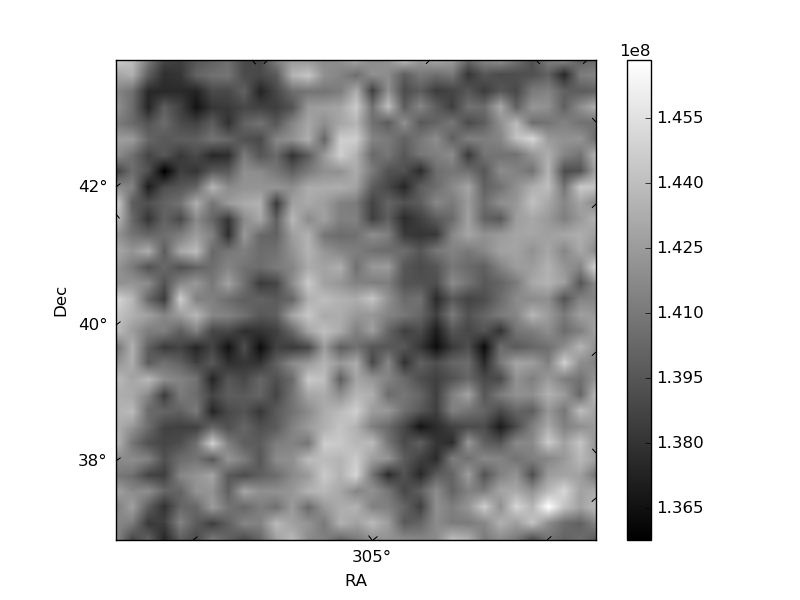
| Quadrant D | 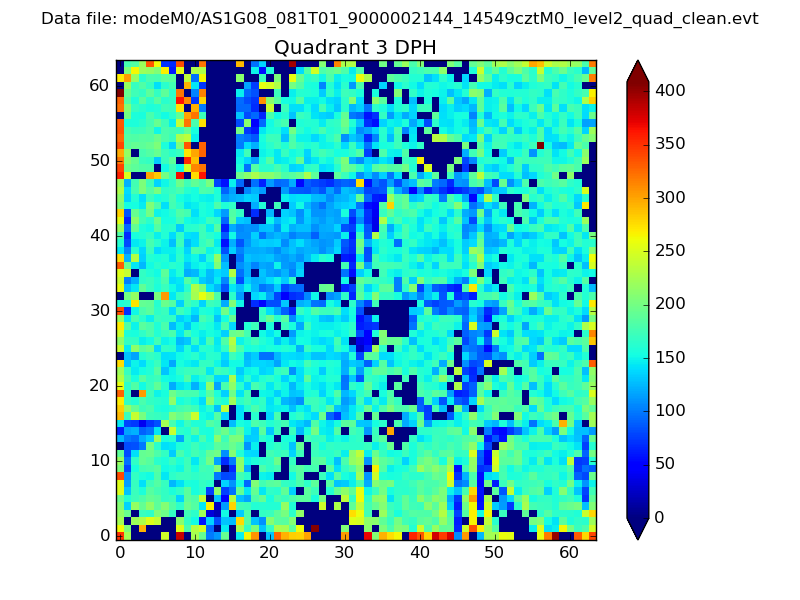 |
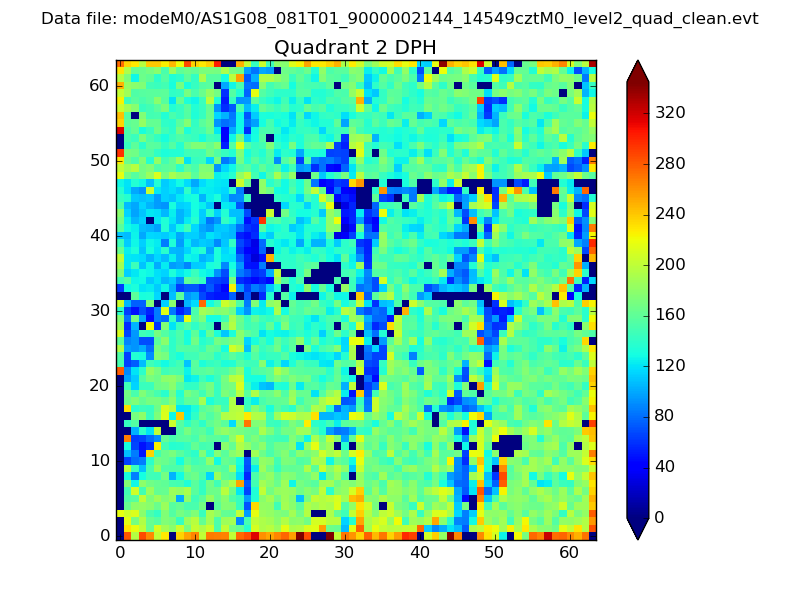 |
Quadrant C |
| Plot type | Count rate plots | Images |
|---|---|---|
| Comparison with Poisson distribution Blue bars denote a histogram of data divided into 1 sec bins. Red curve is a Poisson curve with rate = median count rate of data. |
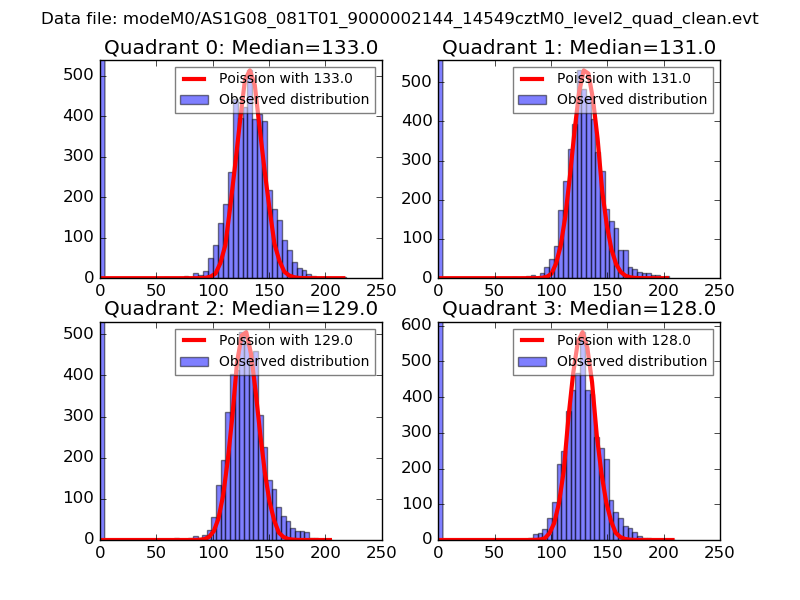 |
 |
| Quadrant-wise count rates Data is divided into 100 sec bins |
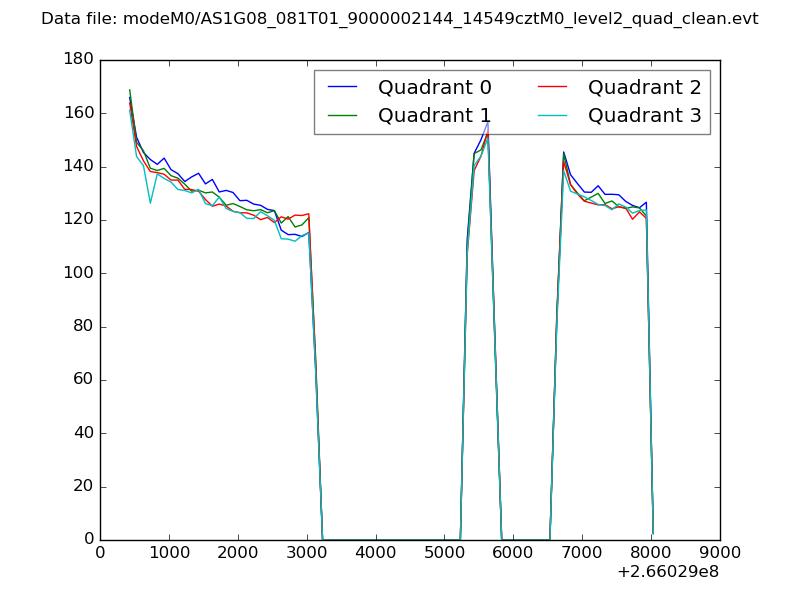 |
|
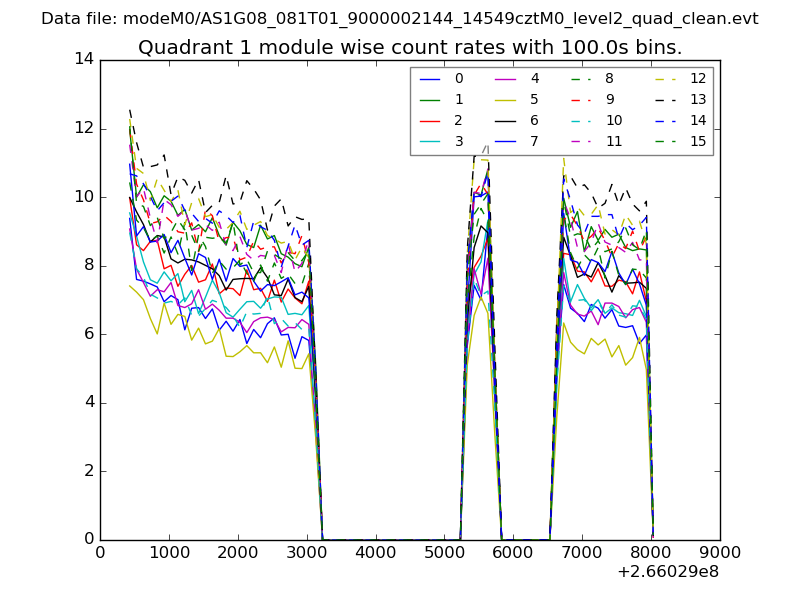
| Module-wise count rates for Quadrant A Data is divided into 100 sec bins |
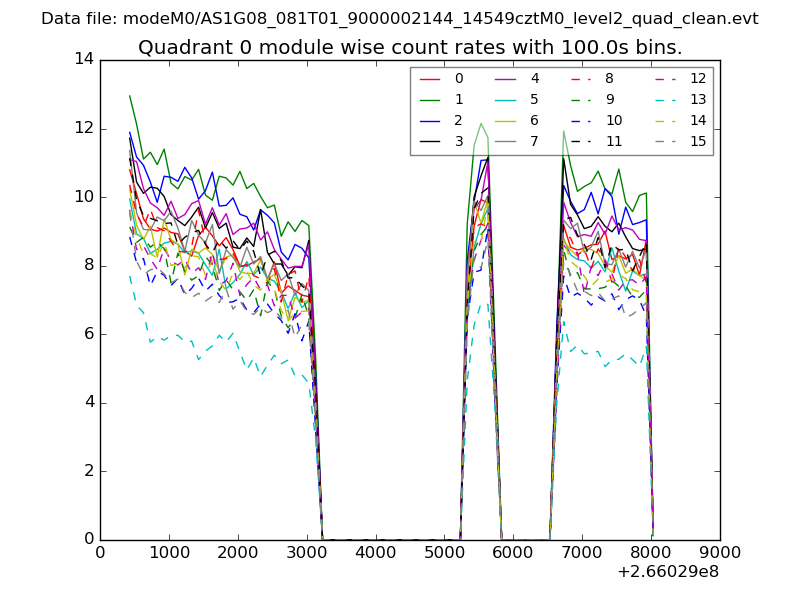 |
 |
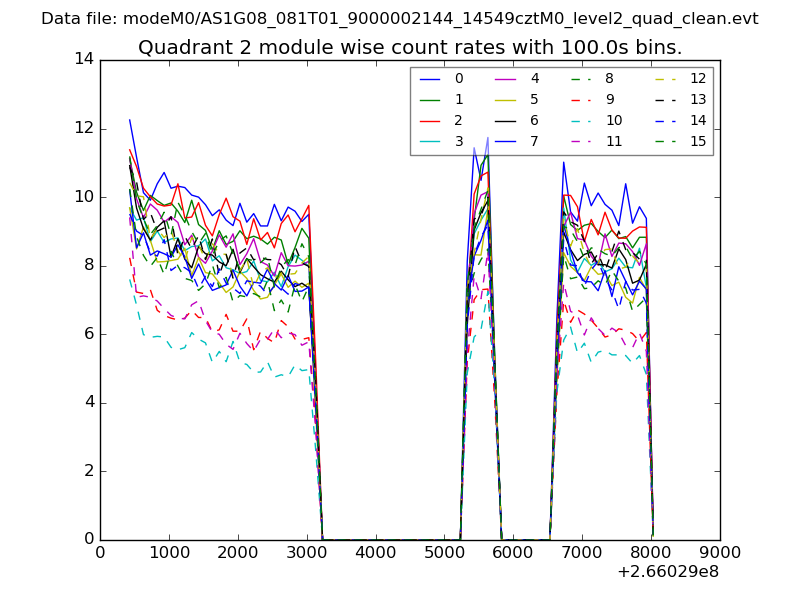
| Module-wise count rates for Quadrant B Data is divided into 100 sec bins |
 |
 |
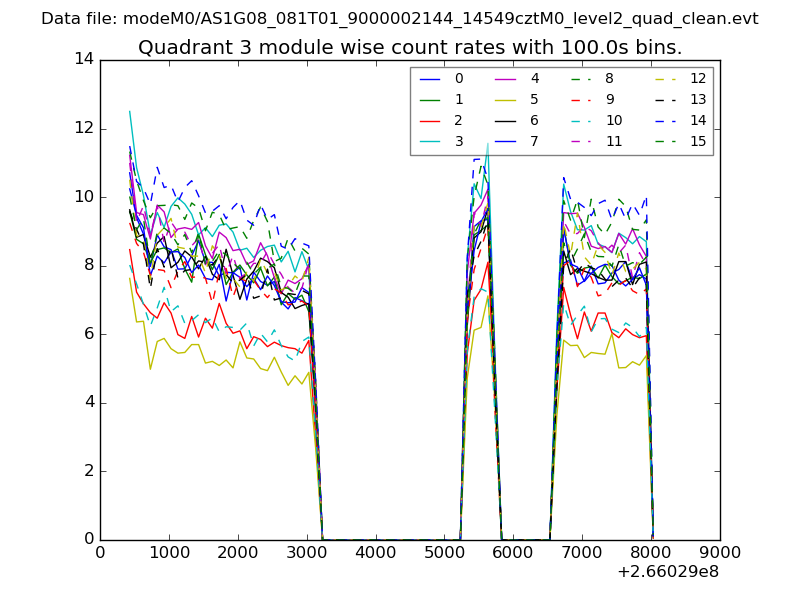
| Module-wise count rates for Quadrant C Data is divided into 100 sec bins |
 |
 |
| Module-wise count rates for Quadrant D Data is divided into 100 sec bins |
 |
 |
| Parameter | Plot |
|---|---|
| CZT HV Monitor | 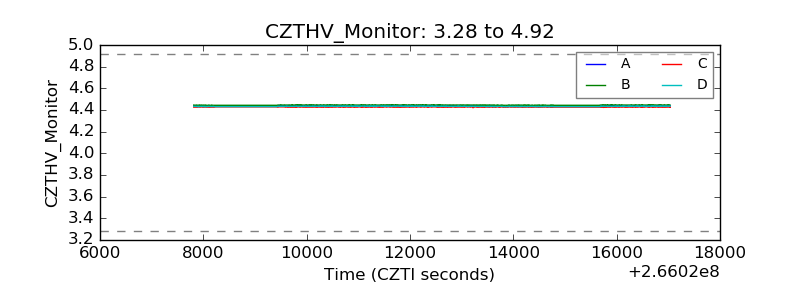 |
| D_VDD | 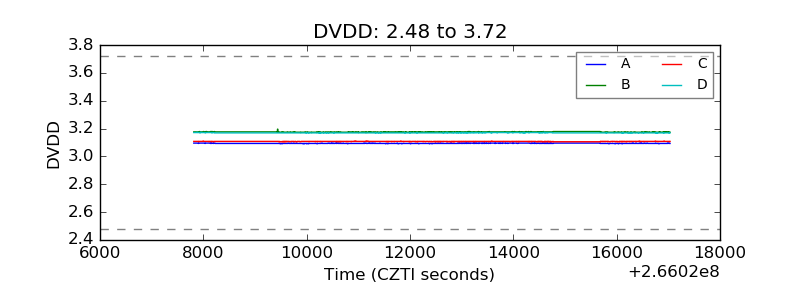 |
| Temperature 1 | 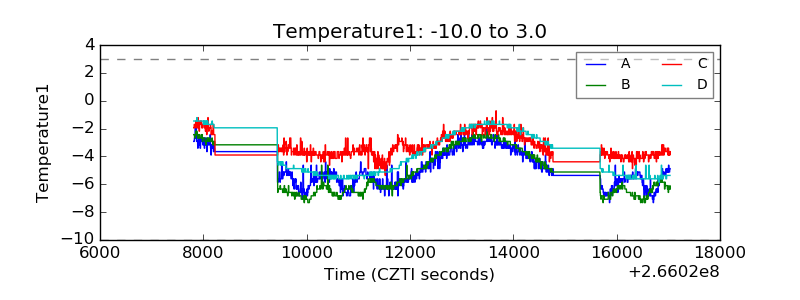 |
| Veto HV Monitor | 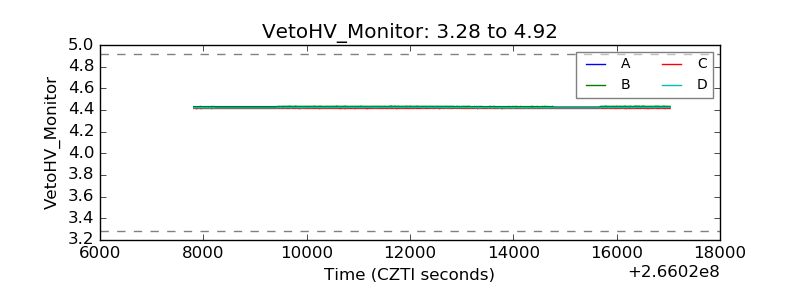 |
| Veto LLD | 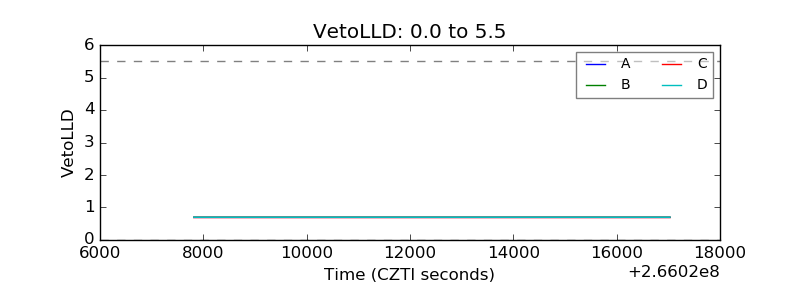 |
| Alpha Counter | 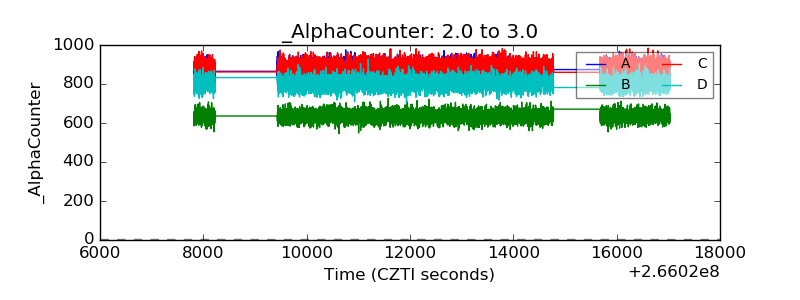 |
| _CPM_Rate | 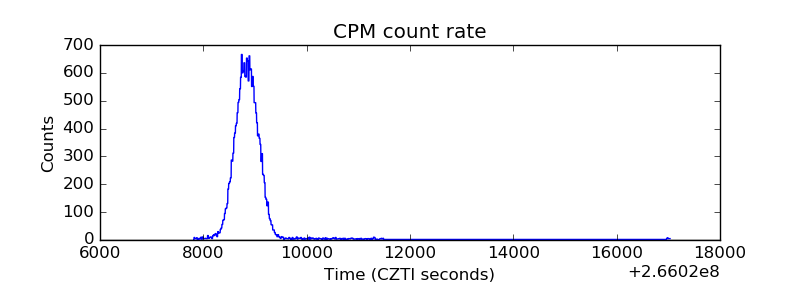 |
| CZT Counter | 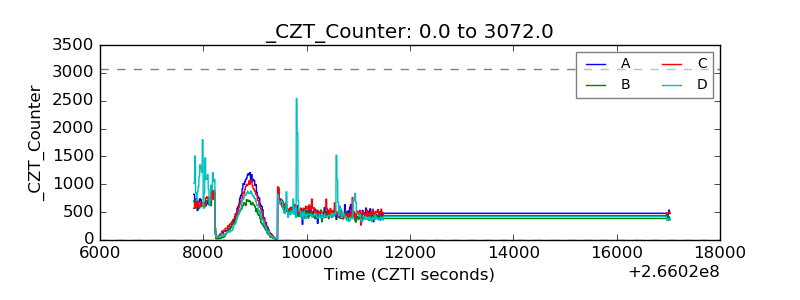 |
| +2.5 Volts monitor |  |
| +5 Volts monitor |  |
| _ROLL_ROT | 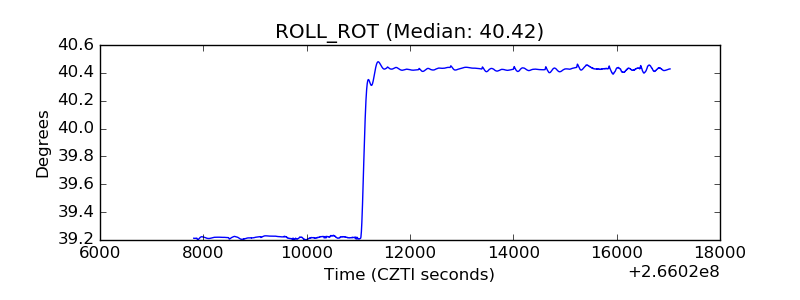 |
| _Roll_DEC | 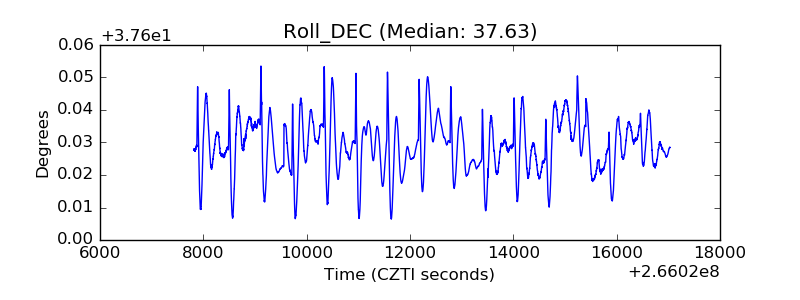 |
| _Roll_RA | 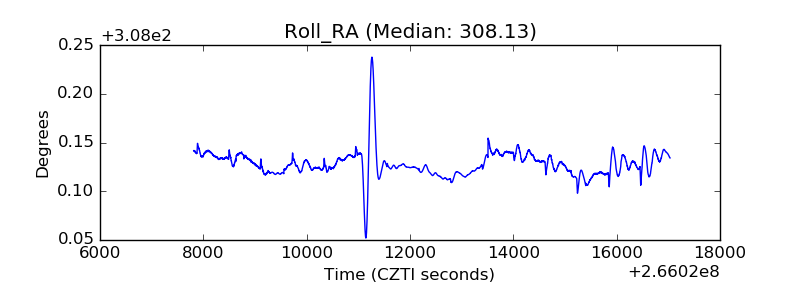 |
| Veto Counter | 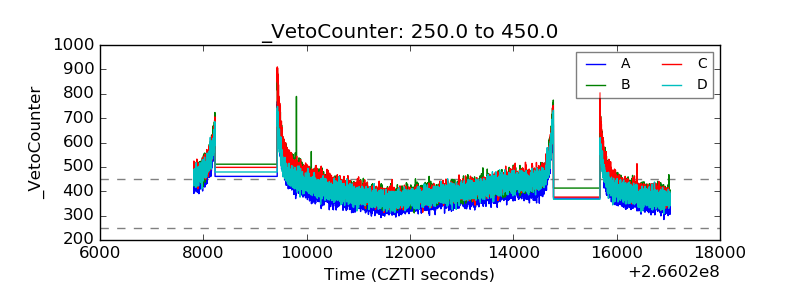 |