| Param | Original file | Final file |
|---|---|---|
| Filename | modeM0/AS1G08_081T01_9000002144_14550cztM0_level2.evt | modeM0/AS1G08_081T01_9000002144_14550cztM0_level2_quad_clean.evt |
| Size (bytes) | 580,688,640 | 111,772,800 |
| Size | 553.8 MB | 106.6 MB |
| Events in quadrant A | 4,455,578 | 722,165 |
| Events in quadrant B | 4,000,641 | 711,059 |
| Events in quadrant C | 4,426,409 | 701,325 |
| Events in quadrant D | 4,162,632 | 695,924 |
| Mode M9 | |||
|---|---|---|---|
| Quadrant | BADHDUFLAG | Total packets | Discarded packets |
| A | 0 | 13 | 0 |
| B | 0 | 13 | 0 |
| C | 0 | 13 | 0 |
| D | 0 | 13 | 0 |
| Mode SS | |||
|---|---|---|---|
| Quadrant | BADHDUFLAG | Total packets | Discarded packets |
| A | 0 | 164 | 0 |
| B | 0 | 164 | 0 |
| C | 0 | 164 | 0 |
| D | 0 | 164 | 0 |
| Mode M0 | |||
|---|---|---|---|
| Quadrant | BADHDUFLAG | Total packets | Discarded packets |
| A | 0 | 18605 | 3 |
| B | 0 | 17109 | 2 |
| C | 0 | 18170 | 2 |
| D | 0 | 17878 | 2 |
| Quadrant | Total seconds | Saturated seconds | Saturation percentage |
|---|---|---|---|
| A | 7978 | 119 | 1.491602% |
| B | 7978 | 114 | 1.428930% |
| C | 7978 | 72 | 0.902482% |
| D | 7978 | 95 | 1.190775% |
Noise dominated data is calculated using 1-second bins in cleaned event files. If a bin has >2000 counts, and if more than 50% of those come from <1% of pixels, then it is considered to be noise-dominated and hence unusable.
| Quadrant | # 1 sec bins | Bins with >0 counts | Bins with >2000 counts | High rate bins dominated by noise | Noise dominated (total time) | Noise dominated (detector-on time) | Marked lightcurve |
|---|---|---|---|---|---|---|---|
| A | 9329 | 7981 | 2 | 2 | 0.02% | 0.03% | 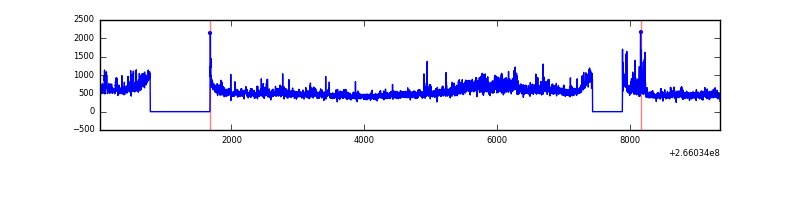 |
| B | 9329 | 7981 | 1 | 1 | 0.01% | 0.01% | 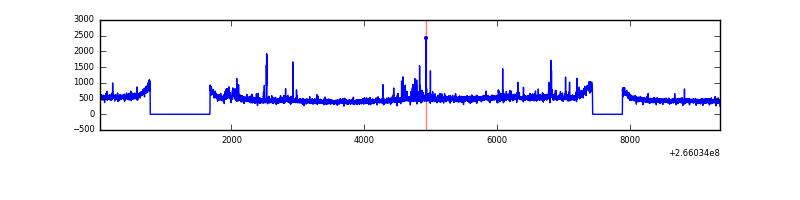 |
| C | 9329 | 7981 | 12 | 12 | 0.13% | 0.15% | 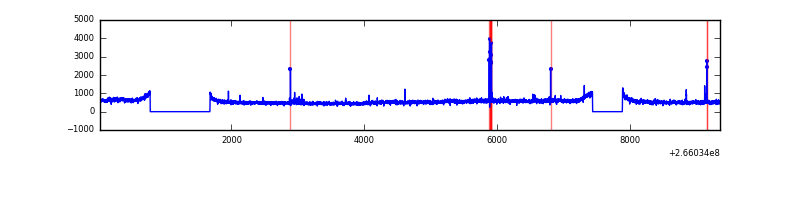 |
| D | 9329 | 7981 | 50 | 50 | 0.54% | 0.63% | 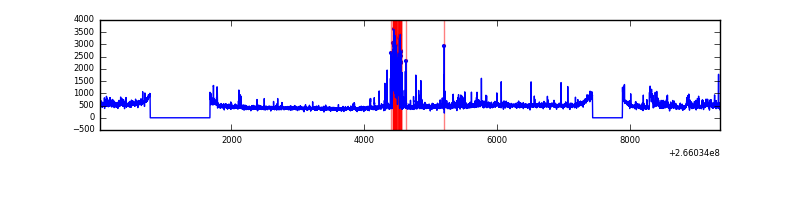 |
Top three noisy pixels from each quadrant. If the there are fewer than three noisy pixels in the level2.evt file, extra rows are filled as -1
| Pixel properties | Quadrant properties | ||||||
|---|---|---|---|---|---|---|---|
| Quadrant | DetID | PixID | Counts | Sigma | Mean | Median | Sigma |
| A | 8 | 15 | 467385 | 2343.74 | 979 | 957 | 199.0 |
| A | 0 | 23 | 164908 | 823.83 | 979 | 957 | 199.0 |
| A | 12 | 189 | 31544 | 153.69 | 979 | 957 | 199.0 |
| B | 0 | 219 | 42040 | 217.71 | 977 | 951 | 188.7 |
| B | 0 | 189 | 38268 | 197.72 | 977 | 951 | 188.7 |
| B | 12 | 111 | 22433 | 113.82 | 977 | 951 | 188.7 |
| C | 3 | 233 | 651073 | 2945.05 | 947 | 952 | 220.8 |
| C | 6 | 96 | 70583 | 315.43 | 947 | 952 | 220.8 |
| C | 14 | 225 | 11203 | 46.44 | 947 | 952 | 220.8 |
| D | 10 | 199 | 247536 | 1067.86 | 950 | 918 | 230.9 |
| D | 12 | 110 | 192607 | 830.02 | 950 | 918 | 230.9 |
| D | 2 | 152 | 89171 | 382.14 | 950 | 918 | 230.9 |
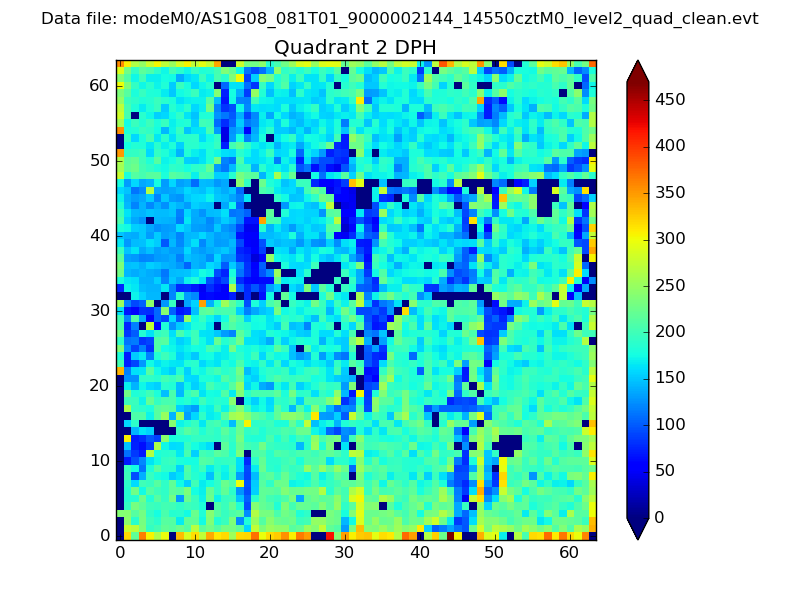
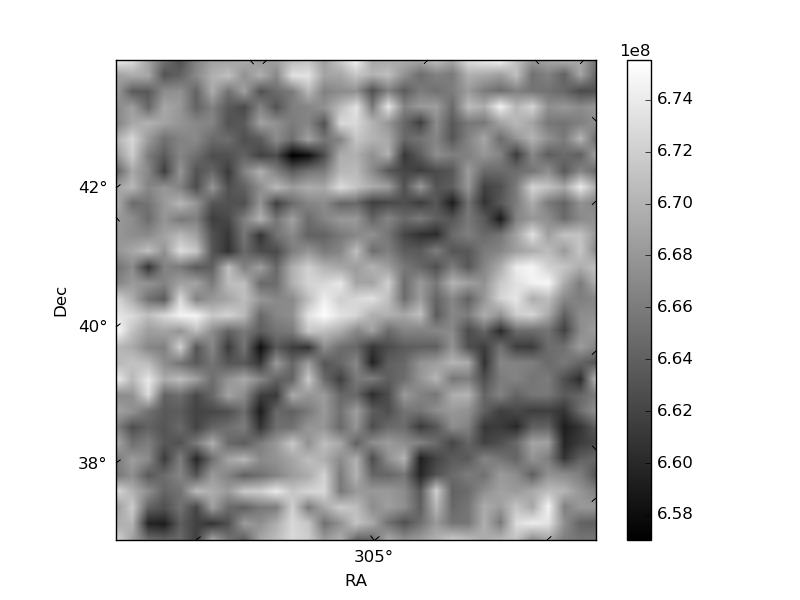
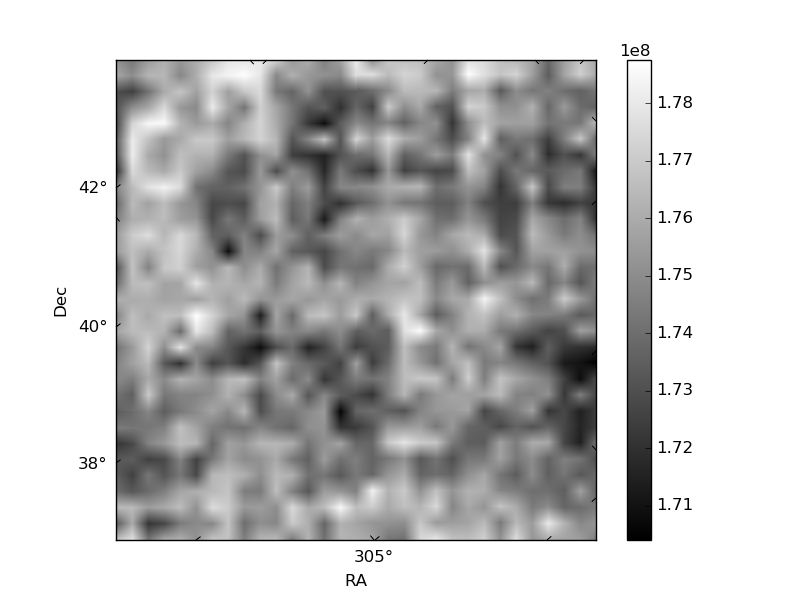
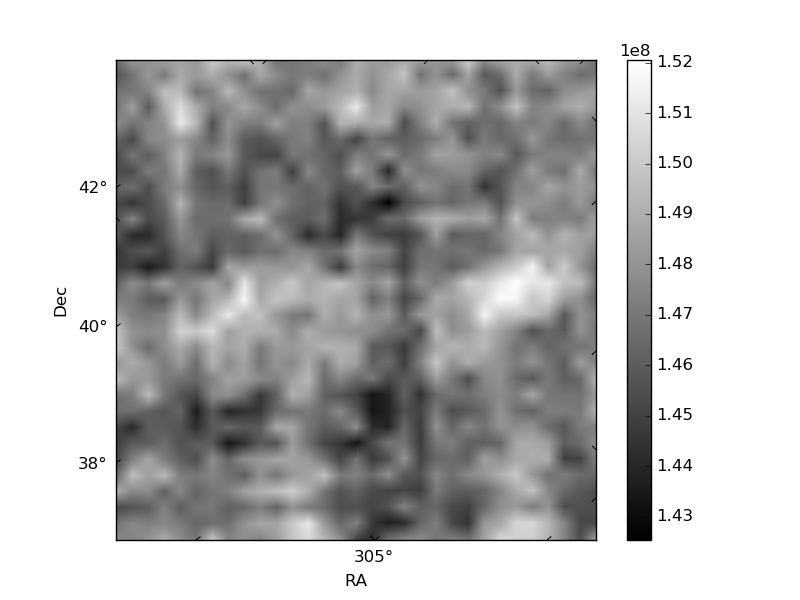
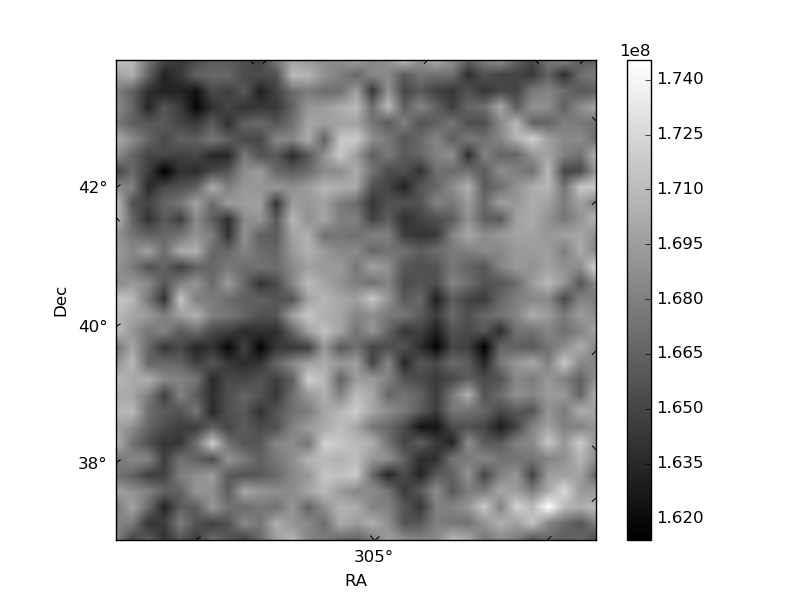
Histogram calculated using DETX and DETY for each event in the final _common_clean file
| Quadrant A | 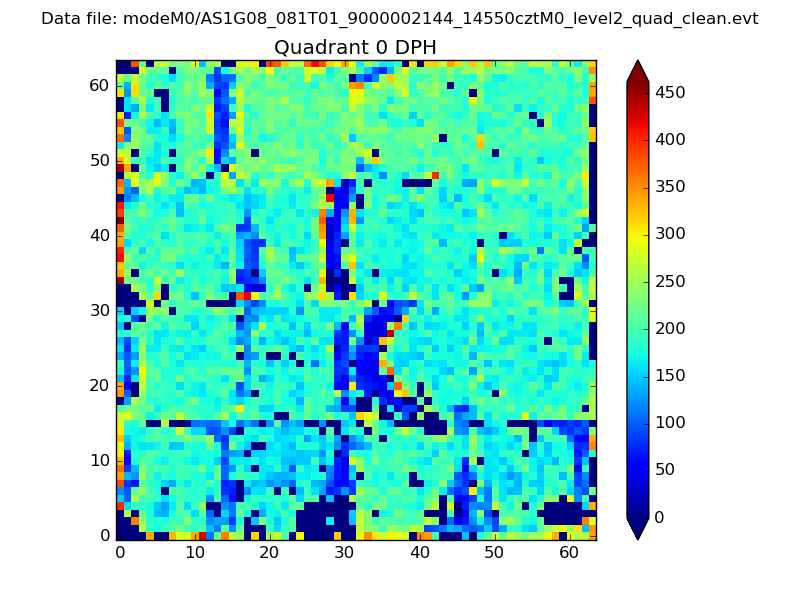 |
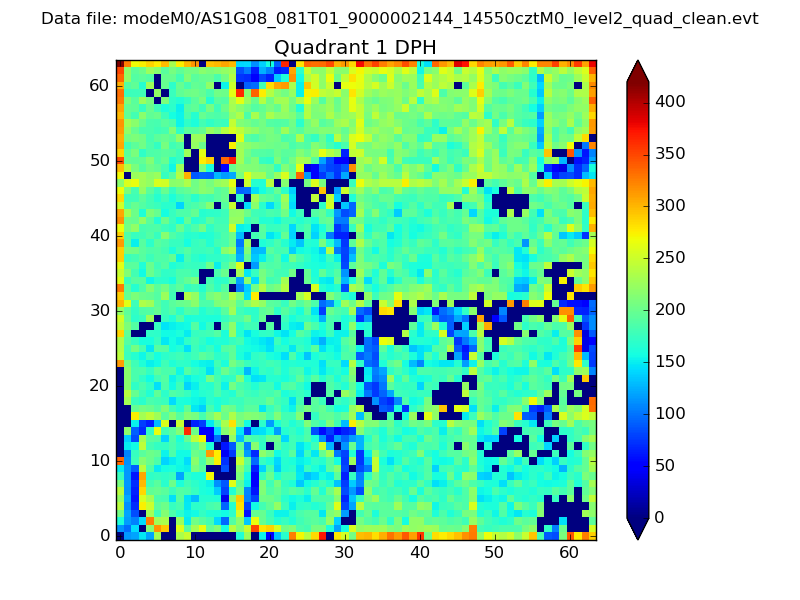 |
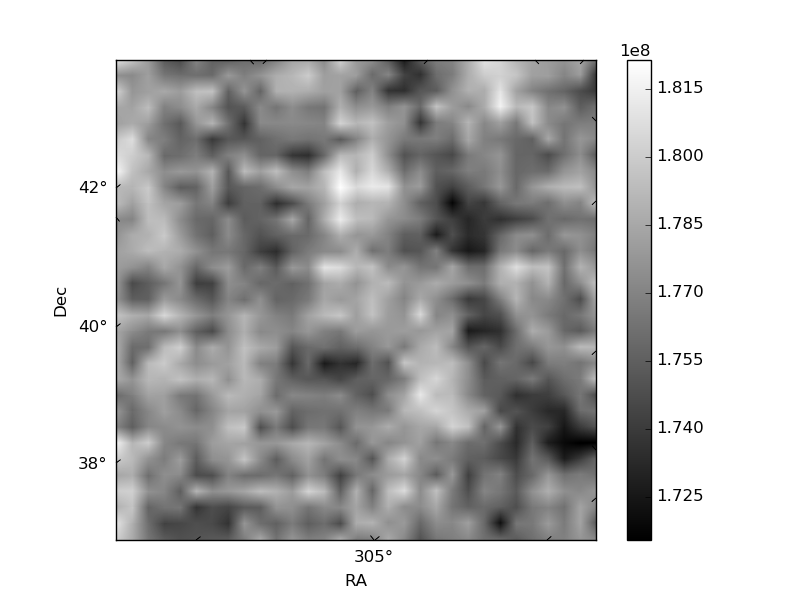
Quadrant B |
|---|---|---|---|
| Quadrant D | 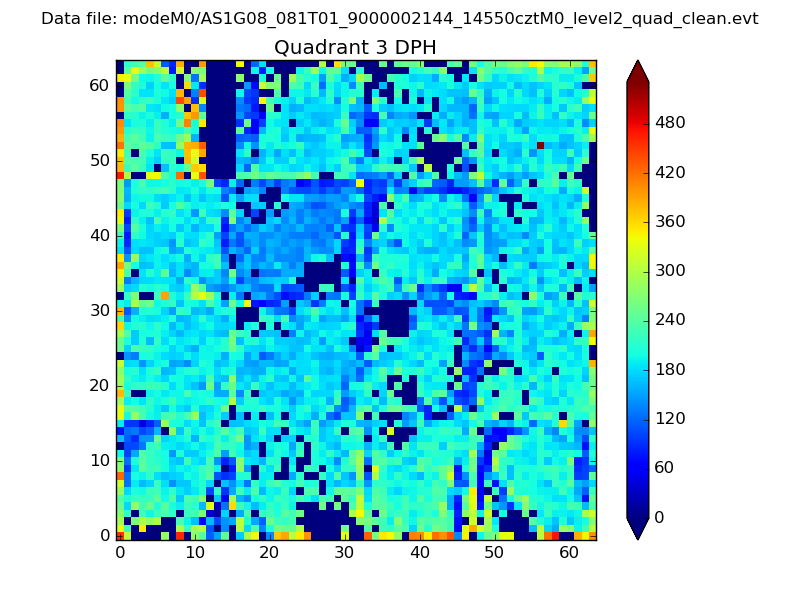 |
 |
Quadrant C |
| Plot type | Count rate plots | Images |
|---|---|---|
| Comparison with Poisson distribution Blue bars denote a histogram of data divided into 1 sec bins. Red curve is a Poisson curve with rate = median count rate of data. |
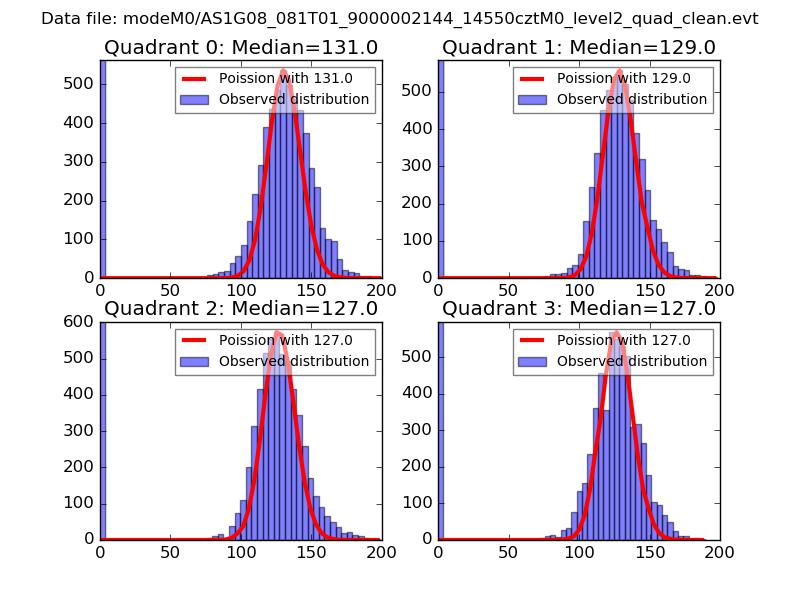 |
 |
| Quadrant-wise count rates Data is divided into 100 sec bins |
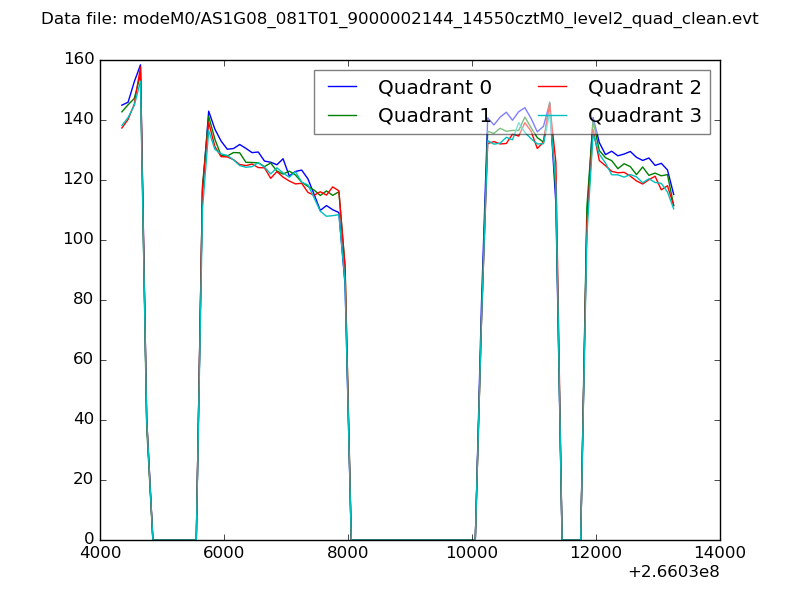 |
|
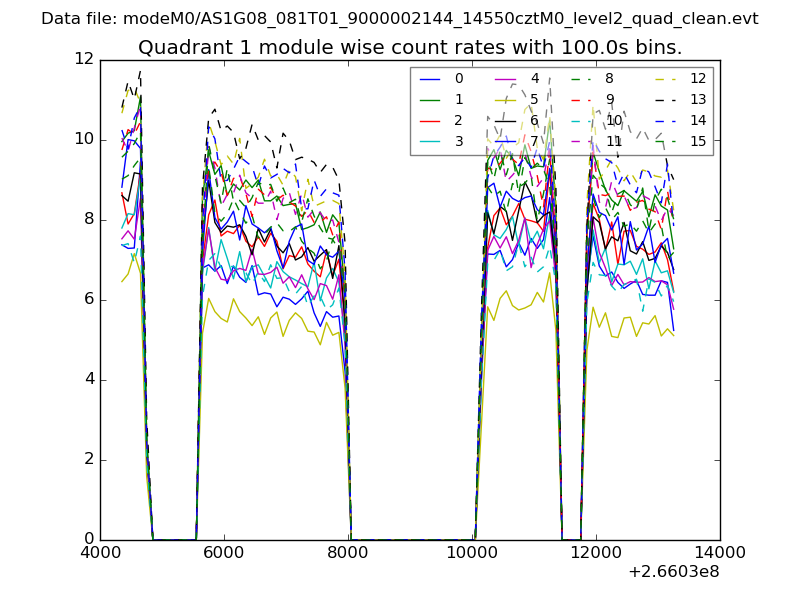
| Module-wise count rates for Quadrant A Data is divided into 100 sec bins |
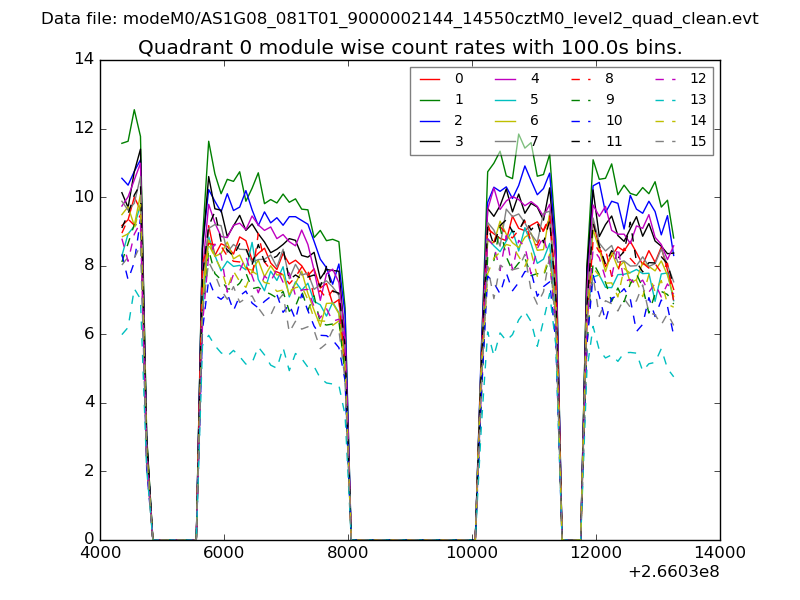 |
 |
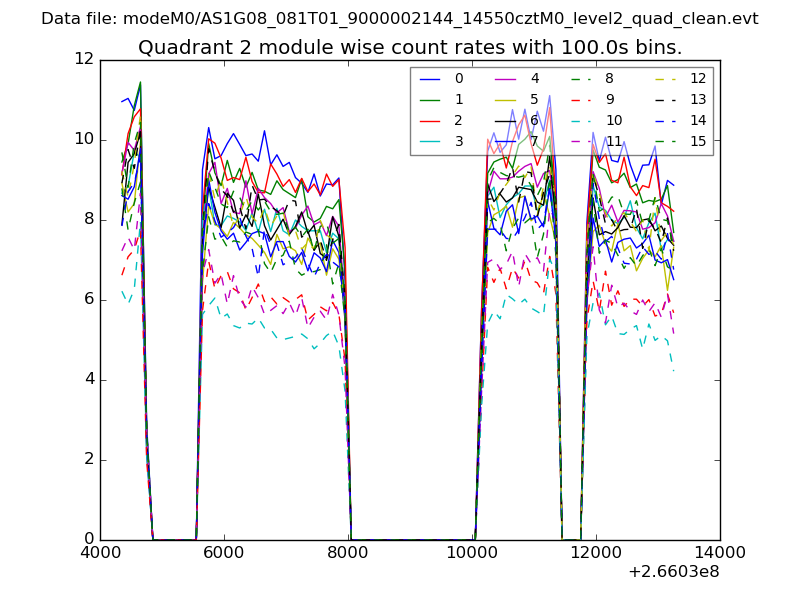
| Module-wise count rates for Quadrant B Data is divided into 100 sec bins |
 |
 |
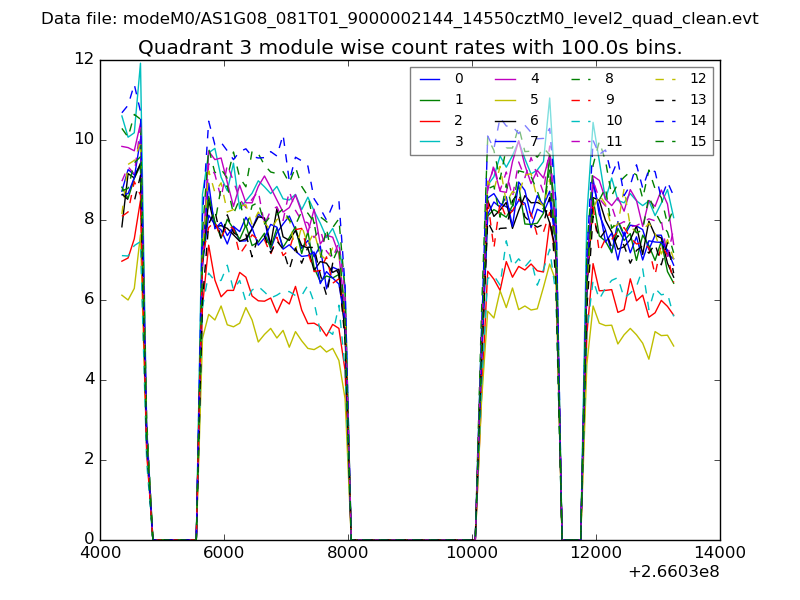
| Module-wise count rates for Quadrant C Data is divided into 100 sec bins |
 |
 |
| Module-wise count rates for Quadrant D Data is divided into 100 sec bins |
 |
 |
| Parameter | Plot |
|---|---|
| CZT HV Monitor | 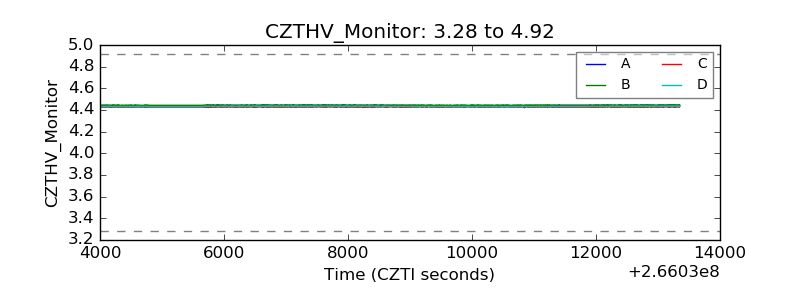 |
| D_VDD | 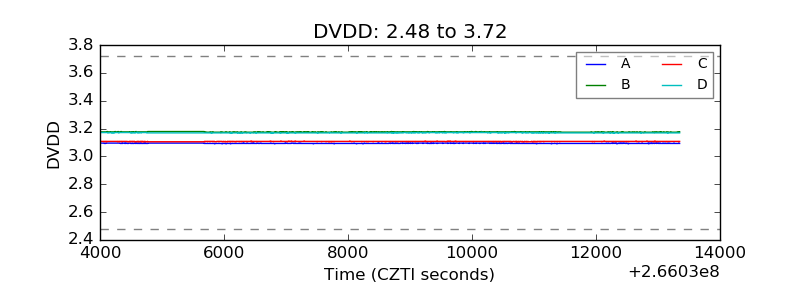 |
| Temperature 1 | 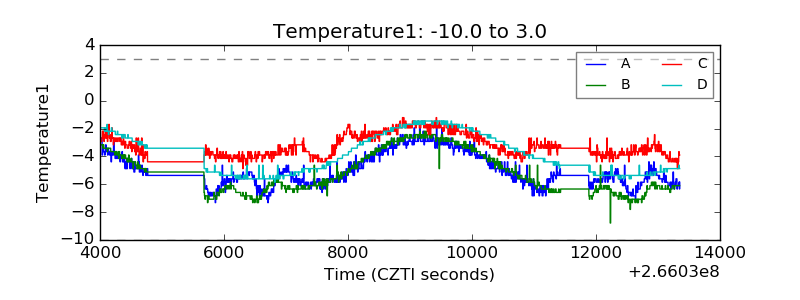 |
| Veto HV Monitor | 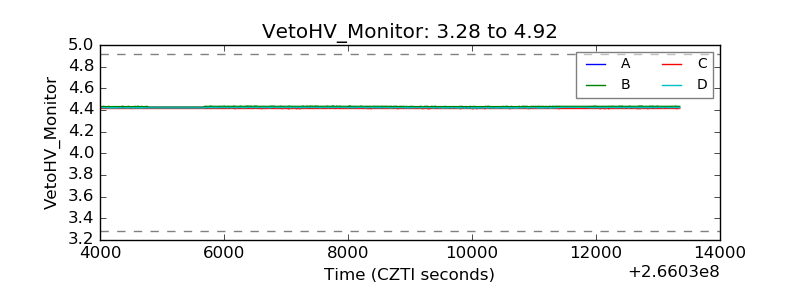 |
| Veto LLD | 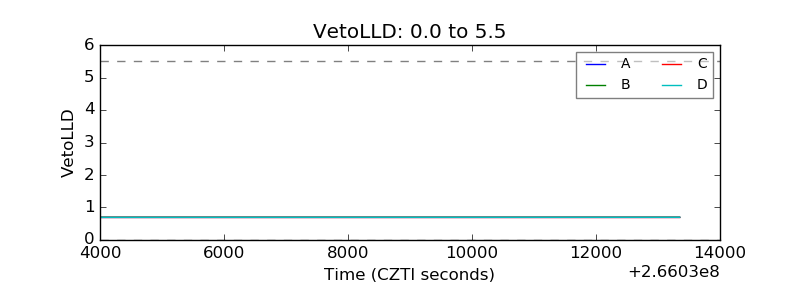 |
| Alpha Counter | 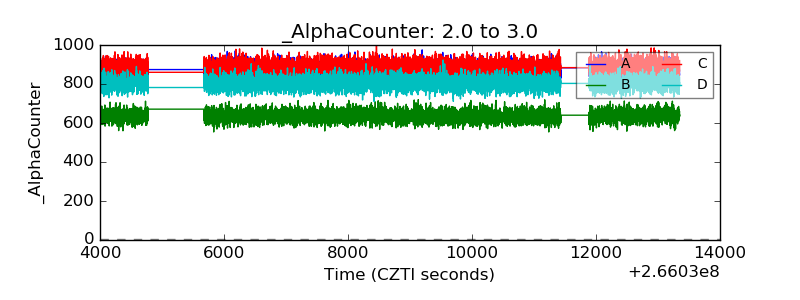 |
| _CPM_Rate | 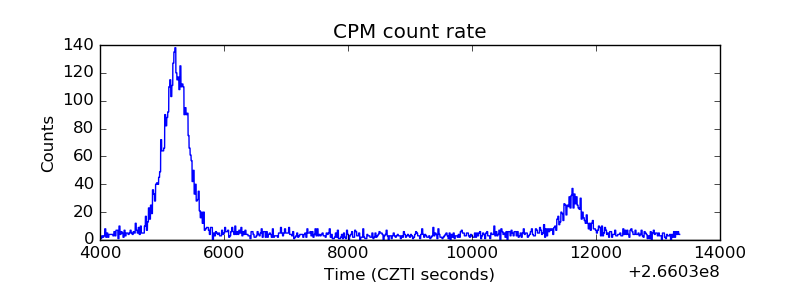 |
| CZT Counter | 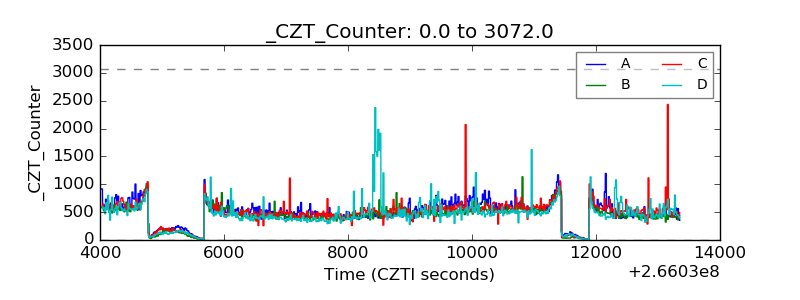 |
| +2.5 Volts monitor |  |
| +5 Volts monitor |  |
| _ROLL_ROT | 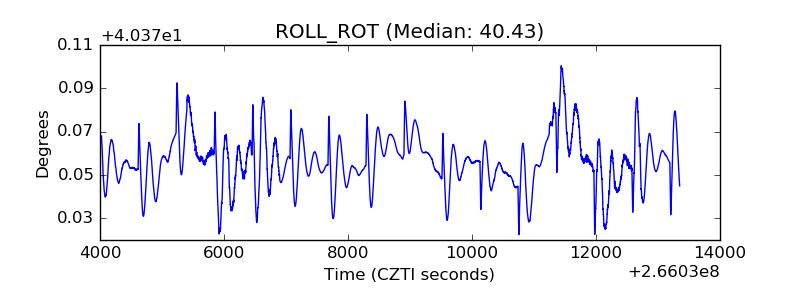 |
| _Roll_DEC |  |
| _Roll_RA | 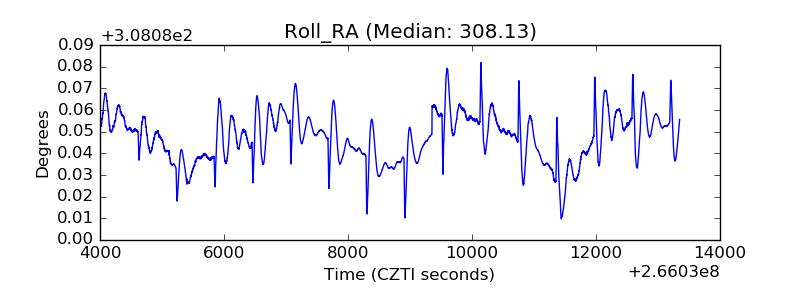 |
| Veto Counter | 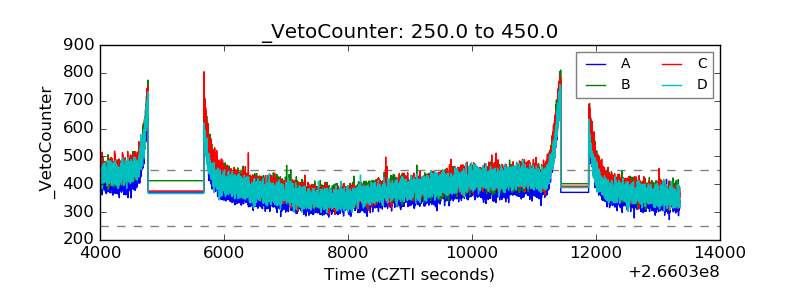 |