| Param | Original file | Final file |
|---|---|---|
| Filename | modeM0/AS1G08_081T01_9000002144_14551cztM0_level2.evt | modeM0/AS1G08_081T01_9000002144_14551cztM0_level2_quad_clean.evt |
| Size (bytes) | 507,021,120 | 99,365,760 |
| Size | 483.5 MB | 94.8 MB |
| Events in quadrant A | 3,646,402 | 639,921 |
| Events in quadrant B | 3,466,522 | 631,223 |
| Events in quadrant C | 3,757,184 | 623,321 |
| Events in quadrant D | 3,997,051 | 614,232 |
| Mode M9 | |||
|---|---|---|---|
| Quadrant | BADHDUFLAG | Total packets | Discarded packets |
| A | 0 | 1 | 0 |
| B | 0 | 1 | 0 |
| C | 0 | 1 | 0 |
| D | 0 | 1 | 0 |
| Mode SS | |||
|---|---|---|---|
| Quadrant | BADHDUFLAG | Total packets | Discarded packets |
| A | 0 | 146 | 0 |
| B | 0 | 146 | 0 |
| C | 0 | 146 | 0 |
| D | 0 | 146 | 0 |
| Mode M0 | |||
|---|---|---|---|
| Quadrant | BADHDUFLAG | Total packets | Discarded packets |
| A | 0 | 15341 | 2 |
| B | 0 | 15052 | 1 |
| C | 0 | 15244 | 1 |
| D | 0 | 16698 | 1 |
| Quadrant | Total seconds | Saturated seconds | Saturation percentage |
|---|---|---|---|
| A | 7182 | 193 | 2.687274% |
| B | 7182 | 200 | 2.784740% |
| C | 7182 | 131 | 1.824004% |
| D | 7182 | 278 | 3.870788% |
Noise dominated data is calculated using 1-second bins in cleaned event files. If a bin has >2000 counts, and if more than 50% of those come from <1% of pixels, then it is considered to be noise-dominated and hence unusable.
| Quadrant | # 1 sec bins | Bins with >0 counts | Bins with >2000 counts | High rate bins dominated by noise | Noise dominated (total time) | Noise dominated (detector-on time) | Marked lightcurve |
|---|---|---|---|---|---|---|---|
| A | 7293 | 7184 | 1 | 1 | 0.01% | 0.01% | 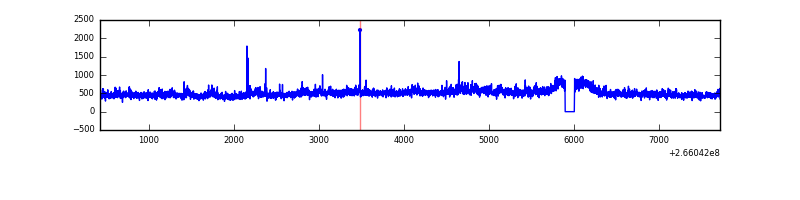 |
| B | 7293 | 7184 | 5 | 5 | 0.07% | 0.07% | 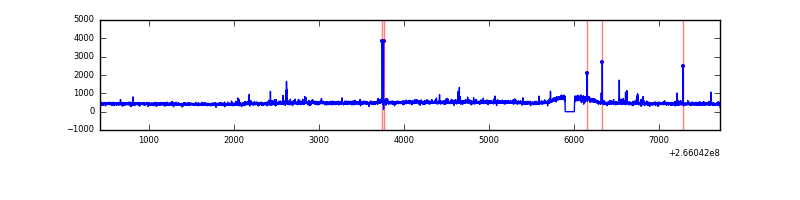 |
| C | 7293 | 7184 | 2 | 2 | 0.03% | 0.03% | 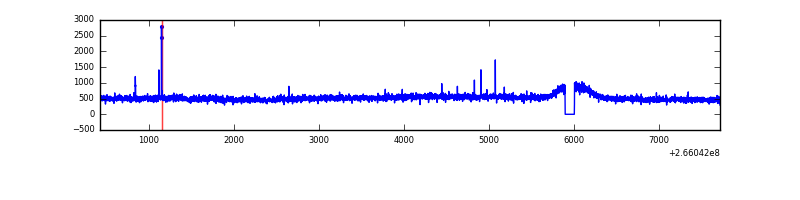 |
| D | 7293 | 7184 | 138 | 138 | 1.89% | 1.92% | 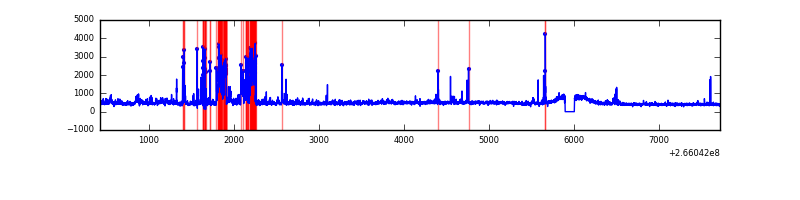 |
Top three noisy pixels from each quadrant. If the there are fewer than three noisy pixels in the level2.evt file, extra rows are filled as -1
| Pixel properties | Quadrant properties | ||||||
|---|---|---|---|---|---|---|---|
| Quadrant | DetID | PixID | Counts | Sigma | Mean | Median | Sigma |
| A | 8 | 15 | 238122 | 1377.4 | 855 | 834 | 172.3 |
| A | 12 | 189 | 54762 | 313.04 | 855 | 834 | 172.3 |
| A | 0 | 23 | 39808 | 226.24 | 855 | 834 | 172.3 |
| B | 0 | 229 | 37318 | 222.83 | 850 | 829 | 163.7 |
| B | 0 | 189 | 34581 | 206.12 | 850 | 829 | 163.7 |
| B | 12 | 111 | 19595 | 114.6 | 850 | 829 | 163.7 |
| C | 3 | 233 | 509158 | 2663.39 | 826 | 830 | 190.9 |
| C | 14 | 225 | 11236 | 54.52 | 826 | 830 | 190.9 |
| C | 13 | 61 | 6023 | 27.21 | 826 | 830 | 190.9 |
| D | 10 | 199 | 535185 | 2649.91 | 827 | 801 | 201.7 |
| D | 12 | 110 | 181327 | 895.19 | 827 | 801 | 201.7 |
| D | 2 | 152 | 82142 | 403.35 | 827 | 801 | 201.7 |
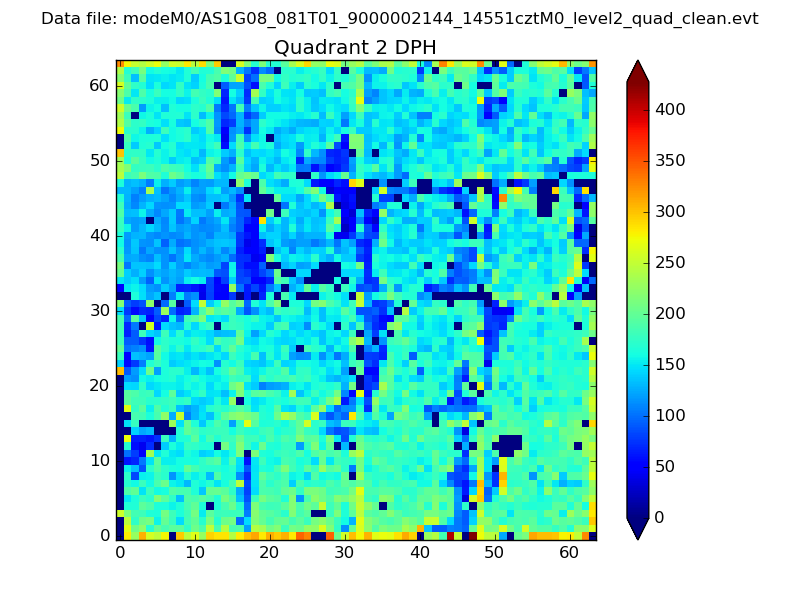
Histogram calculated using DETX and DETY for each event in the final _common_clean file
| Quadrant A | 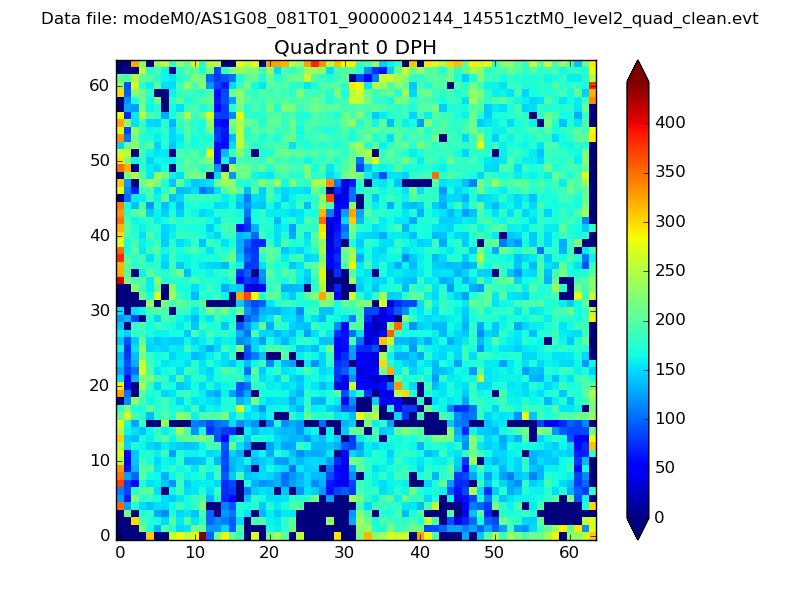 |
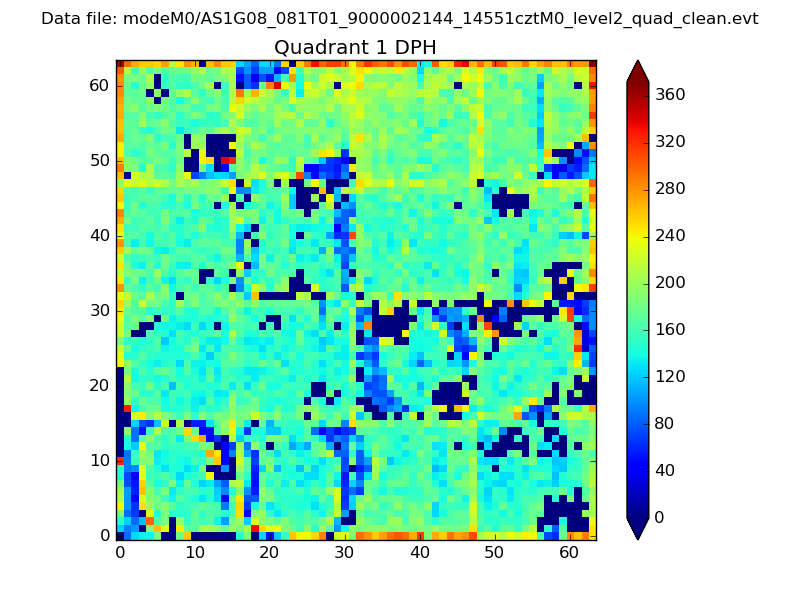 |
Quadrant B |
|---|---|---|---|
| Quadrant D | 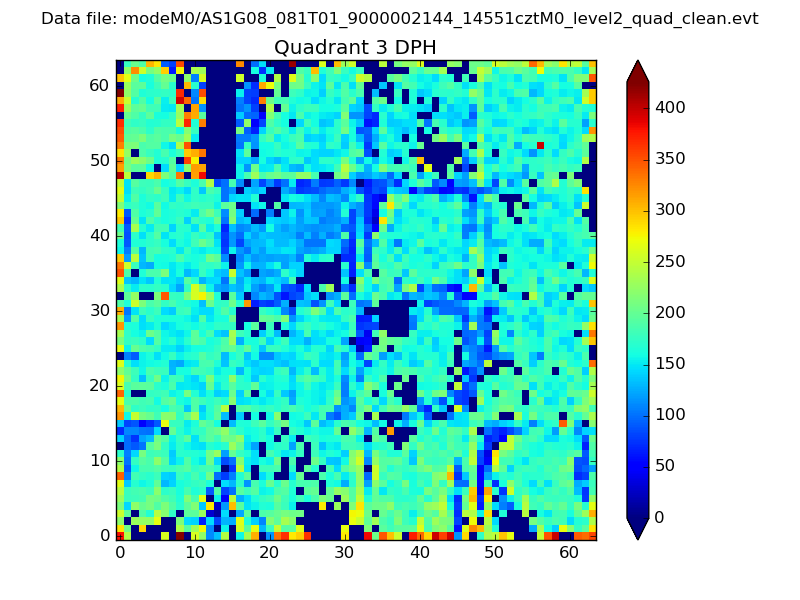 |
 |
Quadrant C |
| Plot type | Count rate plots | Images |
|---|---|---|
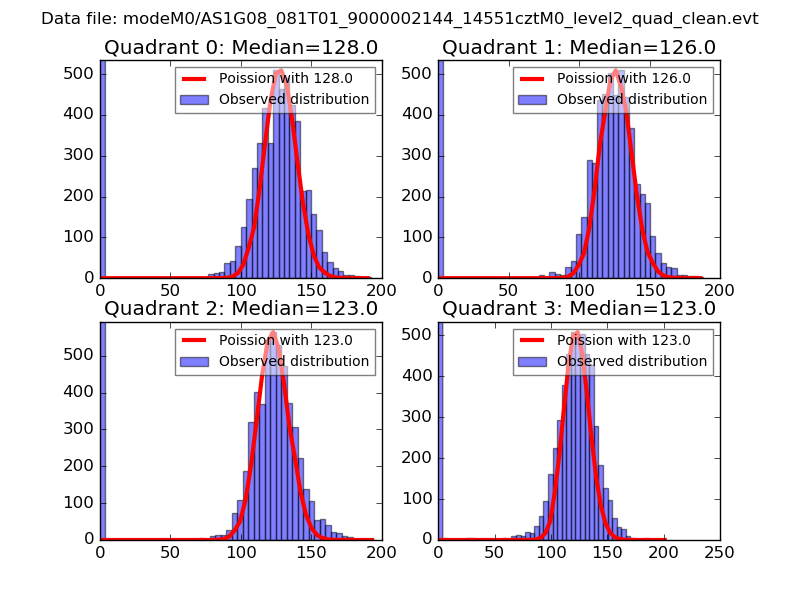
| Comparison with Poisson distribution Blue bars denote a histogram of data divided into 1 sec bins. Red curve is a Poisson curve with rate = median count rate of data. |
 |
 |
| Quadrant-wise count rates Data is divided into 100 sec bins |
 |
|
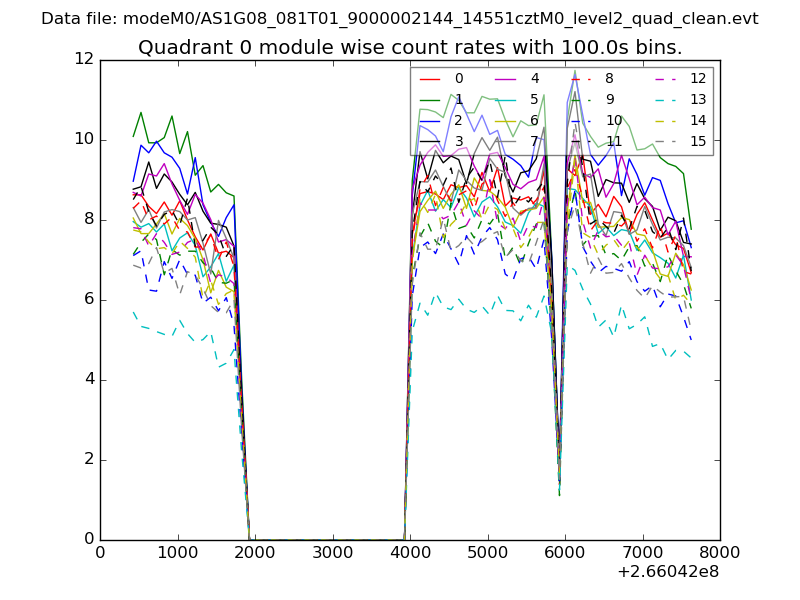
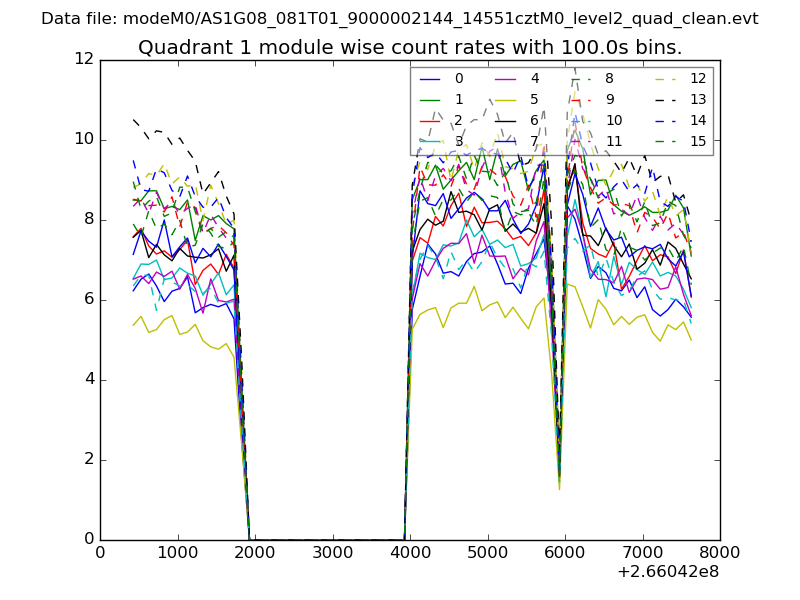
| Module-wise count rates for Quadrant A Data is divided into 100 sec bins |
 |
 |
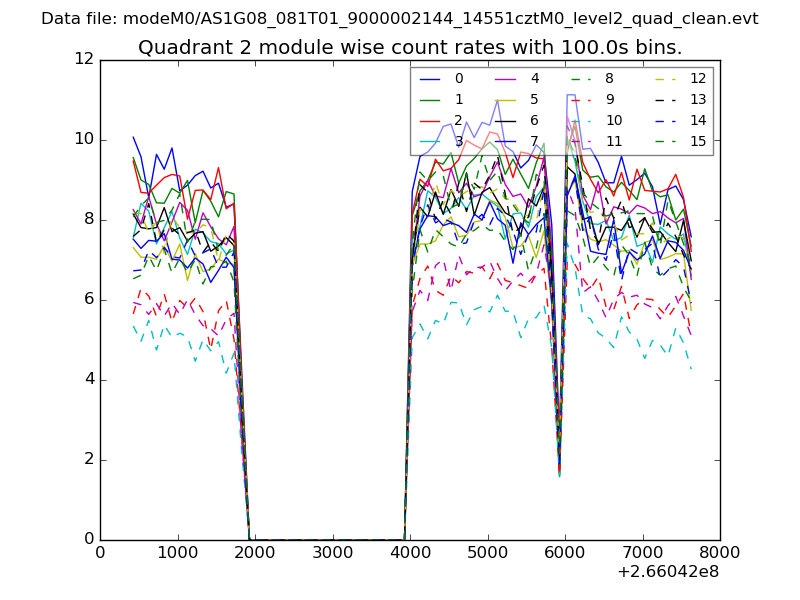
| Module-wise count rates for Quadrant B Data is divided into 100 sec bins |
 |
 |
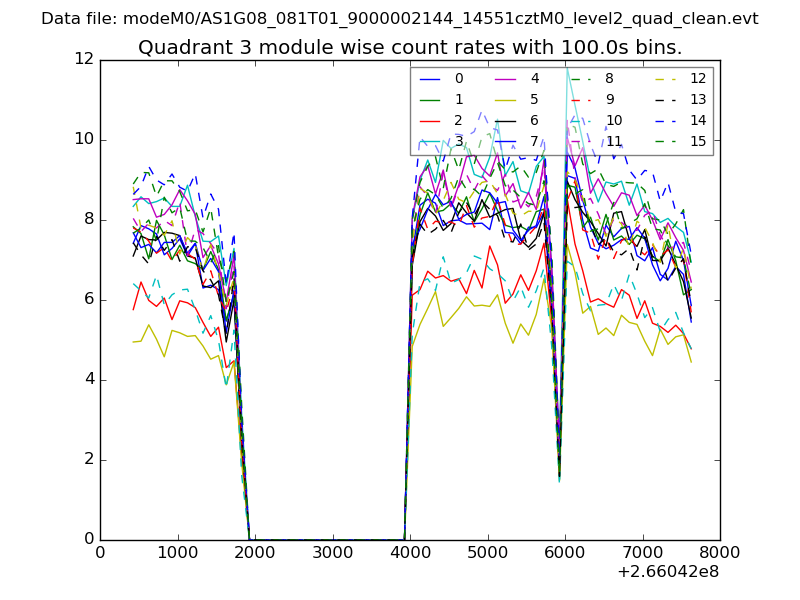
| Module-wise count rates for Quadrant C Data is divided into 100 sec bins |
 |
 |
| Module-wise count rates for Quadrant D Data is divided into 100 sec bins |
 |
 |
| Parameter | Plot |
|---|---|
| CZT HV Monitor | 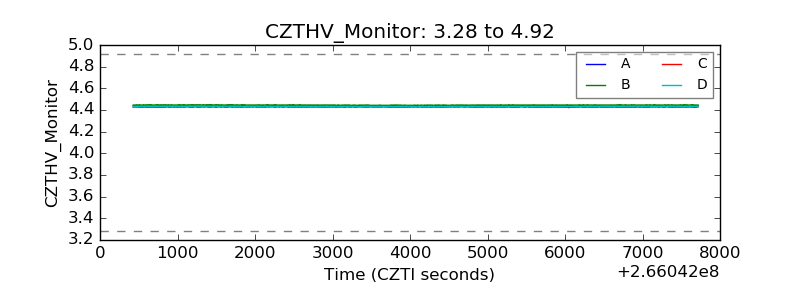 |
| D_VDD | 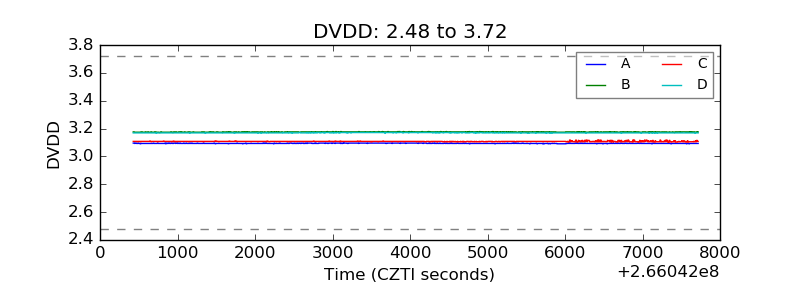 |
| Temperature 1 | 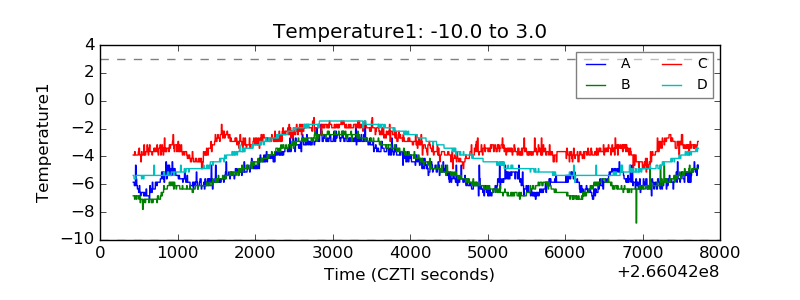 |
| Veto HV Monitor | 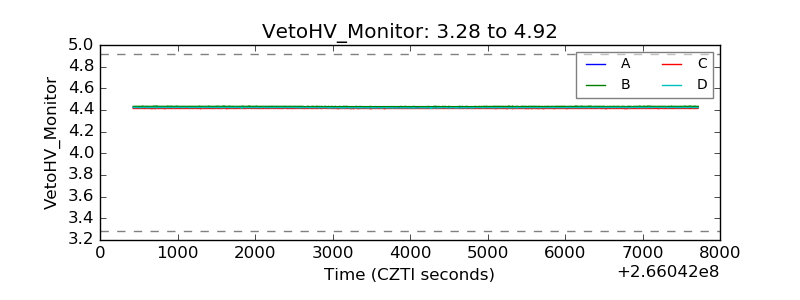 |
| Veto LLD | 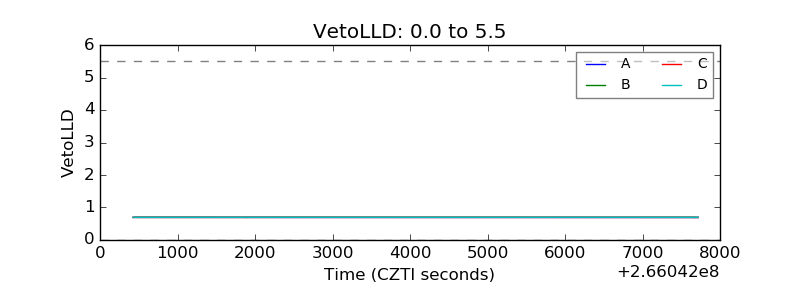 |
| Alpha Counter | 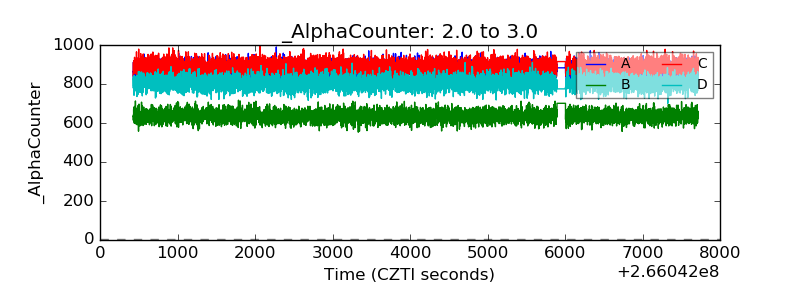 |
| _CPM_Rate | 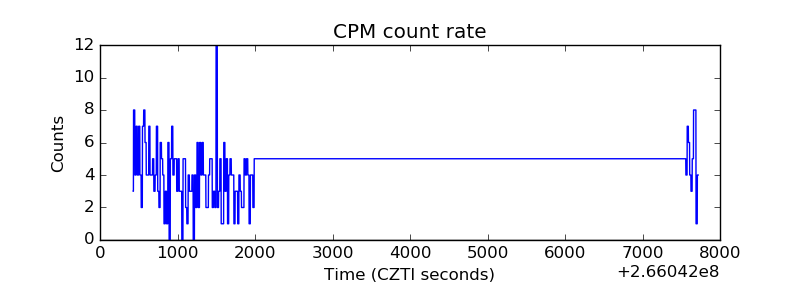 |
| CZT Counter | 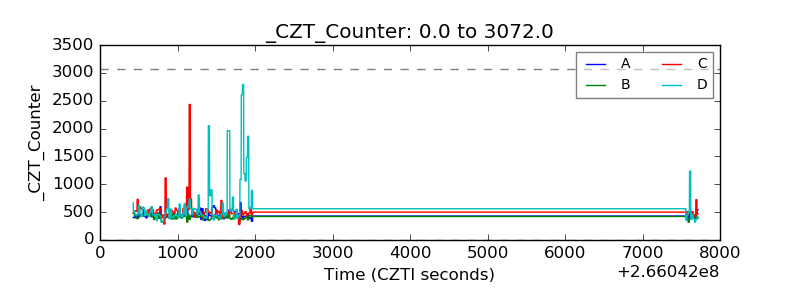 |
| +2.5 Volts monitor |  |
| +5 Volts monitor |  |
| _ROLL_ROT | 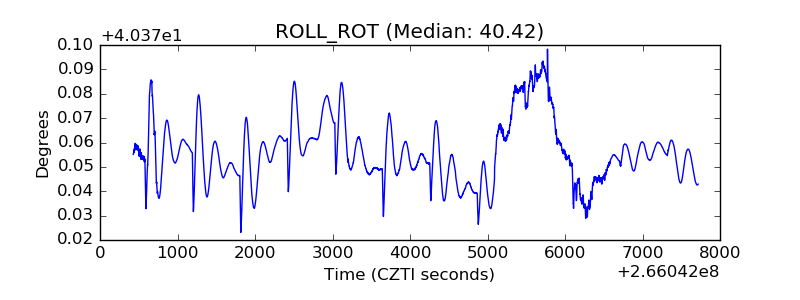 |
| _Roll_DEC | 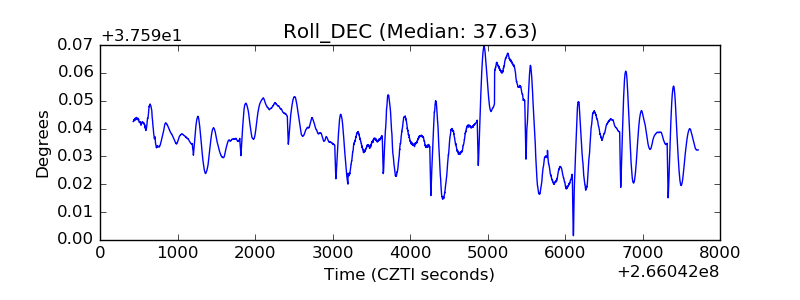 |
| _Roll_RA | 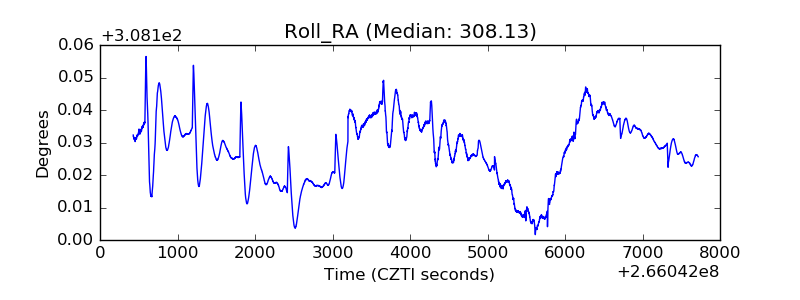 |
| Veto Counter | 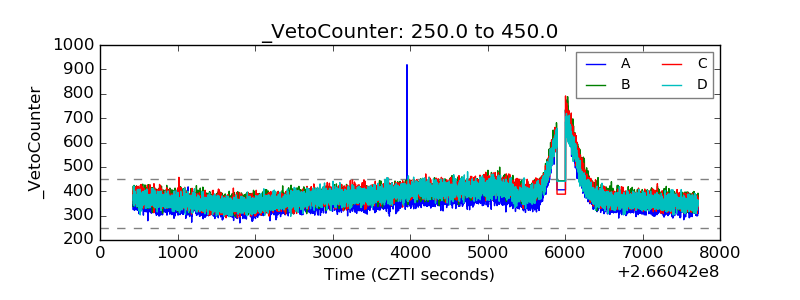 |