| Param | Original file | Final file |
|---|---|---|
| Filename | modeM0/AS1G08_081T01_9000002144_14552cztM0_level2.evt | modeM0/AS1G08_081T01_9000002144_14552cztM0_level2_quad_clean.evt |
| Size (bytes) | 487,031,040 | 92,136,960 |
| Size | 464.5 MB | 87.9 MB |
| Events in quadrant A | 3,499,863 | 582,622 |
| Events in quadrant B | 3,486,419 | 574,122 |
| Events in quadrant C | 3,726,622 | 565,973 |
| Events in quadrant D | 3,545,946 | 564,408 |
| Mode M9 | |||
|---|---|---|---|
| Quadrant | BADHDUFLAG | Total packets | Discarded packets |
| A | 0 | 3 | 0 |
| B | 0 | 3 | 0 |
| C | 0 | 3 | 0 |
| D | 0 | 3 | 0 |
| Mode SS | |||
|---|---|---|---|
| Quadrant | BADHDUFLAG | Total packets | Discarded packets |
| A | 0 | 148 | 0 |
| B | 0 | 148 | 0 |
| C | 0 | 148 | 0 |
| D | 0 | 148 | 0 |
| Mode M0 | |||
|---|---|---|---|
| Quadrant | BADHDUFLAG | Total packets | Discarded packets |
| A | 0 | 14963 | 2 |
| B | 0 | 15061 | 1 |
| C | 0 | 15382 | 1 |
| D | 0 | 15590 | 1 |
| Quadrant | Total seconds | Saturated seconds | Saturation percentage |
|---|---|---|---|
| A | 7227 | 108 | 1.494396% |
| B | 7227 | 142 | 1.964854% |
| C | 7227 | 80 | 1.106960% |
| D | 7227 | 130 | 1.798810% |
Noise dominated data is calculated using 1-second bins in cleaned event files. If a bin has >2000 counts, and if more than 50% of those come from <1% of pixels, then it is considered to be noise-dominated and hence unusable.
| Quadrant | # 1 sec bins | Bins with >0 counts | Bins with >2000 counts | High rate bins dominated by noise | Noise dominated (total time) | Noise dominated (detector-on time) | Marked lightcurve |
|---|---|---|---|---|---|---|---|
| A | 7518 | 7230 | 0 | 0 | 0.00% | 0.00% | 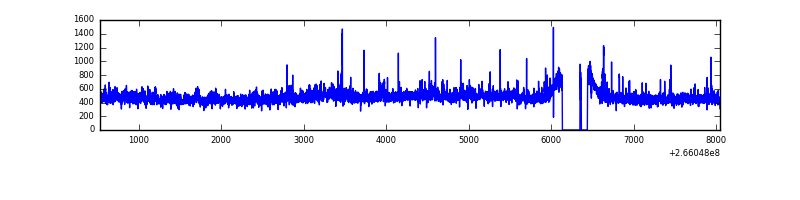 |
| B | 7518 | 7230 | 7 | 7 | 0.09% | 0.10% | 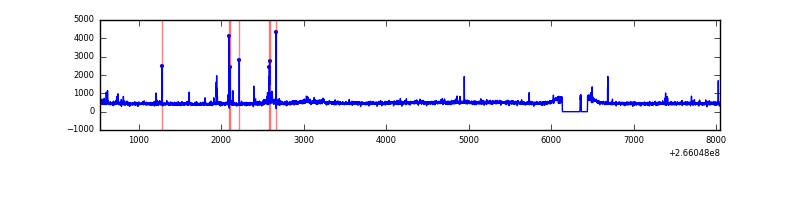 |
| C | 7518 | 7230 | 0 | 0 | 0.00% | 0.00% | 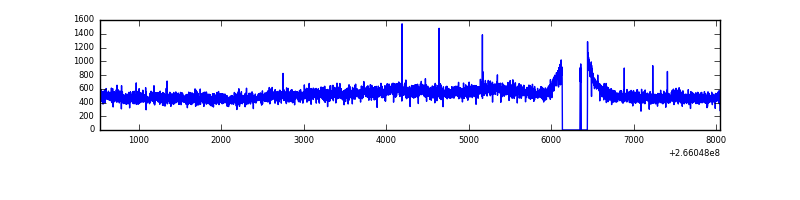 |
| D | 7518 | 7230 | 38 | 38 | 0.51% | 0.53% | 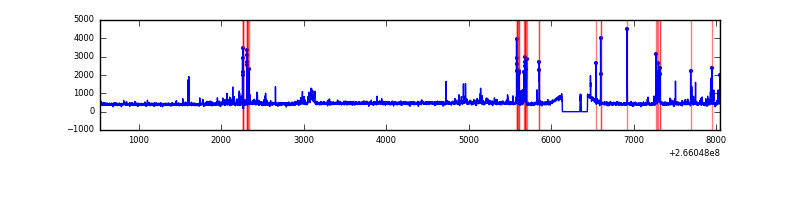 |
Top three noisy pixels from each quadrant. If the there are fewer than three noisy pixels in the level2.evt file, extra rows are filled as -1
| Pixel properties | Quadrant properties | ||||||
|---|---|---|---|---|---|---|---|
| Quadrant | DetID | PixID | Counts | Sigma | Mean | Median | Sigma |
| A | 8 | 15 | 158129 | 908.54 | 854 | 833 | 173.1 |
| A | 0 | 23 | 25960 | 145.13 | 854 | 833 | 173.1 |
| A | 12 | 189 | 24391 | 136.07 | 854 | 833 | 173.1 |
| B | 0 | 189 | 69169 | 414.32 | 847 | 824 | 165.0 |
| B | 4 | 48 | 30926 | 182.49 | 847 | 824 | 165.0 |
| B | 0 | 230 | 21430 | 124.92 | 847 | 824 | 165.0 |
| C | 3 | 233 | 498533 | 2599.85 | 821 | 825 | 191.4 |
| C | 8 | 128 | 11627 | 56.43 | 821 | 825 | 191.4 |
| C | 13 | 61 | 6021 | 27.14 | 821 | 825 | 191.4 |
| D | 10 | 199 | 203883 | 1016.65 | 826 | 801 | 199.8 |
| D | 2 | 152 | 107316 | 533.22 | 826 | 801 | 199.8 |
| D | 9 | 1 | 38599 | 189.22 | 826 | 801 | 199.8 |
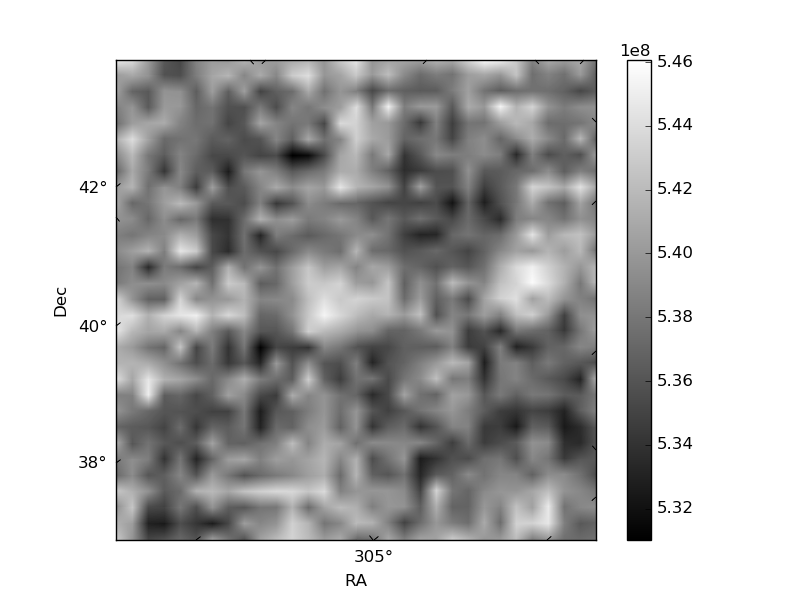
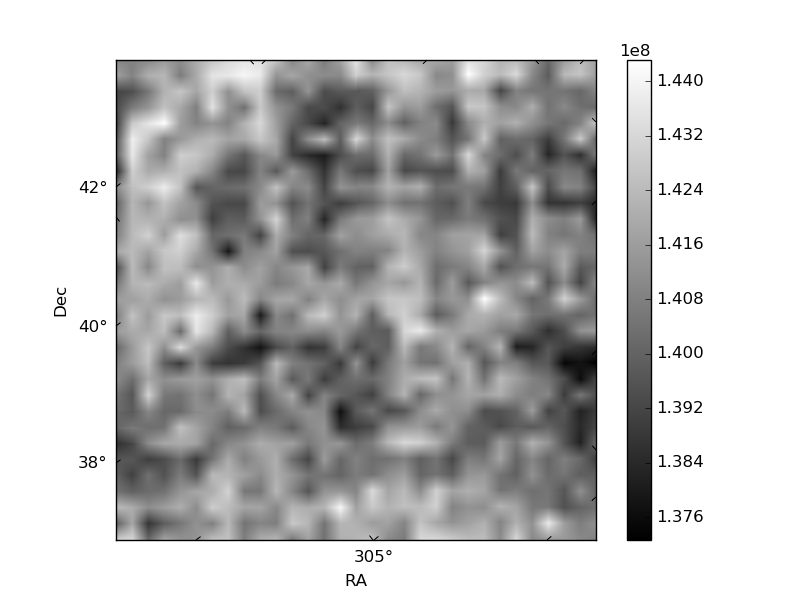
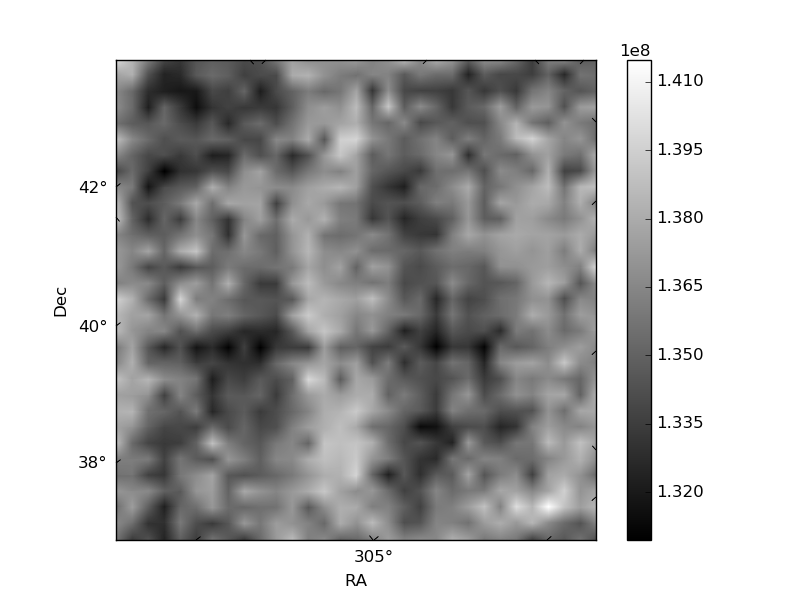
Histogram calculated using DETX and DETY for each event in the final _common_clean file
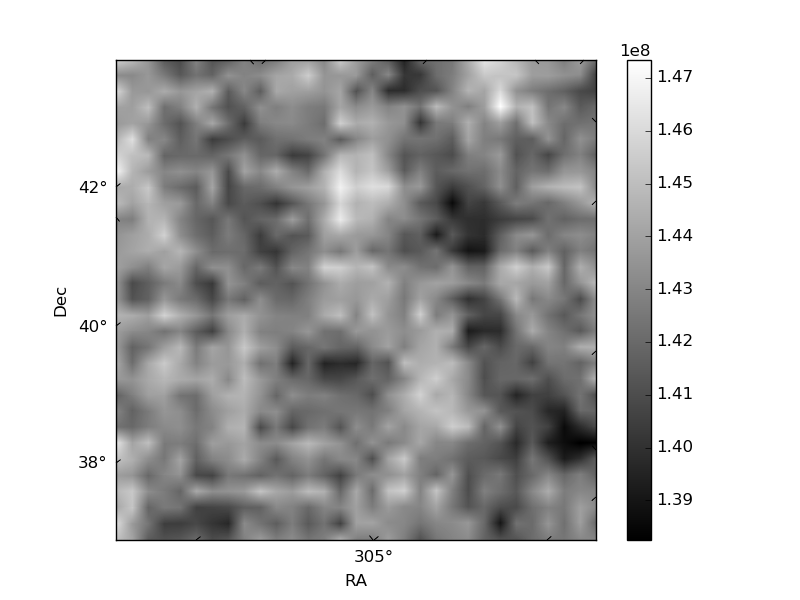
| Quadrant A | 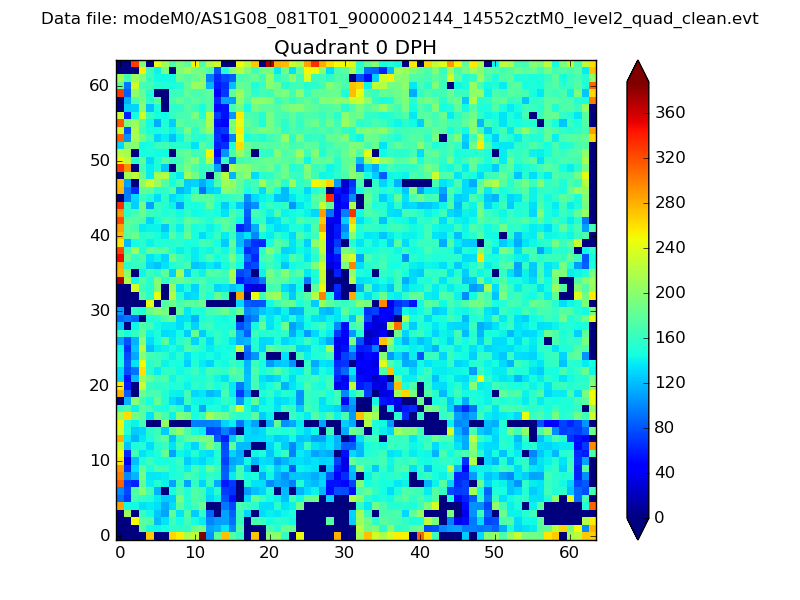 |
 |
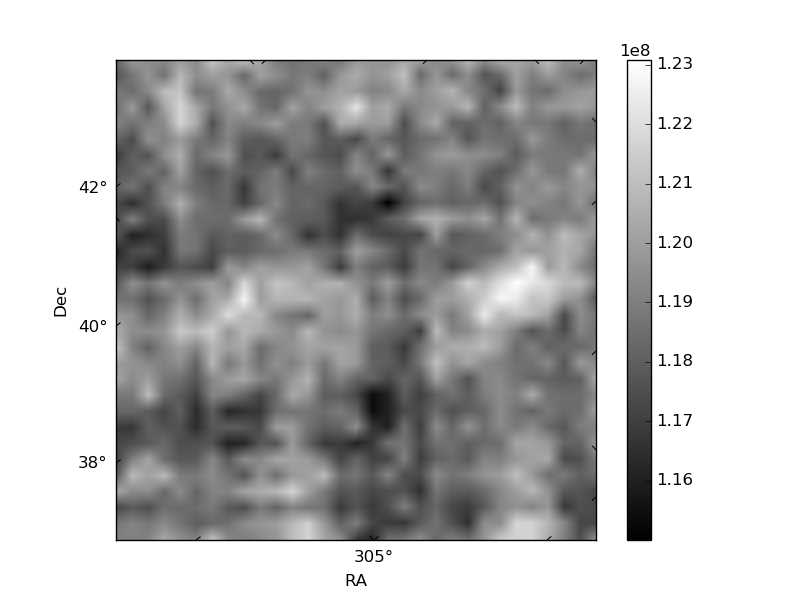
Quadrant B |
|---|---|---|---|
| Quadrant D | 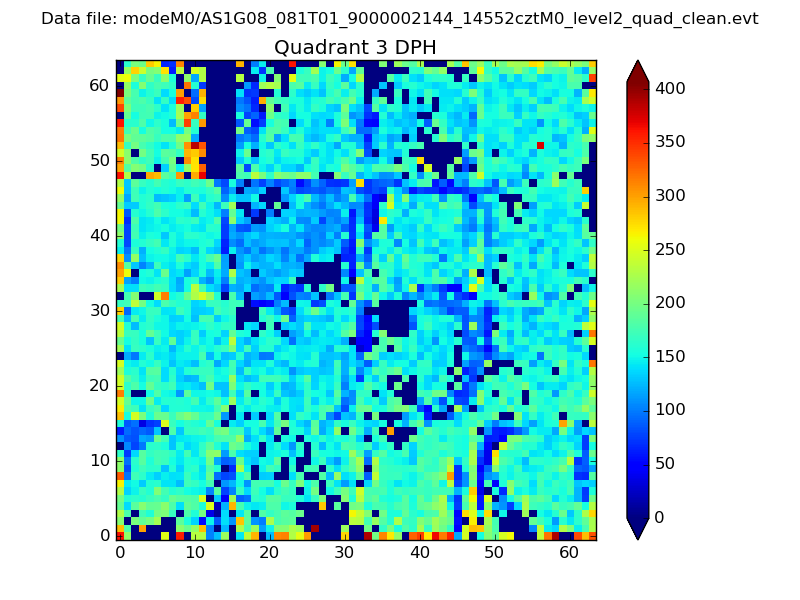 |
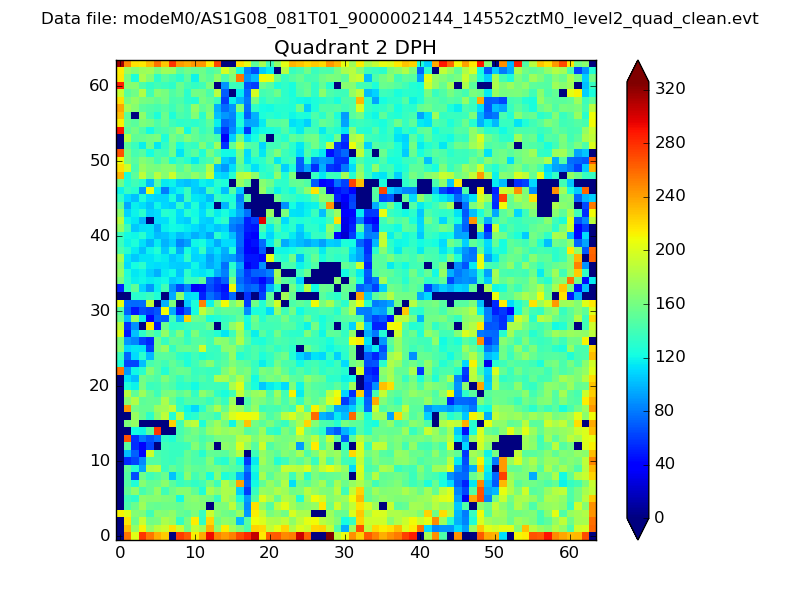 |
Quadrant C |
| Plot type | Count rate plots | Images |
|---|---|---|
| Comparison with Poisson distribution Blue bars denote a histogram of data divided into 1 sec bins. Red curve is a Poisson curve with rate = median count rate of data. |
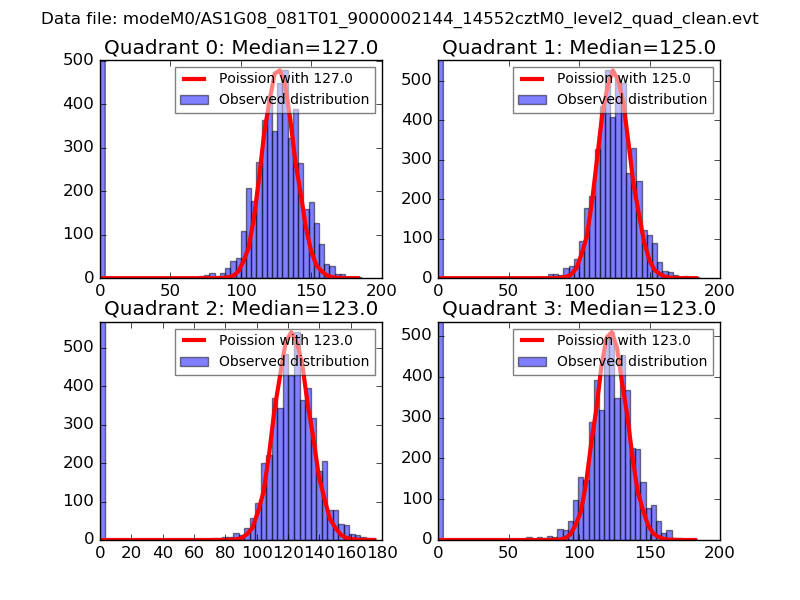 |
 |
| Quadrant-wise count rates Data is divided into 100 sec bins |
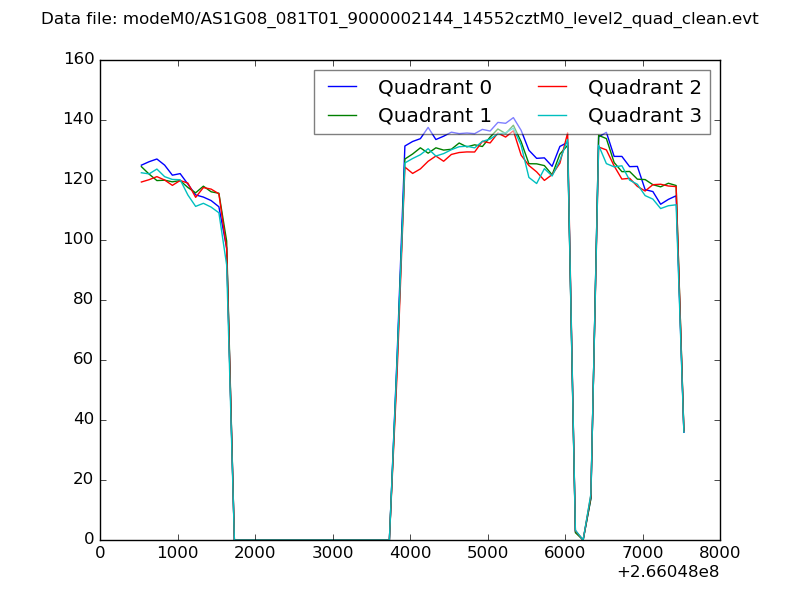 |
|
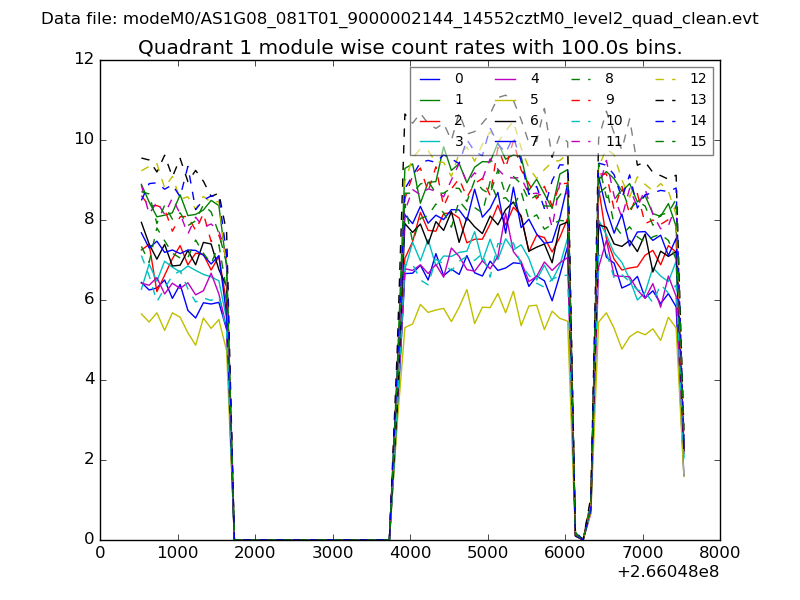
| Module-wise count rates for Quadrant A Data is divided into 100 sec bins |
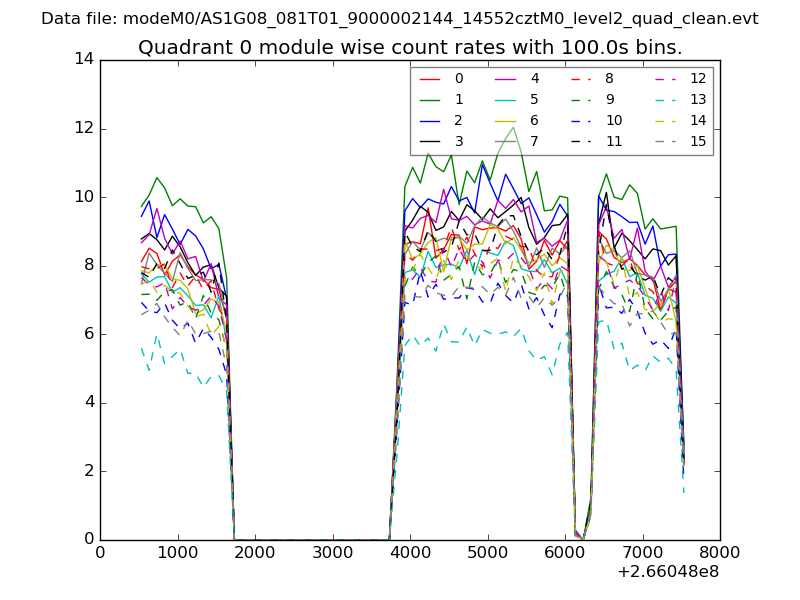 |
 |
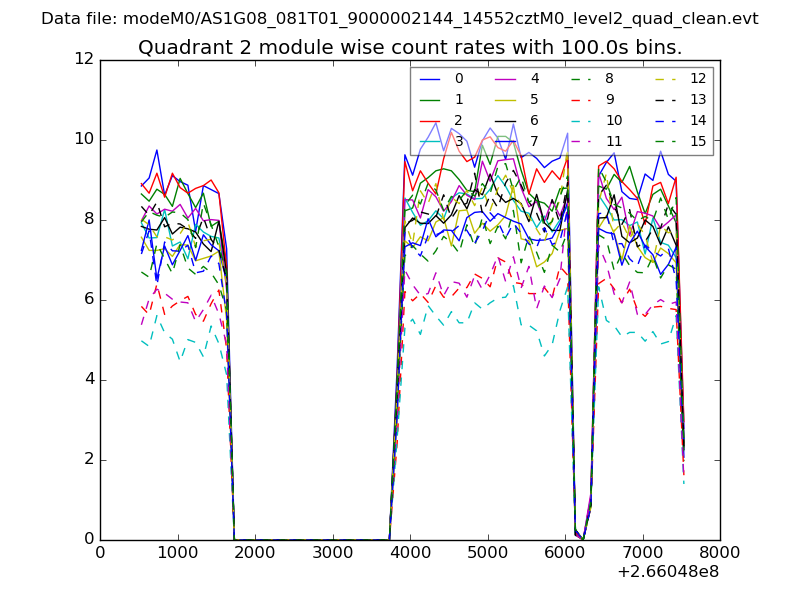
| Module-wise count rates for Quadrant B Data is divided into 100 sec bins |
 |
 |
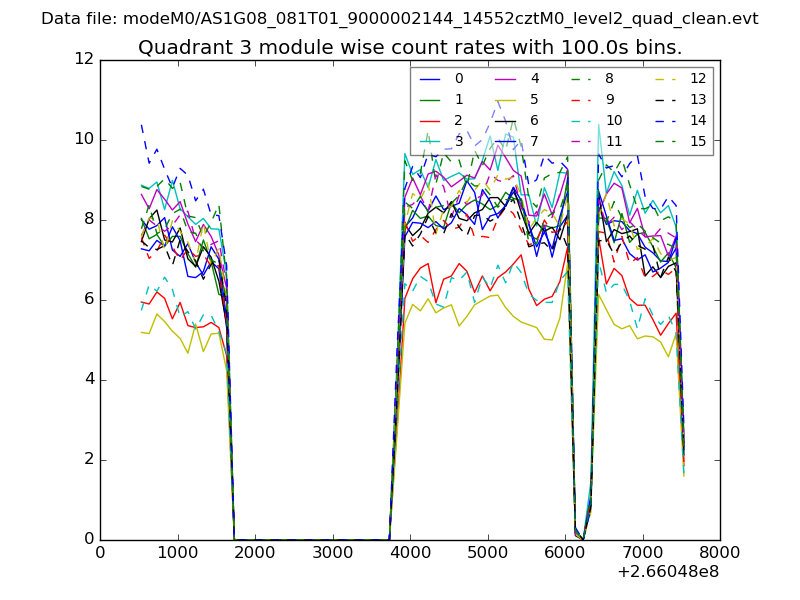
| Module-wise count rates for Quadrant C Data is divided into 100 sec bins |
 |
 |
| Module-wise count rates for Quadrant D Data is divided into 100 sec bins |
 |
 |
| Parameter | Plot |
|---|---|
| CZT HV Monitor | 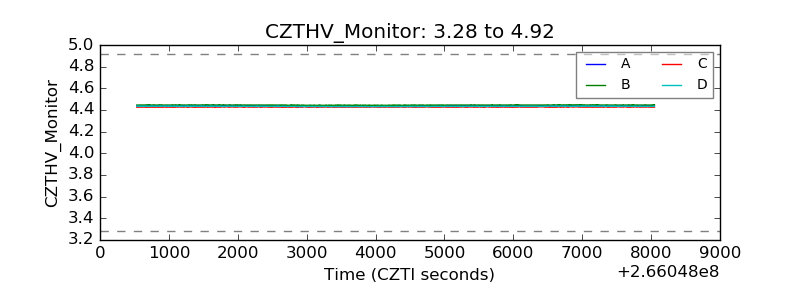 |
| D_VDD | 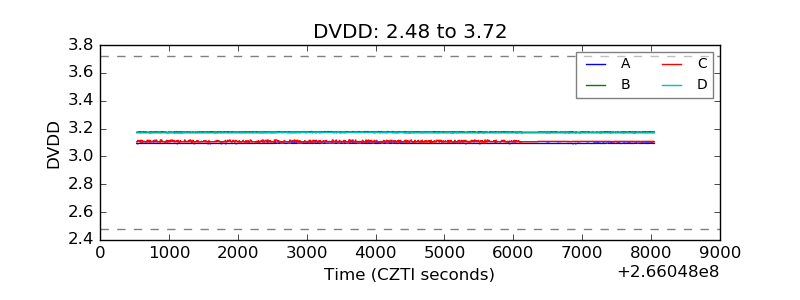 |
| Temperature 1 | 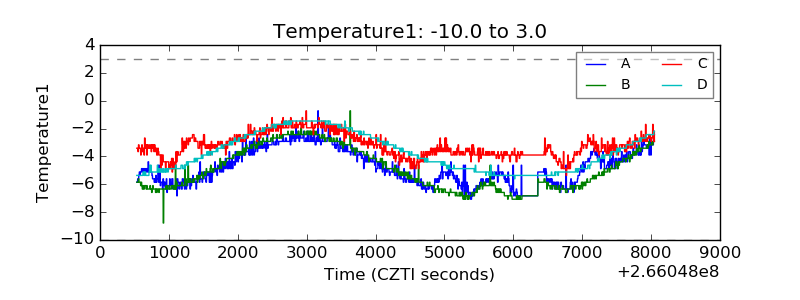 |
| Veto HV Monitor | 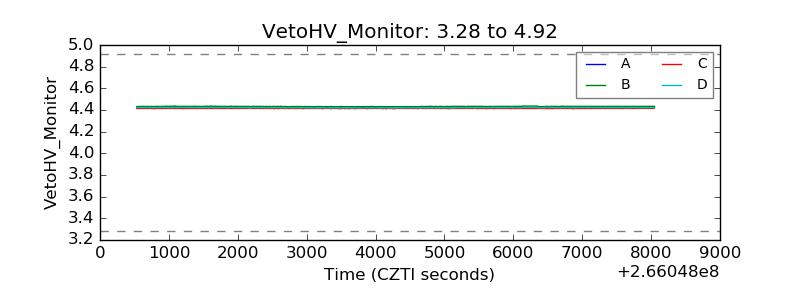 |
| Veto LLD | 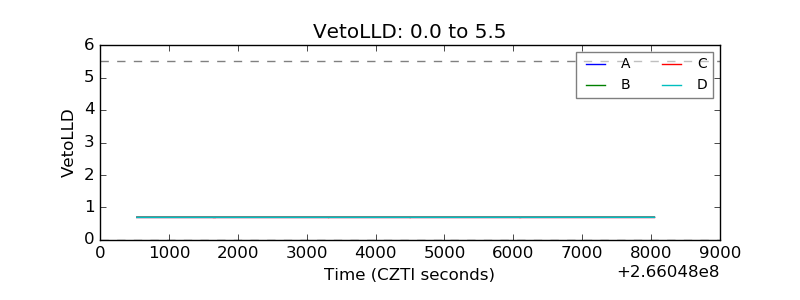 |
| Alpha Counter | 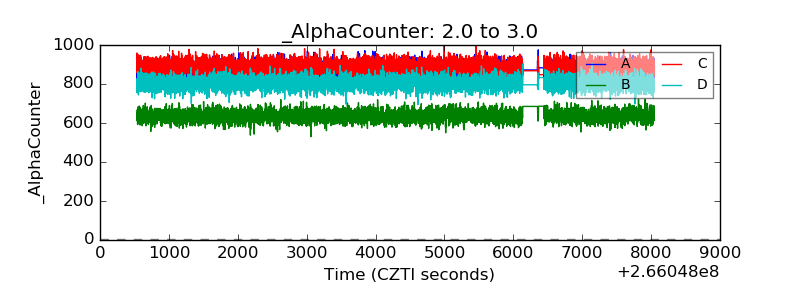 |
| _CPM_Rate | 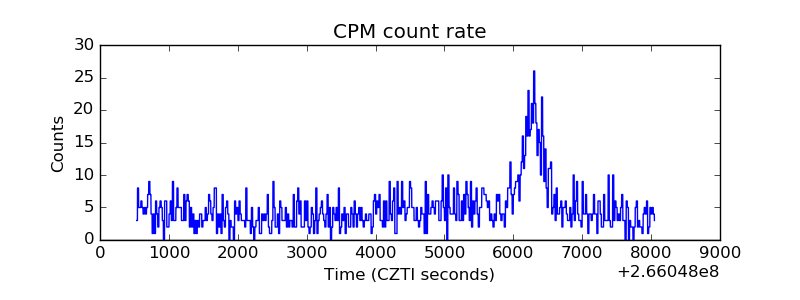 |
| CZT Counter | 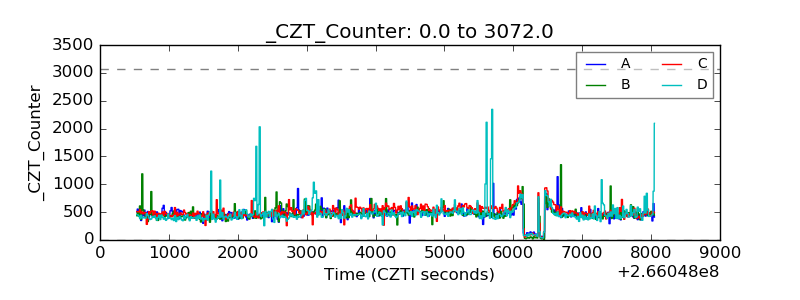 |
| +2.5 Volts monitor |  |
| +5 Volts monitor |  |
| _ROLL_ROT | 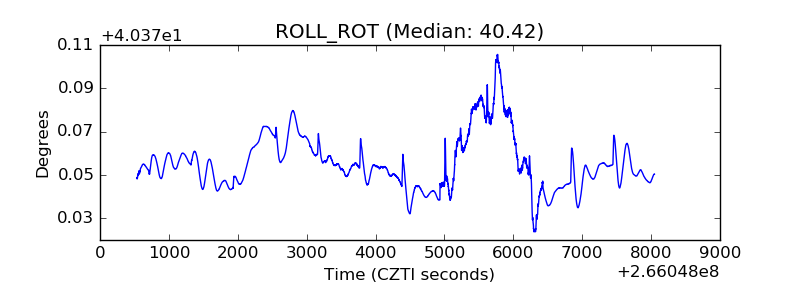 |
| _Roll_DEC | 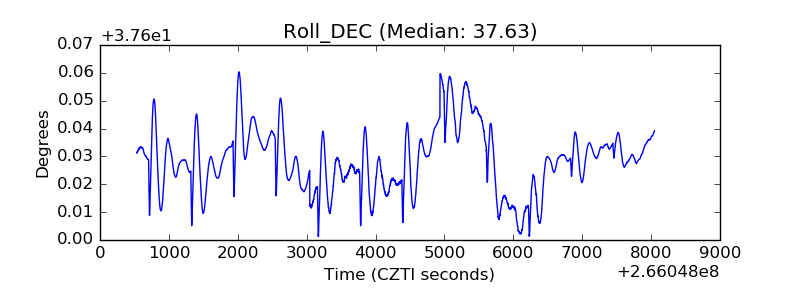 |
| _Roll_RA | 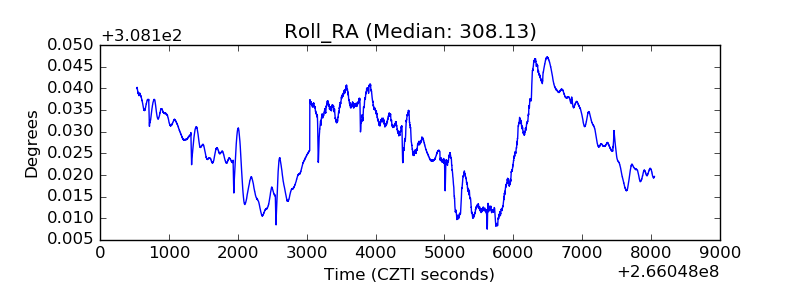 |
| Veto Counter |  |