| Param | Original file | Final file |
|---|---|---|
| Filename | modeM0/AS1G08_081T01_9000002144_14556cztM0_level2.evt | modeM0/AS1G08_081T01_9000002144_14556cztM0_level2_quad_clean.evt |
| Size (bytes) | 230,117,760 | 24,664,320 |
| Size | 219.5 MB | 23.5 MB |
| Events in quadrant A | 1,802,631 | 138,714 |
| Events in quadrant B | 1,602,139 | 133,949 |
| Events in quadrant C | 1,860,047 | 128,761 |
| Events in quadrant D | 1,501,560 | 133,747 |
| Mode M9 | |||
|---|---|---|---|
| Quadrant | BADHDUFLAG | Total packets | Discarded packets |
| A | 0 | 9 | 0 |
| B | 0 | 9 | 0 |
| C | 0 | 9 | 0 |
| D | 0 | 9 | 0 |
| Mode SS | |||
|---|---|---|---|
| Quadrant | BADHDUFLAG | Total packets | Discarded packets |
| A | 0 | 60 | 0 |
| B | 0 | 60 | 0 |
| C | 0 | 60 | 0 |
| D | 0 | 60 | 0 |
| Mode M0 | |||
|---|---|---|---|
| Quadrant | BADHDUFLAG | Total packets | Discarded packets |
| A | 0 | 7242 | 1 |
| B | 0 | 6680 | 1 |
| C | 0 | 7748 | 1 |
| D | 0 | 6408 | 1 |
| Quadrant | Total seconds | Saturated seconds | Saturation percentage |
|---|---|---|---|
| A | 2963 | 32 | 1.079987% |
| B | 2963 | 23 | 0.776240% |
| C | 2963 | 17 | 0.573743% |
| D | 2963 | 26 | 0.877489% |
Noise dominated data is calculated using 1-second bins in cleaned event files. If a bin has >2000 counts, and if more than 50% of those come from <1% of pixels, then it is considered to be noise-dominated and hence unusable.
| Quadrant | # 1 sec bins | Bins with >0 counts | Bins with >2000 counts | High rate bins dominated by noise | Noise dominated (total time) | Noise dominated (detector-on time) | Marked lightcurve |
|---|---|---|---|---|---|---|---|
| A | 3789 | 2965 | 1 | 1 | 0.03% | 0.03% | 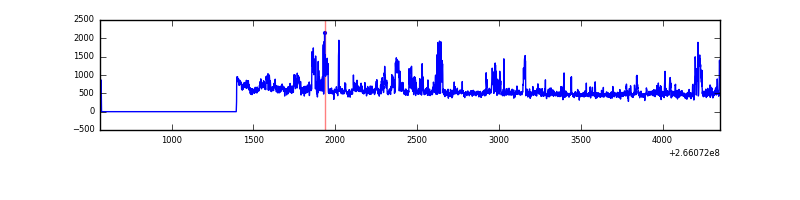 |
| B | 3789 | 2965 | 1 | 1 | 0.03% | 0.03% | 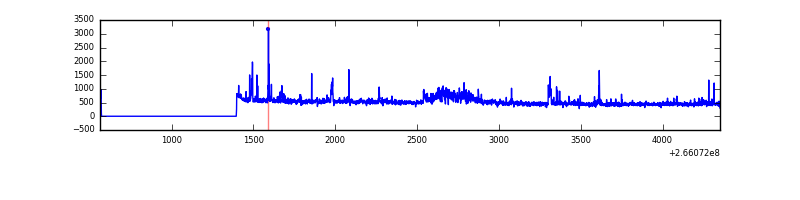 |
| C | 3789 | 2965 | 0 | 0 | 0.00% | 0.00% | 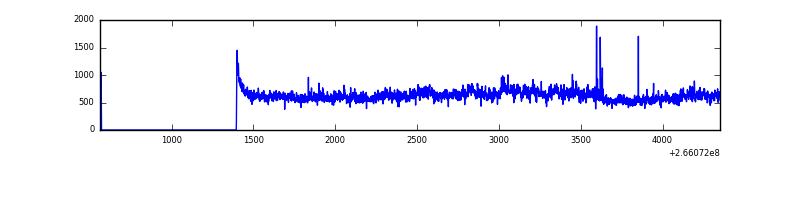 |
| D | 3789 | 2965 | 8 | 8 | 0.21% | 0.27% | 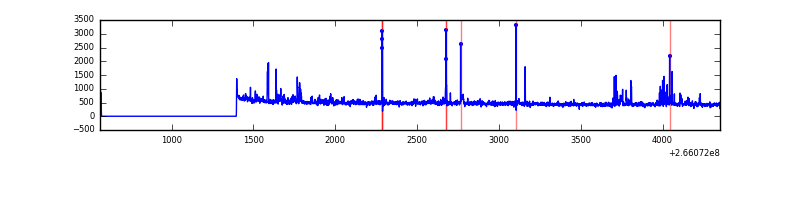 |
Top three noisy pixels from each quadrant. If the there are fewer than three noisy pixels in the level2.evt file, extra rows are filled as -1
| Pixel properties | Quadrant properties | ||||||
|---|---|---|---|---|---|---|---|
| Quadrant | DetID | PixID | Counts | Sigma | Mean | Median | Sigma |
| A | 0 | 23 | 286619 | 3808.0 | 366 | 358 | 75.2 |
| A | 12 | 189 | 51151 | 675.68 | 366 | 358 | 75.2 |
| A | 8 | 15 | 35278 | 464.52 | 366 | 358 | 75.2 |
| B | 0 | 189 | 119463 | 1669.78 | 361 | 351 | 71.3 |
| B | 4 | 173 | 23178 | 320.0 | 361 | 351 | 71.3 |
| B | 4 | 48 | 9498 | 128.23 | 361 | 351 | 71.3 |
| C | 3 | 233 | 466628 | 5650.94 | 352 | 353 | 82.5 |
| C | 6 | 96 | 13158 | 155.19 | 352 | 353 | 82.5 |
| C | 14 | 220 | 3542 | 38.65 | 352 | 353 | 82.5 |
| D | 2 | 152 | 44564 | 499.69 | 355 | 347 | 88.5 |
| D | 10 | 199 | 35488 | 397.12 | 355 | 347 | 88.5 |
| D | 13 | 172 | 35167 | 393.5 | 355 | 347 | 88.5 |
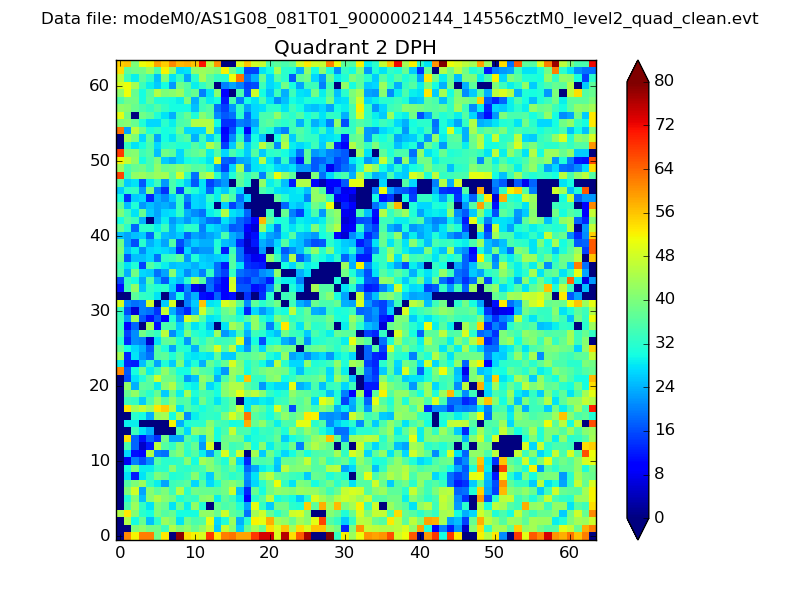
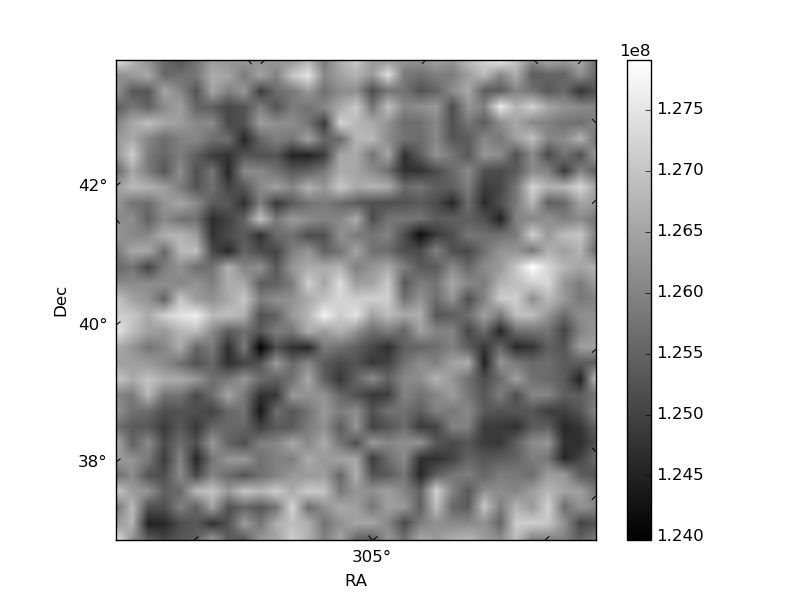
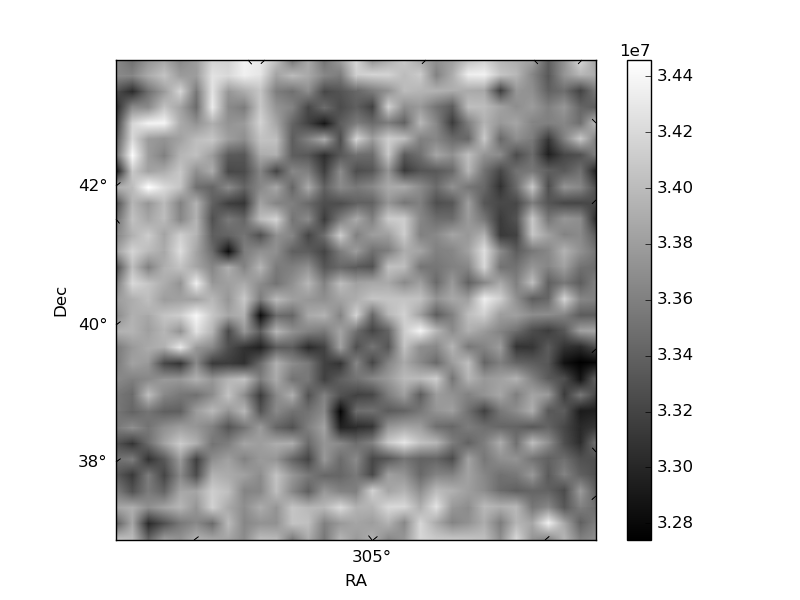
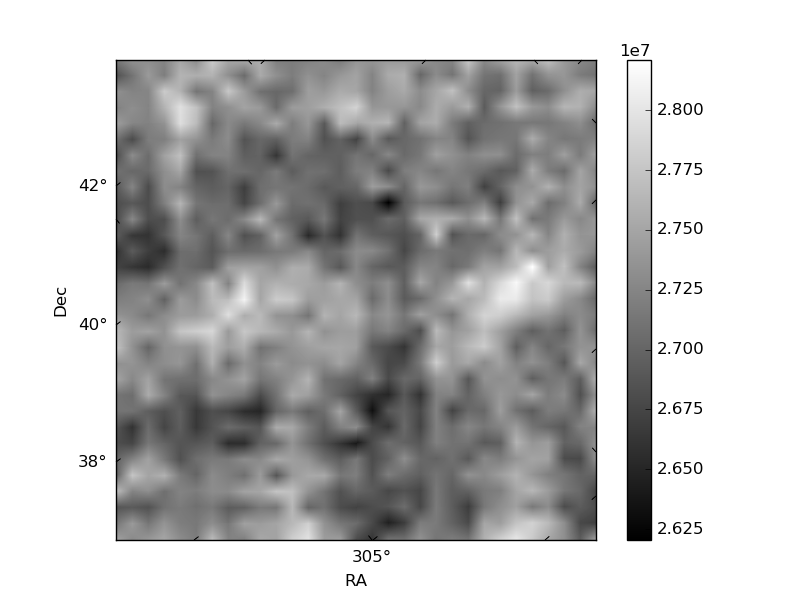
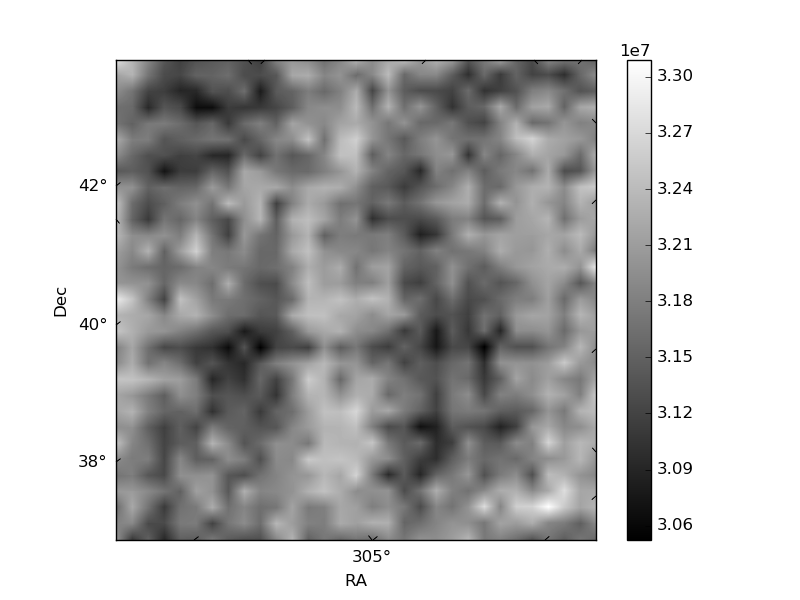
Histogram calculated using DETX and DETY for each event in the final _common_clean file
| Quadrant A | 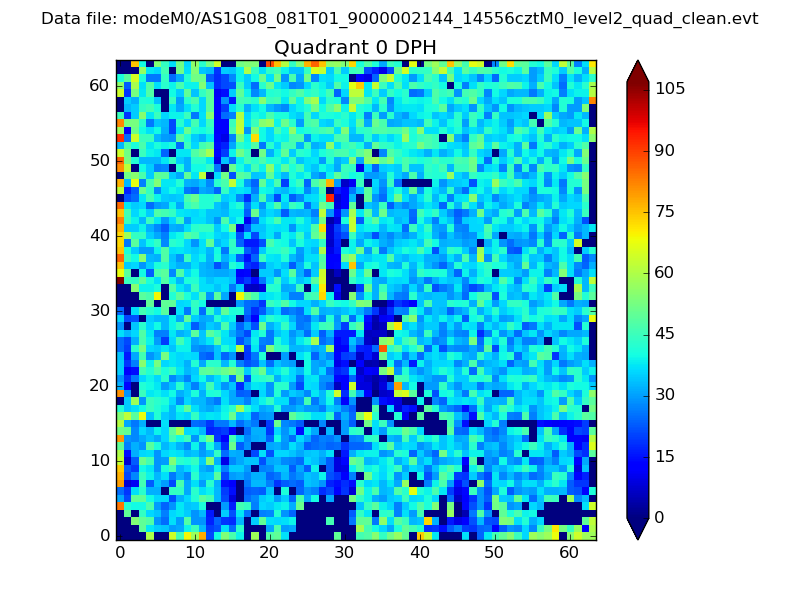 |
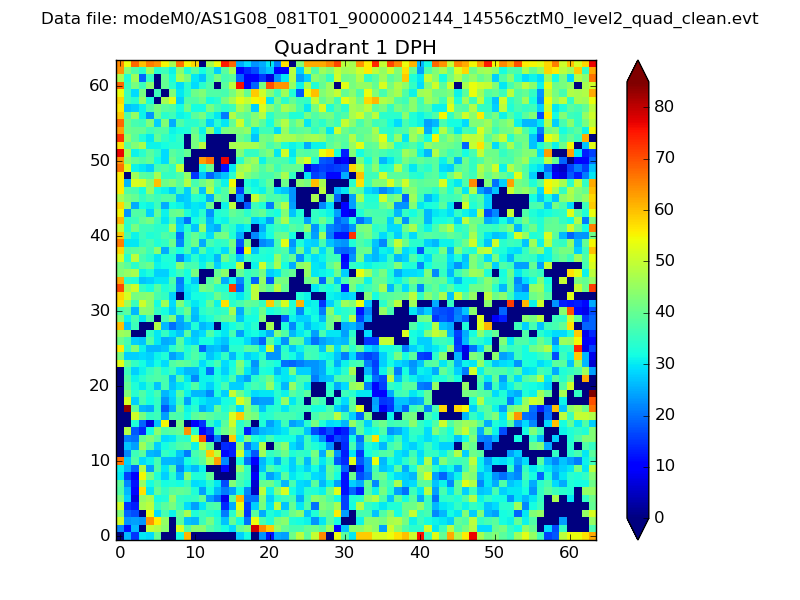 |
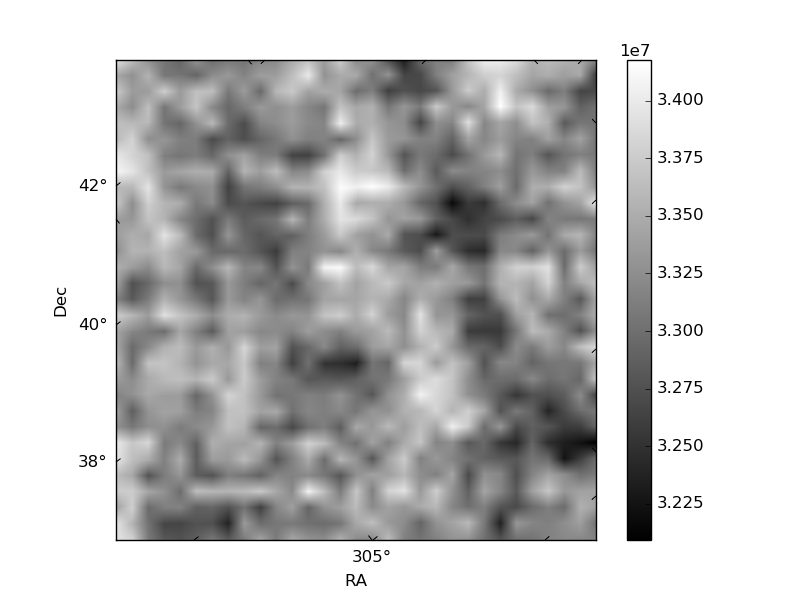
Quadrant B |
|---|---|---|---|
| Quadrant D | 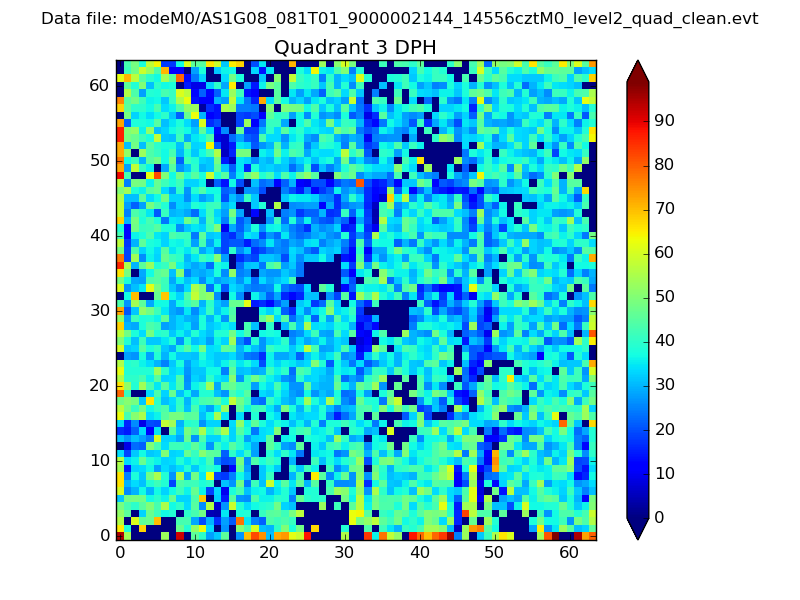 |
 |
Quadrant C |
| Plot type | Count rate plots | Images |
|---|---|---|
| Comparison with Poisson distribution Blue bars denote a histogram of data divided into 1 sec bins. Red curve is a Poisson curve with rate = median count rate of data. |
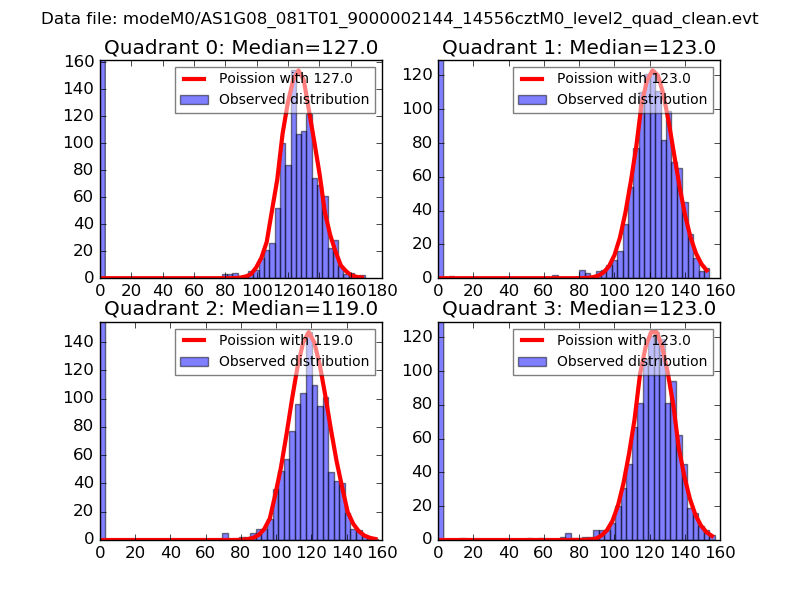 |
 |
| Quadrant-wise count rates Data is divided into 100 sec bins |
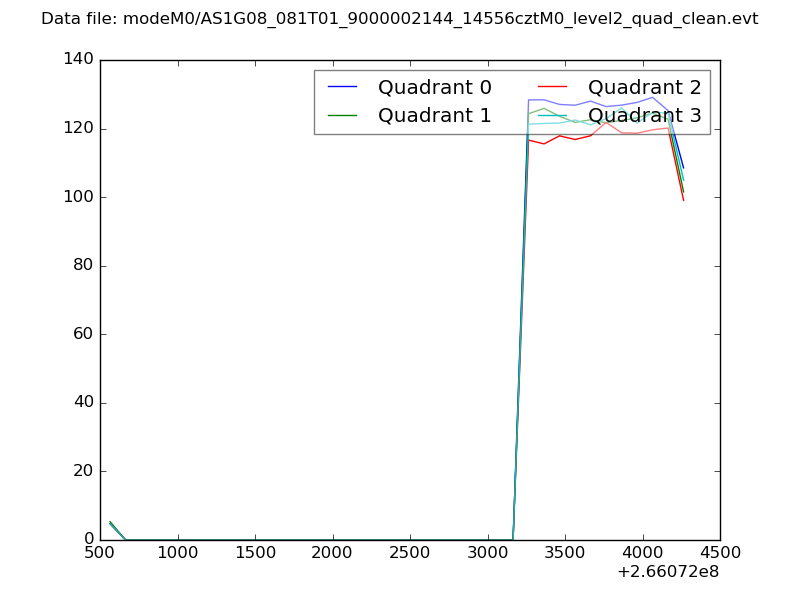 |
|
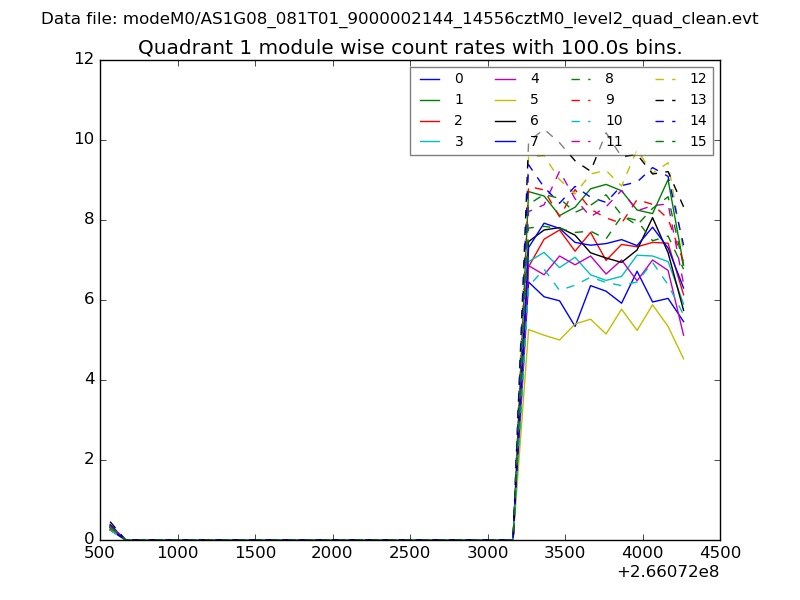
| Module-wise count rates for Quadrant A Data is divided into 100 sec bins |
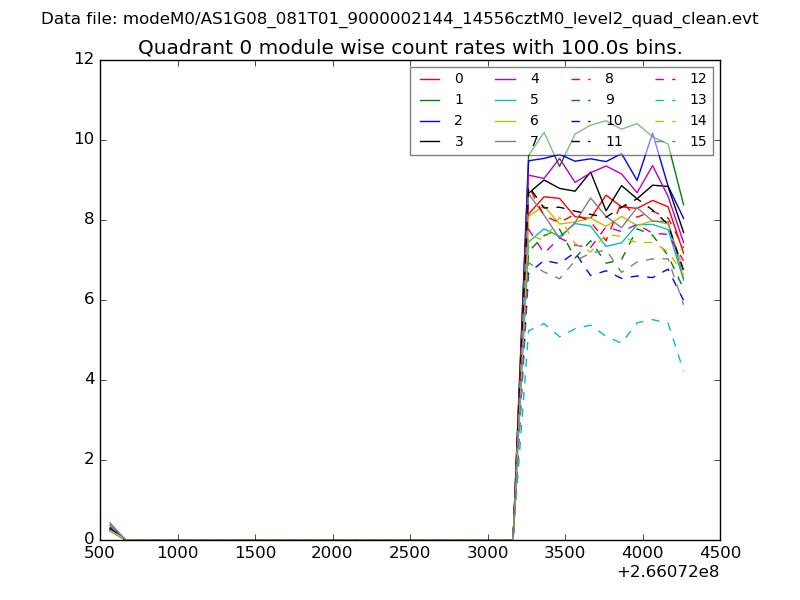 |
 |
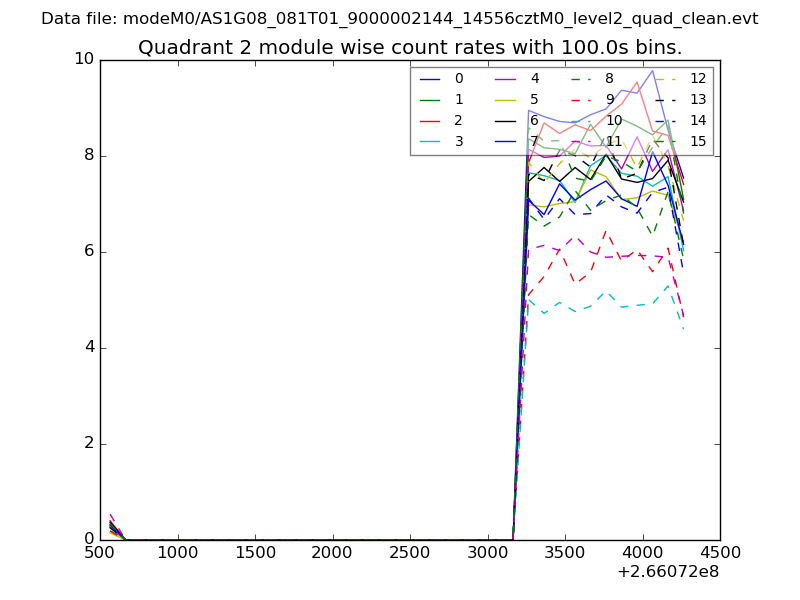
| Module-wise count rates for Quadrant B Data is divided into 100 sec bins |
 |
 |
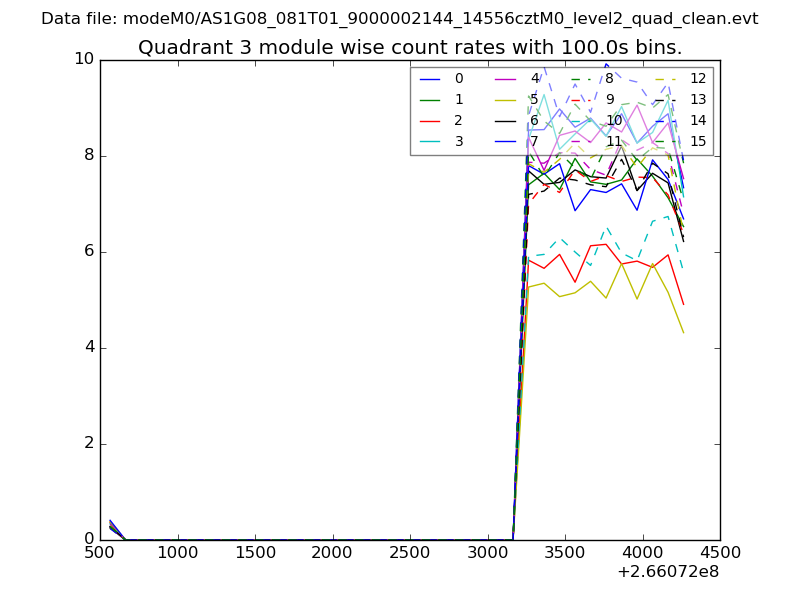
| Module-wise count rates for Quadrant C Data is divided into 100 sec bins |
 |
 |
| Module-wise count rates for Quadrant D Data is divided into 100 sec bins |
 |
 |
| Parameter | Plot |
|---|---|
| CZT HV Monitor | 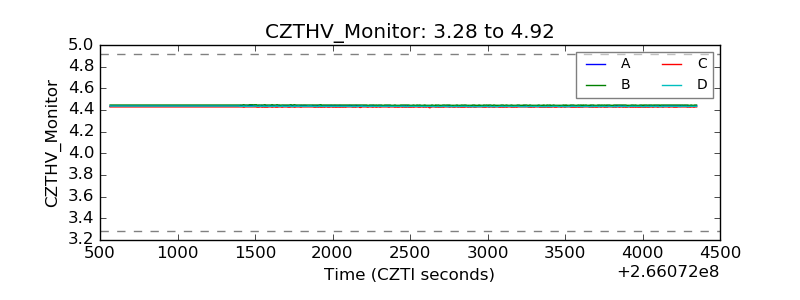 |
| D_VDD | 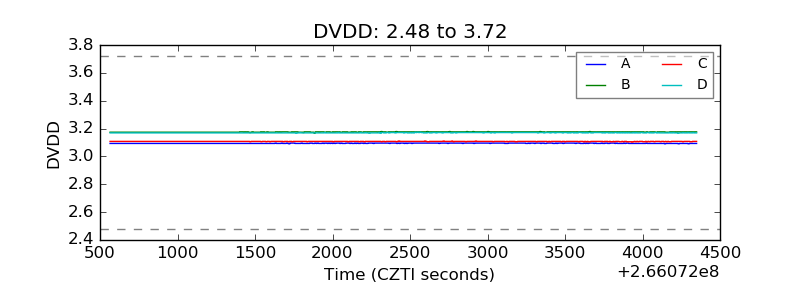 |
| Temperature 1 | 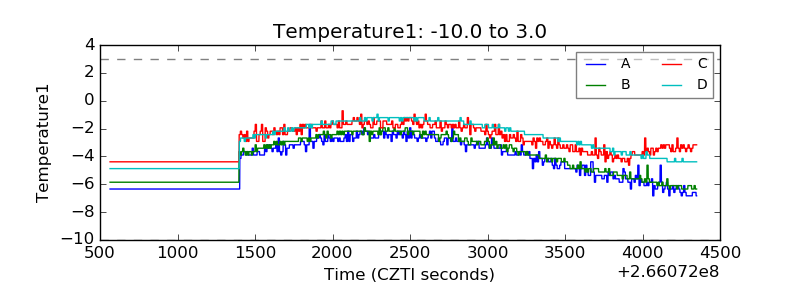 |
| Veto HV Monitor | 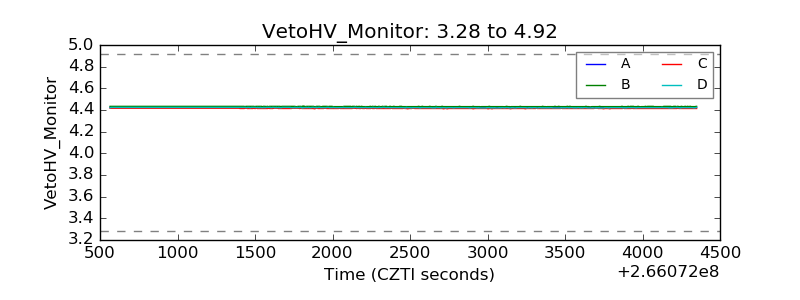 |
| Veto LLD | 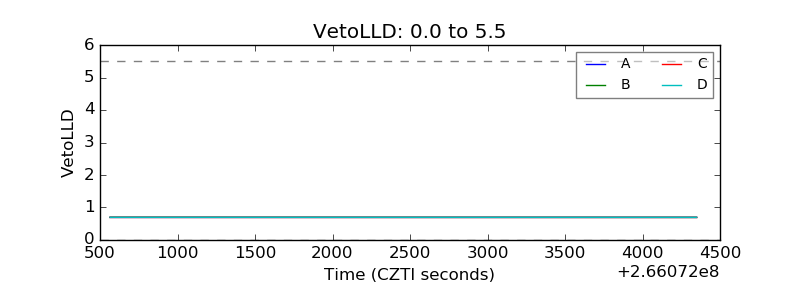 |
| Alpha Counter | 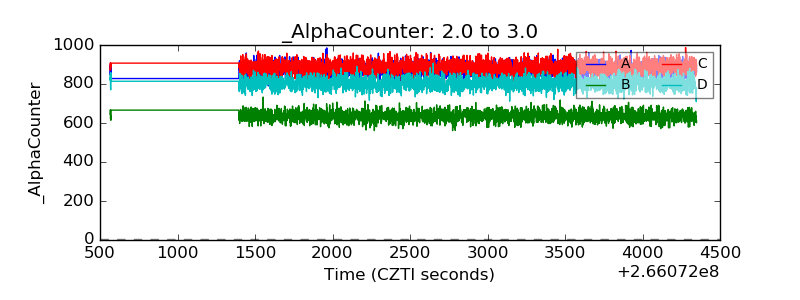 |
| _CPM_Rate | 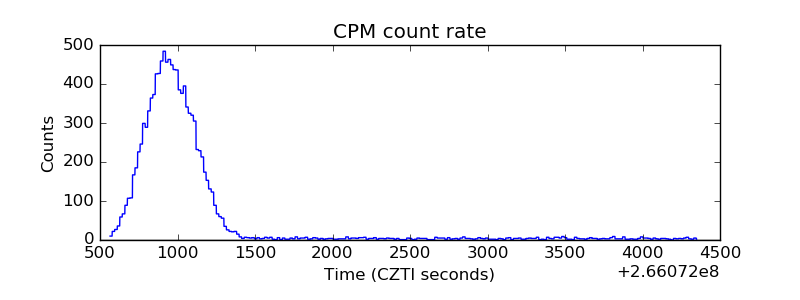 |
| CZT Counter | 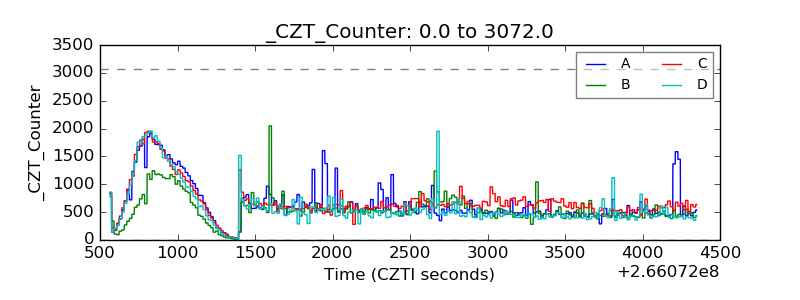 |
| +2.5 Volts monitor |  |
| +5 Volts monitor |  |
| _ROLL_ROT | 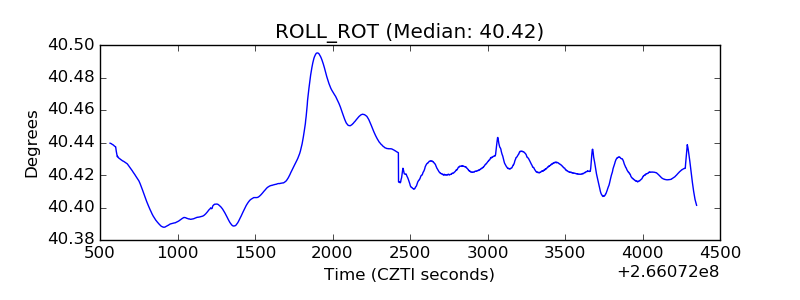 |
| _Roll_DEC | 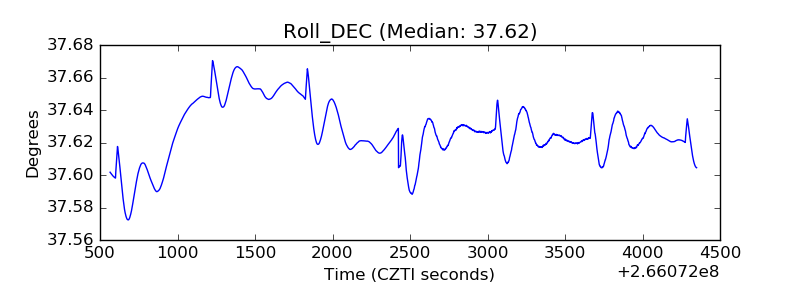 |
| _Roll_RA | 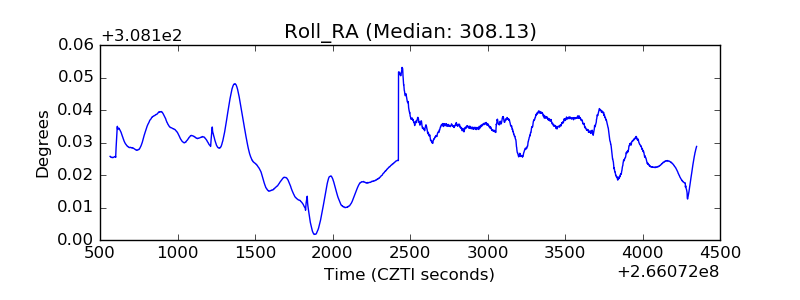 |
| Veto Counter | 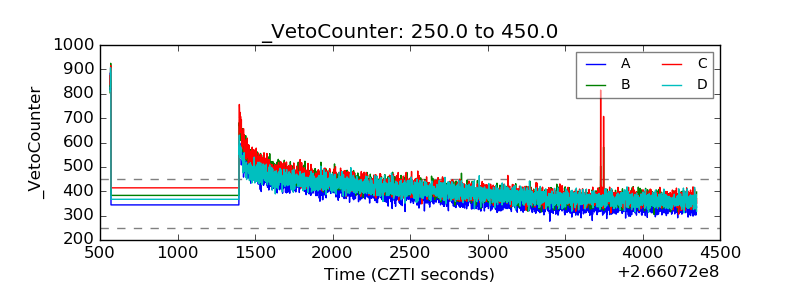 |