| Param | Original file | Final file |
|---|---|---|
| Filename | modeM0/AS1A04_089T01_9000002146_14556cztM0_level2.evt | modeM0/AS1A04_089T01_9000002146_14556cztM0_level2_quad_clean.evt |
| Size (bytes) | 237,902,400 | 34,799,040 |
| Size | 226.9 MB | 33.2 MB |
| Events in quadrant A | 1,990,836 | 213,043 |
| Events in quadrant B | 1,566,665 | 215,175 |
| Events in quadrant C | 1,797,893 | 206,712 |
| Events in quadrant D | 1,648,247 | 208,599 |
| Mode SS | |||
|---|---|---|---|
| Quadrant | BADHDUFLAG | Total packets | Discarded packets |
| A | 0 | 60 | 0 |
| B | 0 | 60 | 0 |
| C | 0 | 60 | 0 |
| D | 0 | 60 | 0 |
| Mode M9 | |||
|---|---|---|---|
| Quadrant | BADHDUFLAG | Total packets | Discarded packets |
| A | 0 | 10 | 0 |
| B | 0 | 10 | 0 |
| C | 0 | 10 | 0 |
| D | 0 | 10 | 0 |
| Mode M0 | |||
|---|---|---|---|
| Quadrant | BADHDUFLAG | Total packets | Discarded packets |
| A | 0 | 7889 | 2 |
| B | 0 | 6501 | 1 |
| C | 0 | 7429 | 1 |
| D | 0 | 6844 | 1 |
| Quadrant | Total seconds | Saturated seconds | Saturation percentage |
|---|---|---|---|
| A | 2942 | 51 | 1.733515% |
| B | 2942 | 49 | 1.665534% |
| C | 2942 | 30 | 1.019714% |
| D | 2942 | 100 | 3.399048% |
Noise dominated data is calculated using 1-second bins in cleaned event files. If a bin has >2000 counts, and if more than 50% of those come from <1% of pixels, then it is considered to be noise-dominated and hence unusable.
| Quadrant | # 1 sec bins | Bins with >0 counts | Bins with >2000 counts | High rate bins dominated by noise | Noise dominated (total time) | Noise dominated (detector-on time) | Marked lightcurve |
|---|---|---|---|---|---|---|---|
| A | 3943 | 2944 | 0 | 0 | 0.00% | 0.00% | 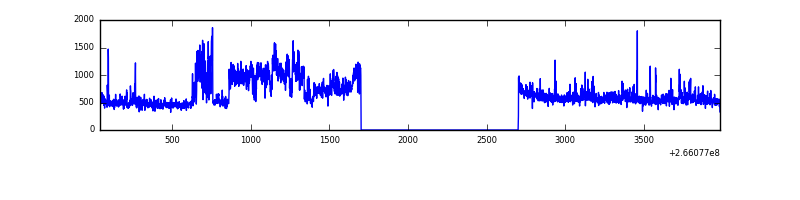 |
| B | 3943 | 2944 | 4 | 4 | 0.10% | 0.14% | 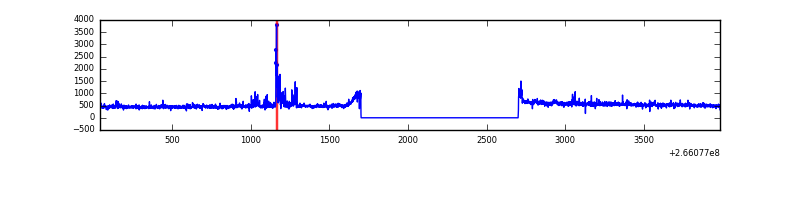 |
| C | 3943 | 2944 | 0 | 0 | 0.00% | 0.00% | 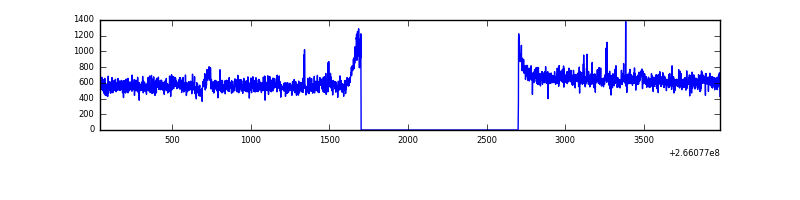 |
| D | 3943 | 2944 | 58 | 58 | 1.47% | 1.97% | 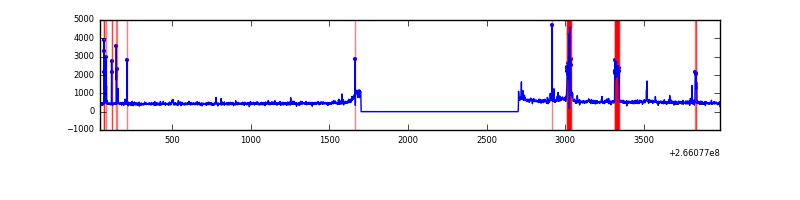 |
Top three noisy pixels from each quadrant. If the there are fewer than three noisy pixels in the level2.evt file, extra rows are filled as -1
| Pixel properties | Quadrant properties | ||||||
|---|---|---|---|---|---|---|---|
| Quadrant | DetID | PixID | Counts | Sigma | Mean | Median | Sigma |
| A | 0 | 23 | 309115 | 3926.44 | 379 | 370 | 78.6 |
| A | 12 | 189 | 108176 | 1371.02 | 379 | 370 | 78.6 |
| A | 8 | 15 | 89769 | 1136.93 | 379 | 370 | 78.6 |
| B | 12 | 18 | 33179 | 440.72 | 377 | 368 | 74.4 |
| B | 10 | 245 | 22273 | 294.23 | 377 | 368 | 74.4 |
| B | 12 | 2 | 12607 | 164.4 | 377 | 368 | 74.4 |
| C | 3 | 233 | 357421 | 4130.34 | 366 | 369 | 86.4 |
| C | 6 | 96 | 9125 | 101.29 | 366 | 369 | 86.4 |
| C | 13 | 61 | 2691 | 26.86 | 366 | 369 | 86.4 |
| D | 5 | 223 | 84294 | 931.23 | 365 | 356 | 90.1 |
| D | 2 | 152 | 67702 | 747.16 | 365 | 356 | 90.1 |
| D | 10 | 199 | 44052 | 484.78 | 365 | 356 | 90.1 |
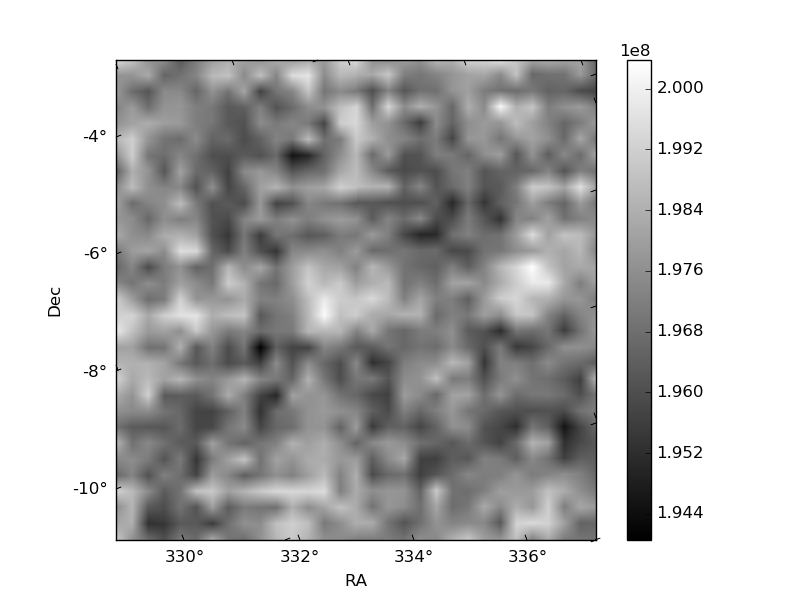
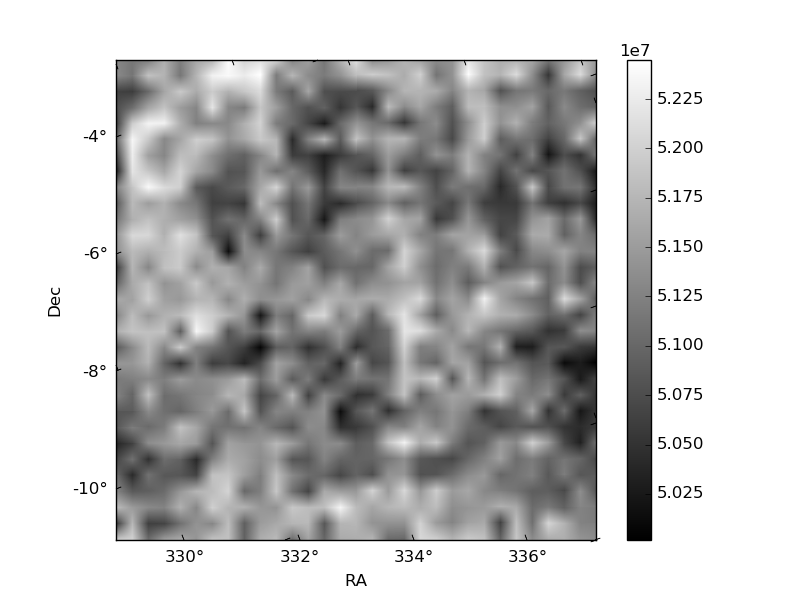
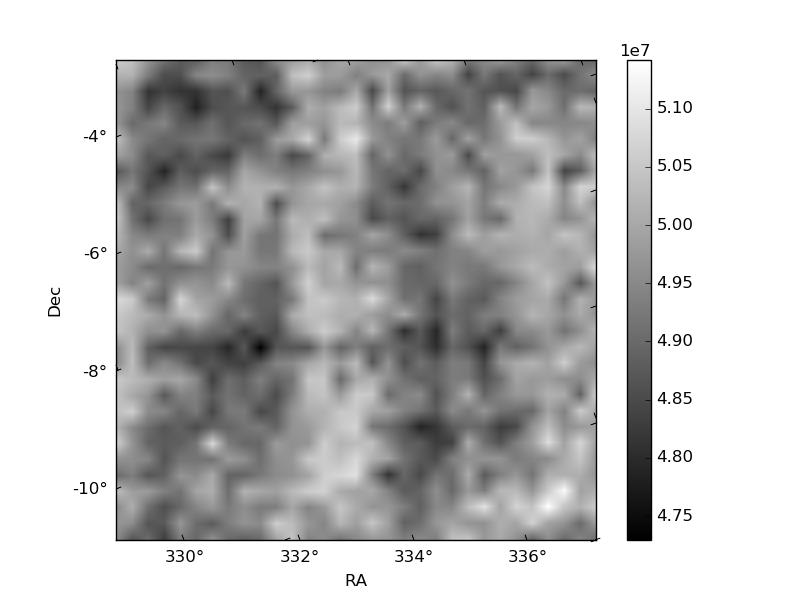
Histogram calculated using DETX and DETY for each event in the final _common_clean file
| Quadrant A | 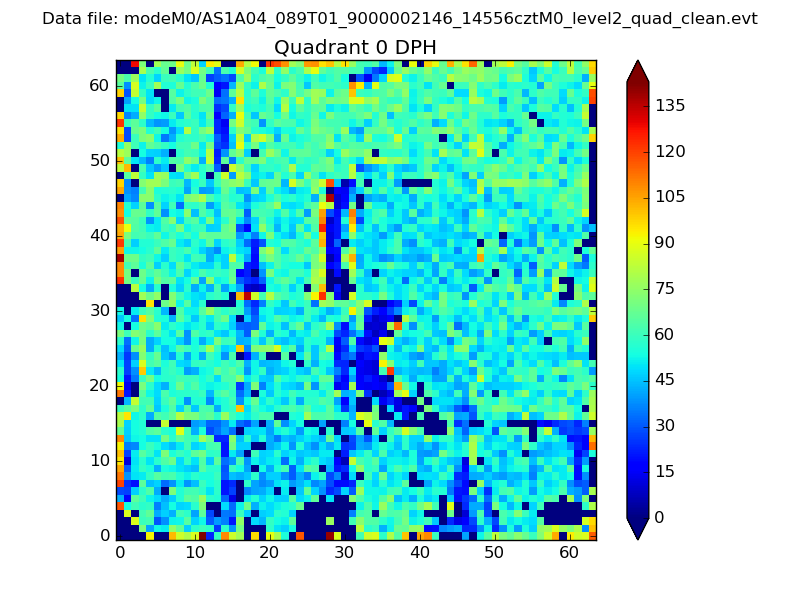 |
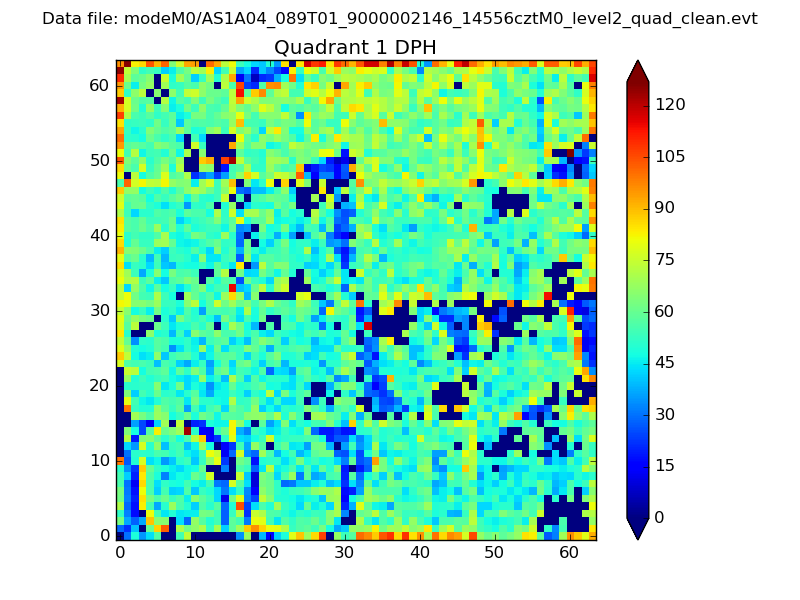 |
Quadrant B |
|---|---|---|---|
| Quadrant D | 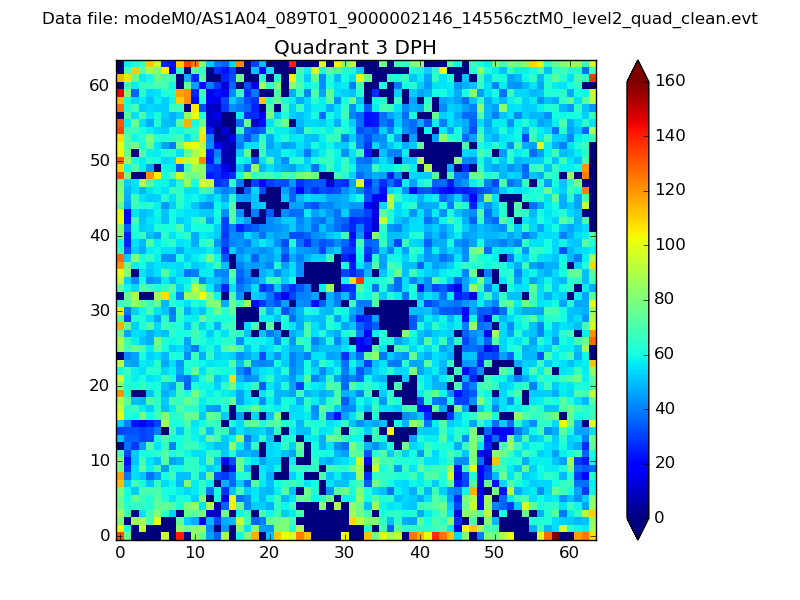 |
 |
Quadrant C |
| Plot type | Count rate plots | Images |
|---|---|---|
| Comparison with Poisson distribution Blue bars denote a histogram of data divided into 1 sec bins. Red curve is a Poisson curve with rate = median count rate of data. |
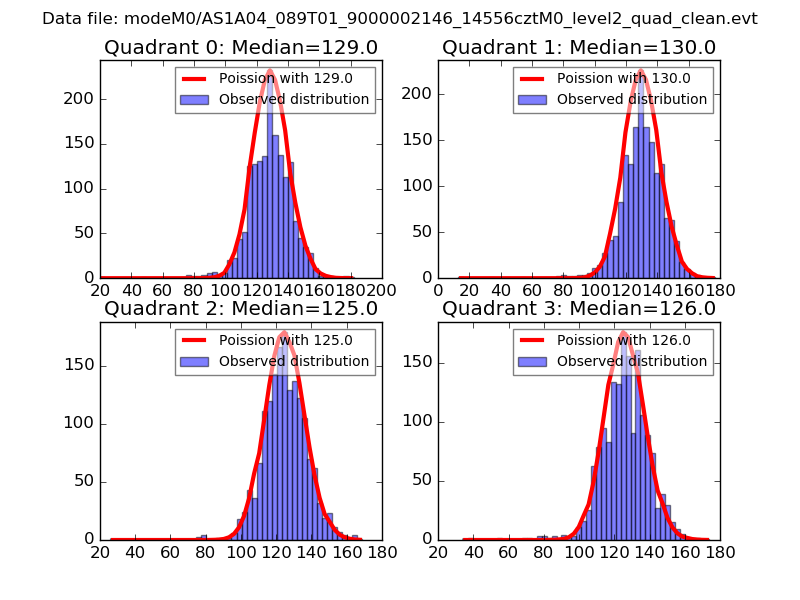 |
 |
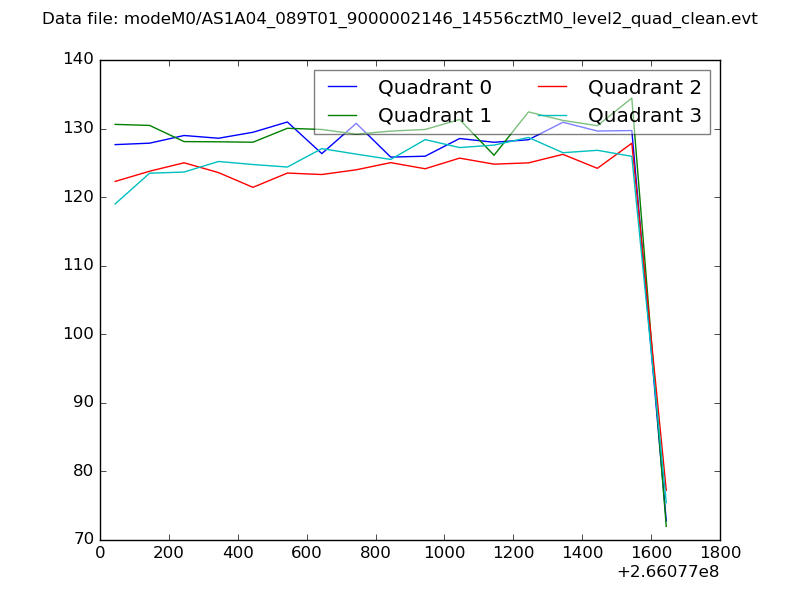
| Quadrant-wise count rates Data is divided into 100 sec bins |
 |
|
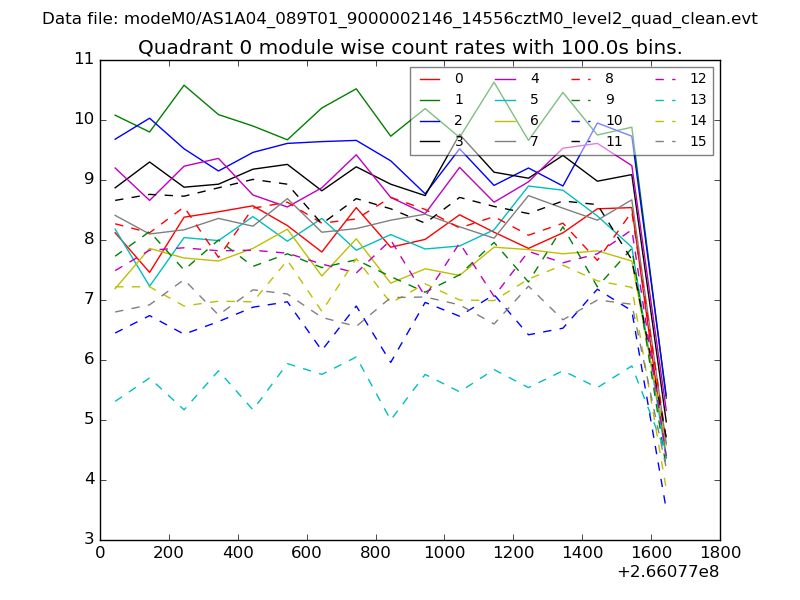
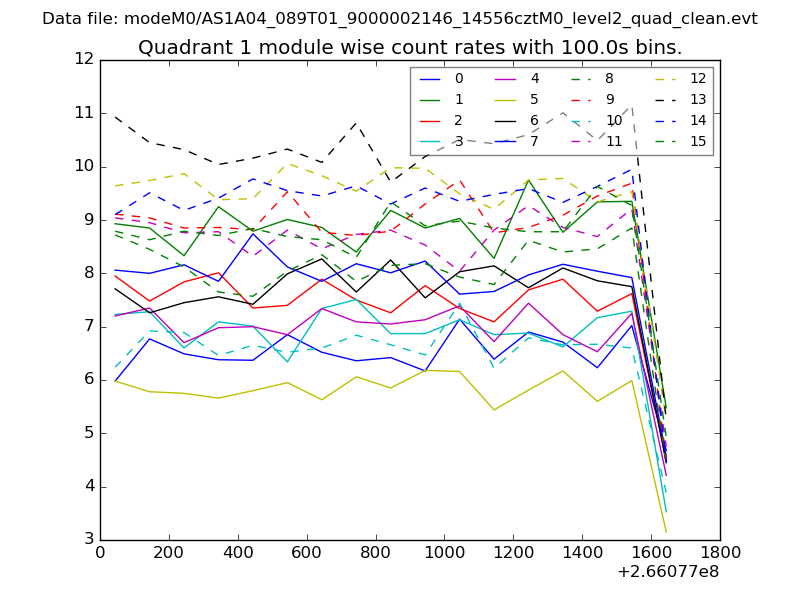
| Module-wise count rates for Quadrant A Data is divided into 100 sec bins |
 |
 |
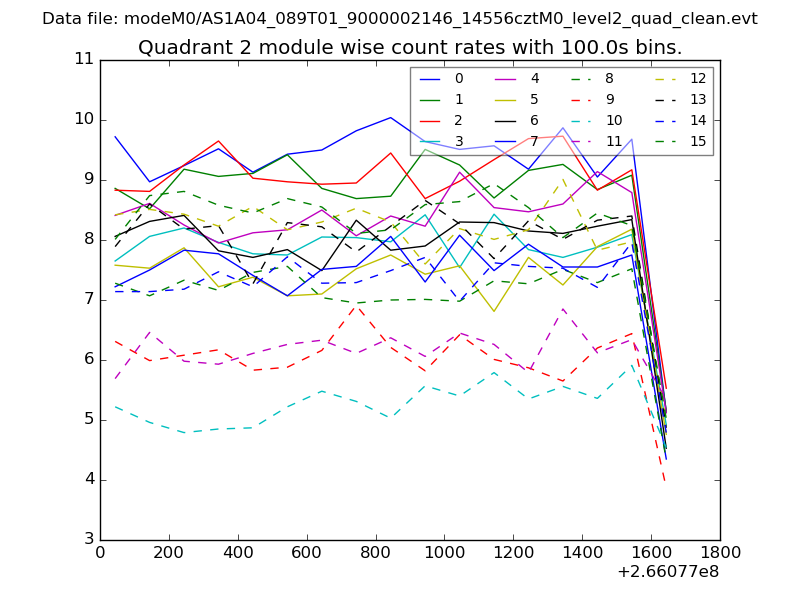
| Module-wise count rates for Quadrant B Data is divided into 100 sec bins |
 |
 |
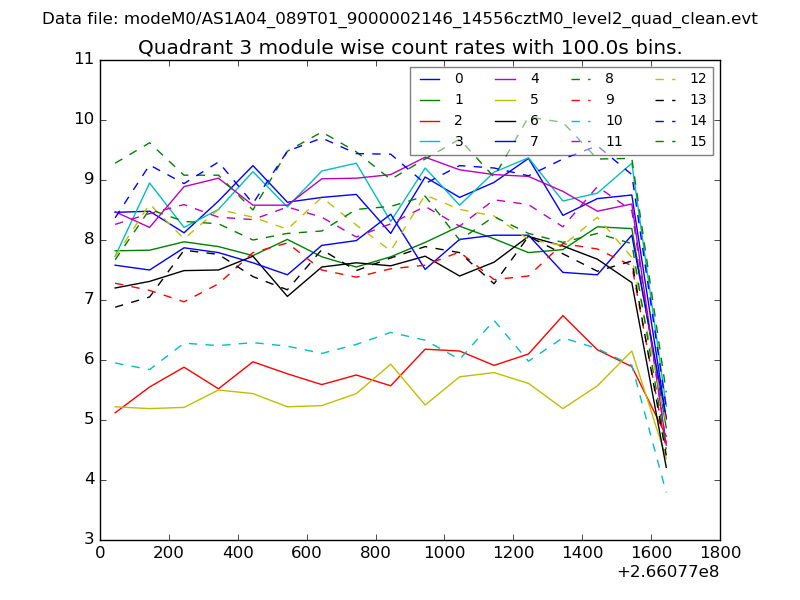
| Module-wise count rates for Quadrant C Data is divided into 100 sec bins |
 |
 |
| Module-wise count rates for Quadrant D Data is divided into 100 sec bins |
 |
 |
| Parameter | Plot |
|---|---|
| CZT HV Monitor | 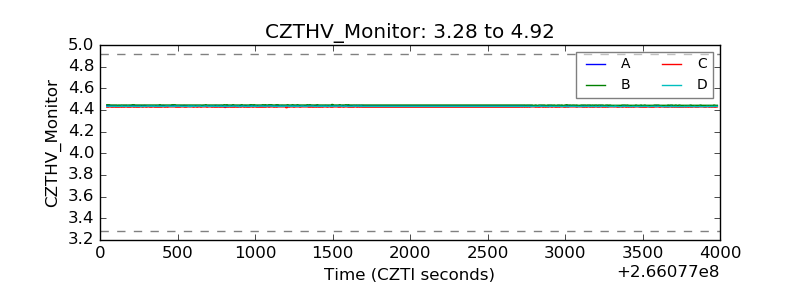 |
| D_VDD | 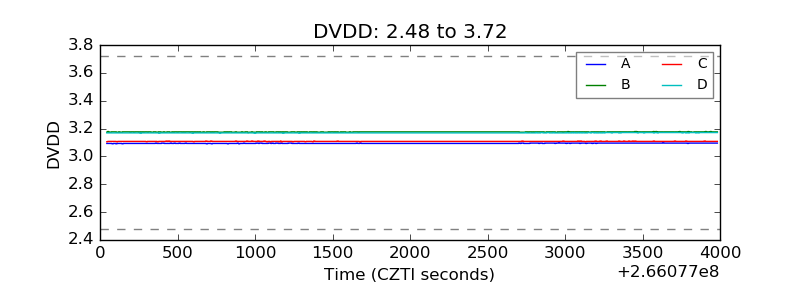 |
| Temperature 1 | 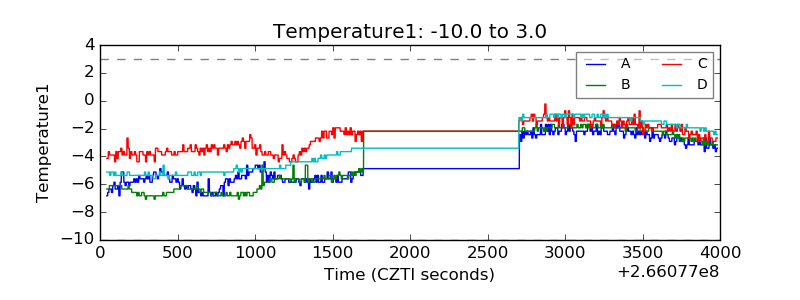 |
| Veto HV Monitor | 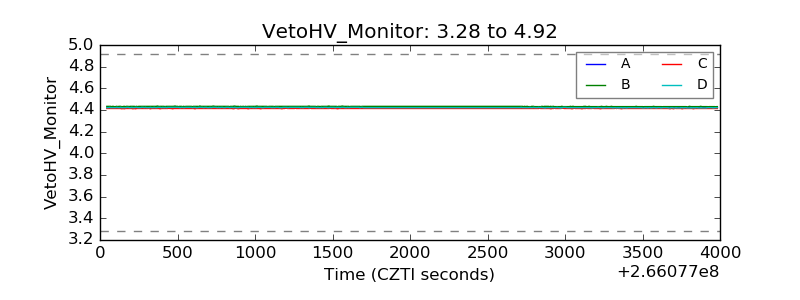 |
| Veto LLD | 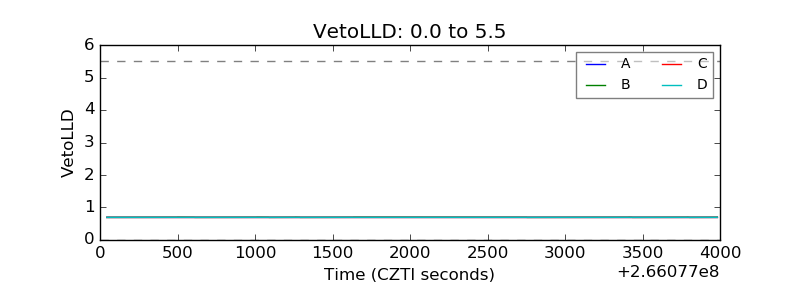 |
| Alpha Counter | 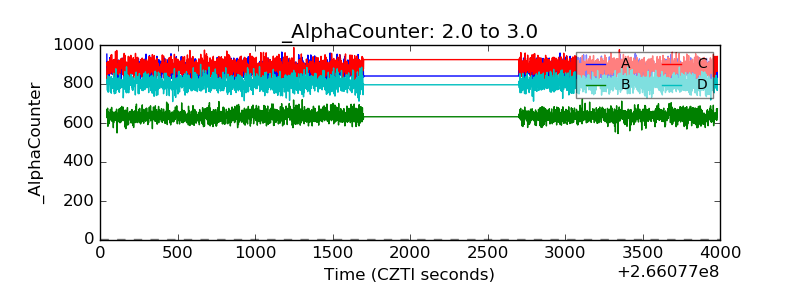 |
| _CPM_Rate | 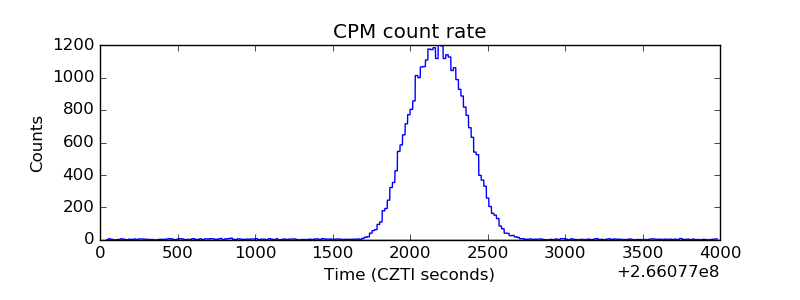 |
| CZT Counter |  |
| +2.5 Volts monitor |  |
| +5 Volts monitor | 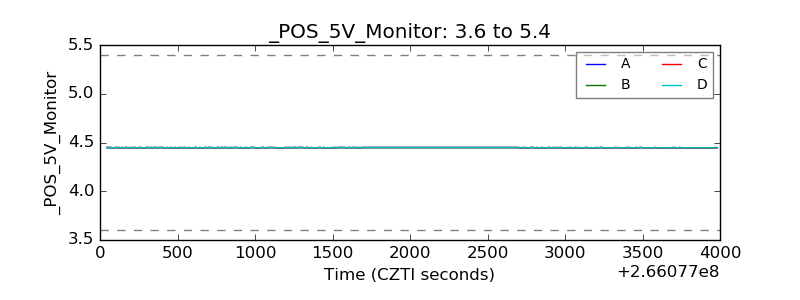 |
| _ROLL_ROT | 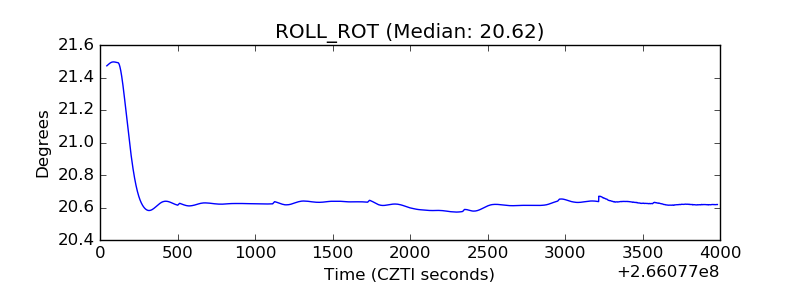 |
| _Roll_DEC | 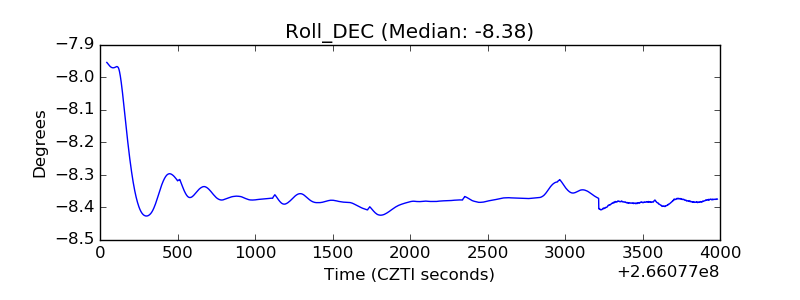 |
| _Roll_RA | 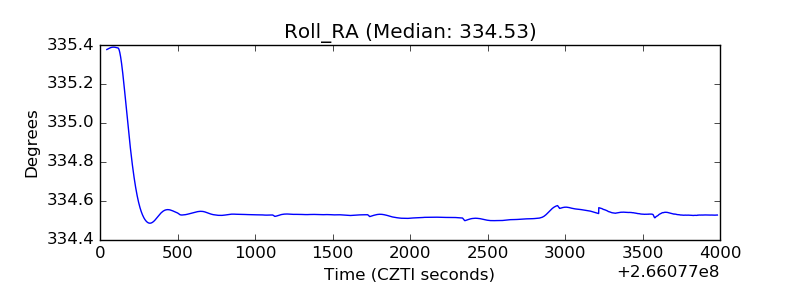 |
| Veto Counter | 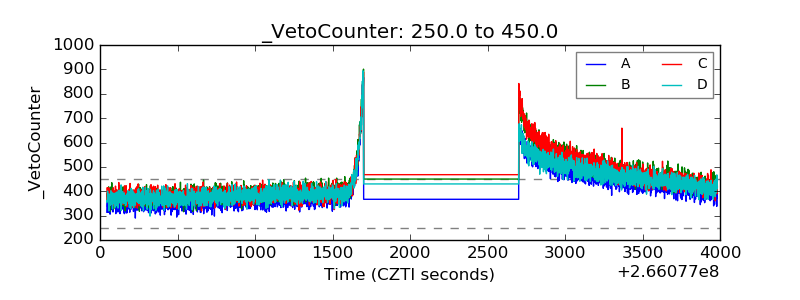 |