| Param | Original file | Final file |
|---|---|---|
| Filename | modeM0/AS1A04_089T01_9000002146_14560cztM0_level2.evt | modeM0/AS1A04_089T01_9000002146_14560cztM0_level2_quad_clean.evt |
| Size (bytes) | 548,654,400 | 100,802,880 |
| Size | 523.2 MB | 96.1 MB |
| Events in quadrant A | 4,789,451 | 650,701 |
| Events in quadrant B | 3,732,373 | 668,143 |
| Events in quadrant C | 3,872,063 | 645,011 |
| Events in quadrant D | 3,774,143 | 627,969 |
| Mode SS | |||
|---|---|---|---|
| Quadrant | BADHDUFLAG | Total packets | Discarded packets |
| A | 0 | 136 | 0 |
| B | 0 | 136 | 0 |
| C | 0 | 136 | 0 |
| D | 0 | 136 | 0 |
| Mode M9 | |||
|---|---|---|---|
| Quadrant | BADHDUFLAG | Total packets | Discarded packets |
| A | 0 | 25 | 0 |
| B | 0 | 25 | 0 |
| C | 0 | 25 | 0 |
| D | 0 | 25 | 0 |
| Mode M0 | |||
|---|---|---|---|
| Quadrant | BADHDUFLAG | Total packets | Discarded packets |
| A | 0 | 18909 | 3 |
| B | 0 | 15333 | 2 |
| C | 0 | 15591 | 2 |
| D | 0 | 15466 | 2 |
| Quadrant | Total seconds | Saturated seconds | Saturation percentage |
|---|---|---|---|
| A | 6614 | 153 | 2.313275% |
| B | 6614 | 134 | 2.026005% |
| C | 6614 | 64 | 0.967644% |
| D | 6614 | 124 | 1.874811% |
Noise dominated data is calculated using 1-second bins in cleaned event files. If a bin has >2000 counts, and if more than 50% of those come from <1% of pixels, then it is considered to be noise-dominated and hence unusable.
| Quadrant | # 1 sec bins | Bins with >0 counts | Bins with >2000 counts | High rate bins dominated by noise | Noise dominated (total time) | Noise dominated (detector-on time) | Marked lightcurve |
|---|---|---|---|---|---|---|---|
| A | 9160 | 6617 | 2 | 2 | 0.02% | 0.03% | 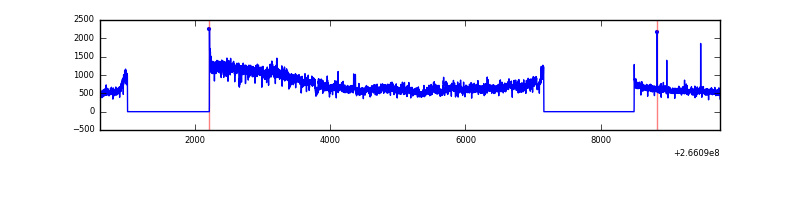 |
| B | 9160 | 6617 | 10 | 10 | 0.11% | 0.15% | 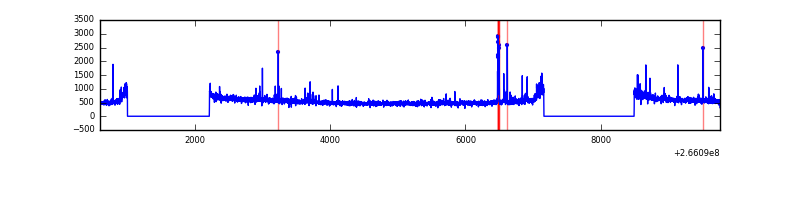 |
| C | 9160 | 6617 | 0 | 0 | 0.00% | 0.00% | 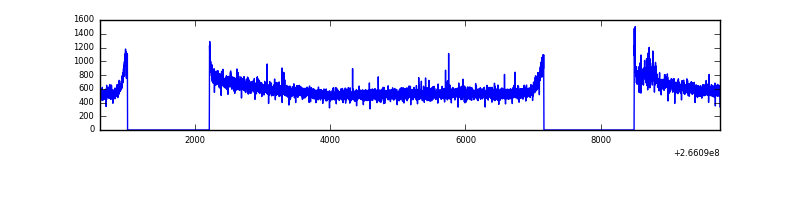 |
| D | 9160 | 6617 | 54 | 54 | 0.59% | 0.82% | 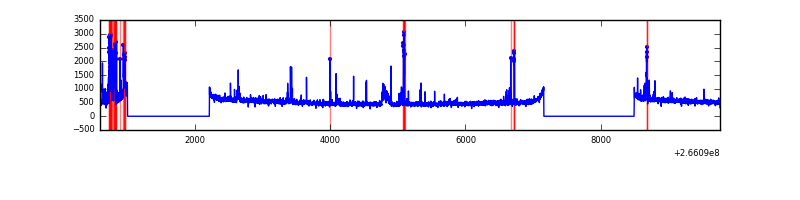 |
Top three noisy pixels from each quadrant. If the there are fewer than three noisy pixels in the level2.evt file, extra rows are filled as -1
| Pixel properties | Quadrant properties | ||||||
|---|---|---|---|---|---|---|---|
| Quadrant | DetID | PixID | Counts | Sigma | Mean | Median | Sigma |
| A | 0 | 23 | 1085170 | 5942.52 | 895 | 876 | 182.5 |
| A | 12 | 189 | 103096 | 560.22 | 895 | 876 | 182.5 |
| A | 0 | 226 | 74007 | 400.8 | 895 | 876 | 182.5 |
| B | 0 | 189 | 45515 | 263.2 | 901 | 880 | 169.6 |
| B | 0 | 219 | 43208 | 249.6 | 901 | 880 | 169.6 |
| B | 10 | 247 | 38375 | 221.1 | 901 | 880 | 169.6 |
| C | 3 | 233 | 439641 | 2165.62 | 880 | 888 | 202.6 |
| C | 13 | 61 | 6301 | 26.72 | 880 | 888 | 202.6 |
| C | 3 | 202 | 2118 | 6.07 | 880 | 888 | 202.6 |
| D | 10 | 199 | 213772 | 1001.62 | 877 | 853 | 212.6 |
| D | 12 | 110 | 113241 | 528.7 | 877 | 853 | 212.6 |
| D | 2 | 152 | 42282 | 194.89 | 877 | 853 | 212.6 |
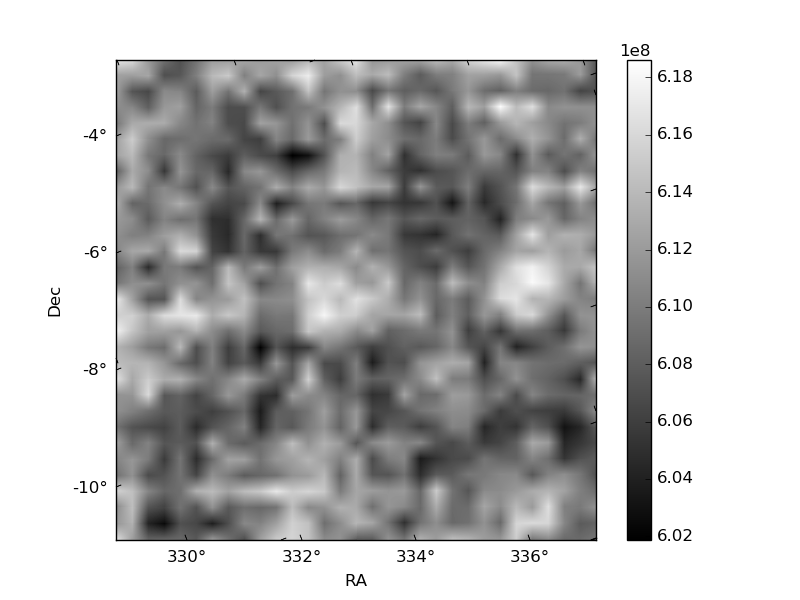
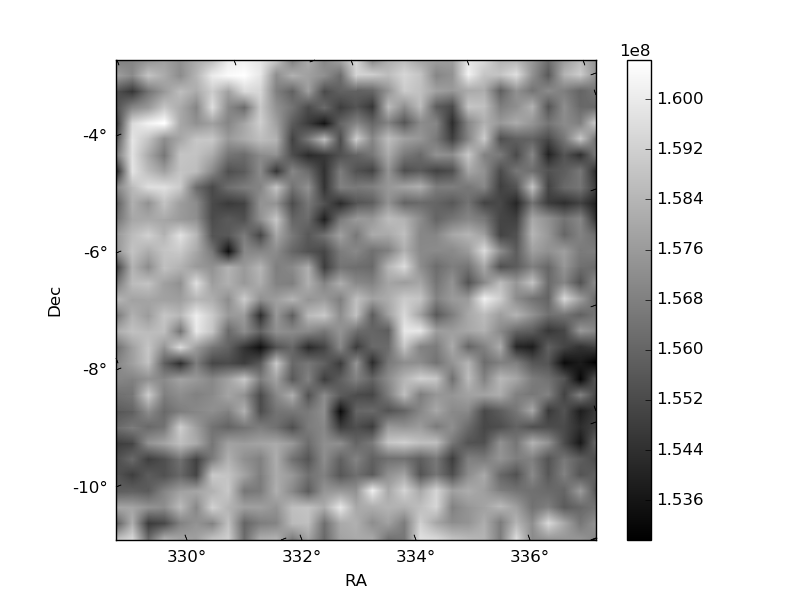
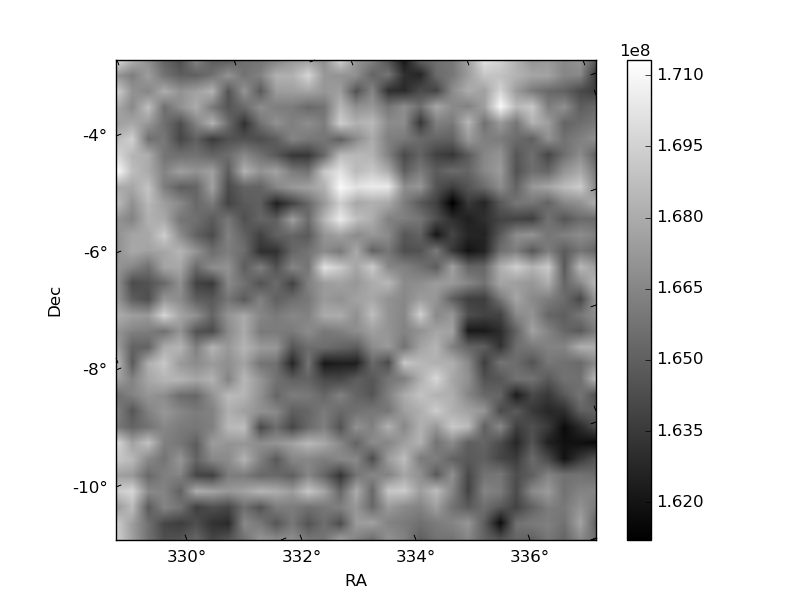
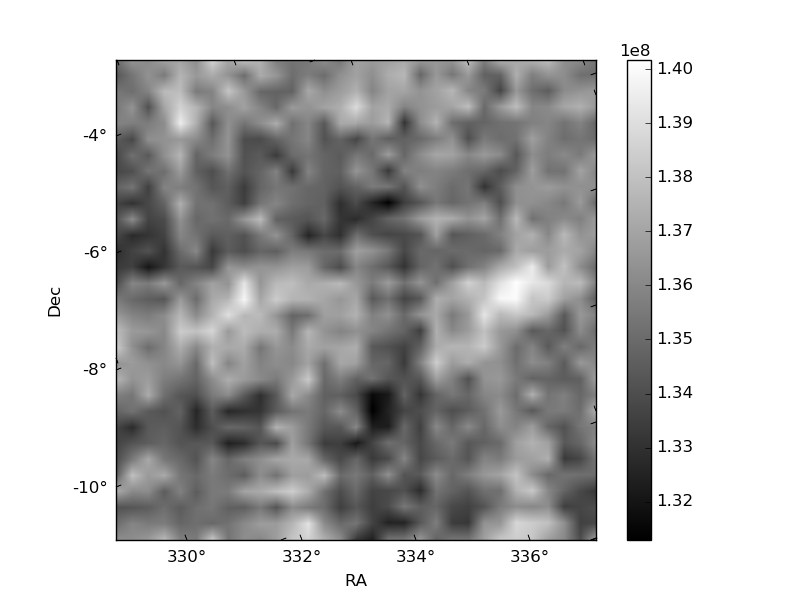
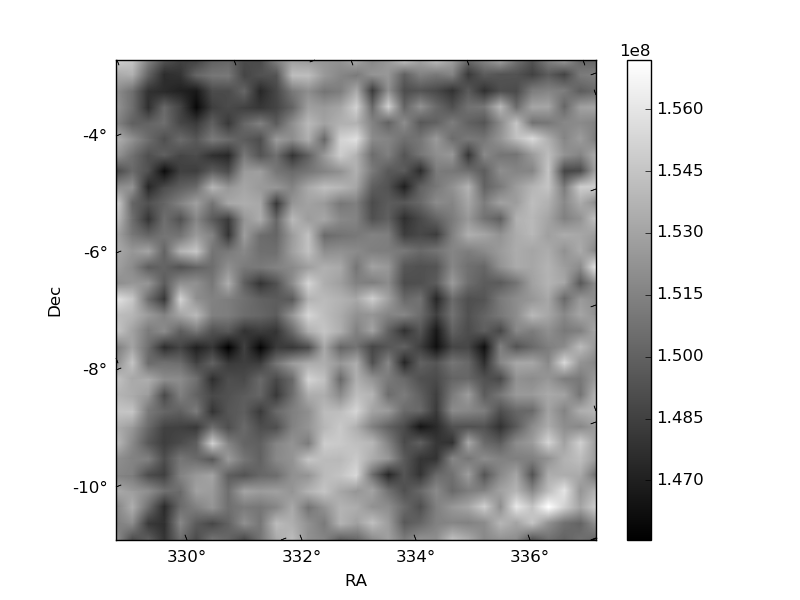
Histogram calculated using DETX and DETY for each event in the final _common_clean file
| Quadrant A | 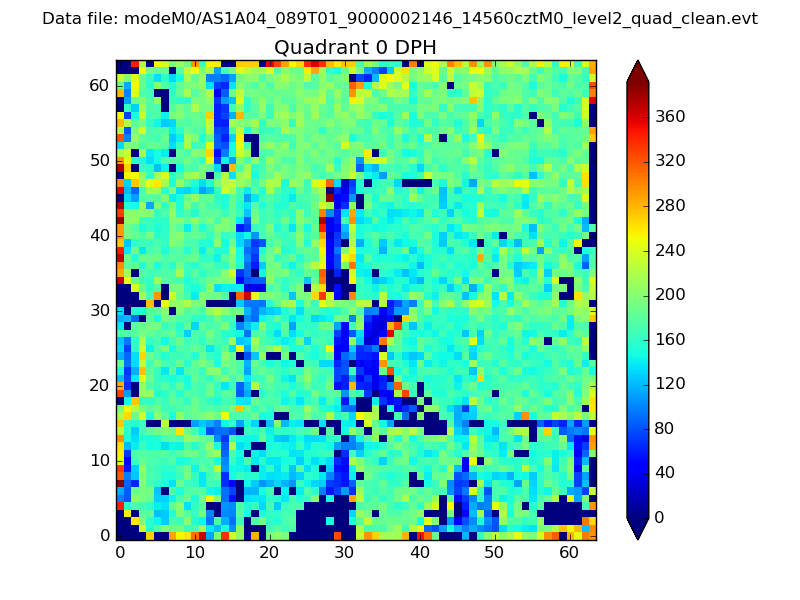 |
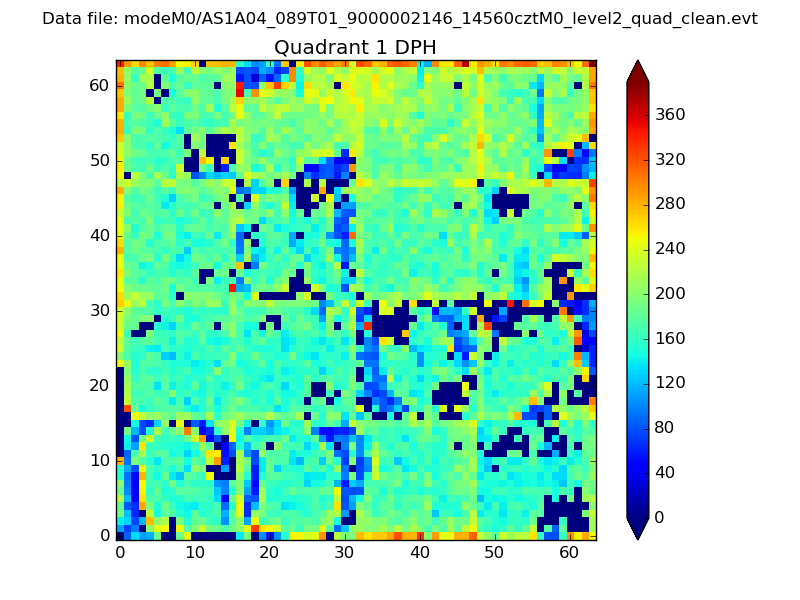 |
Quadrant B |
|---|---|---|---|
| Quadrant D |  |
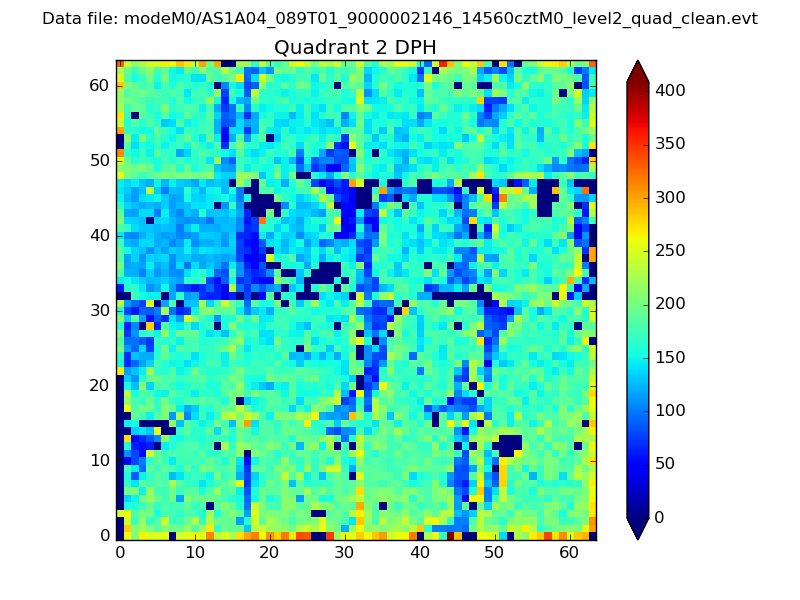 |
Quadrant C |
| Plot type | Count rate plots | Images |
|---|---|---|
| Comparison with Poisson distribution Blue bars denote a histogram of data divided into 1 sec bins. Red curve is a Poisson curve with rate = median count rate of data. |
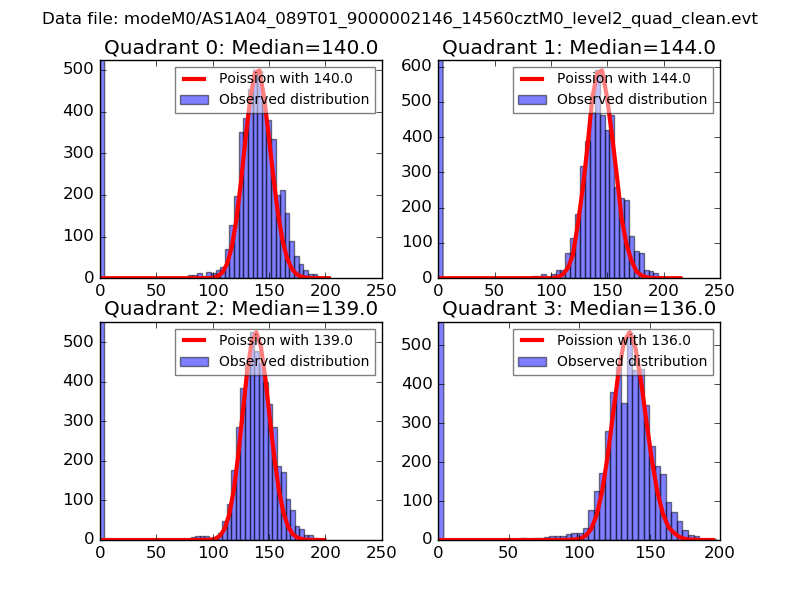 |
 |
| Quadrant-wise count rates Data is divided into 100 sec bins |
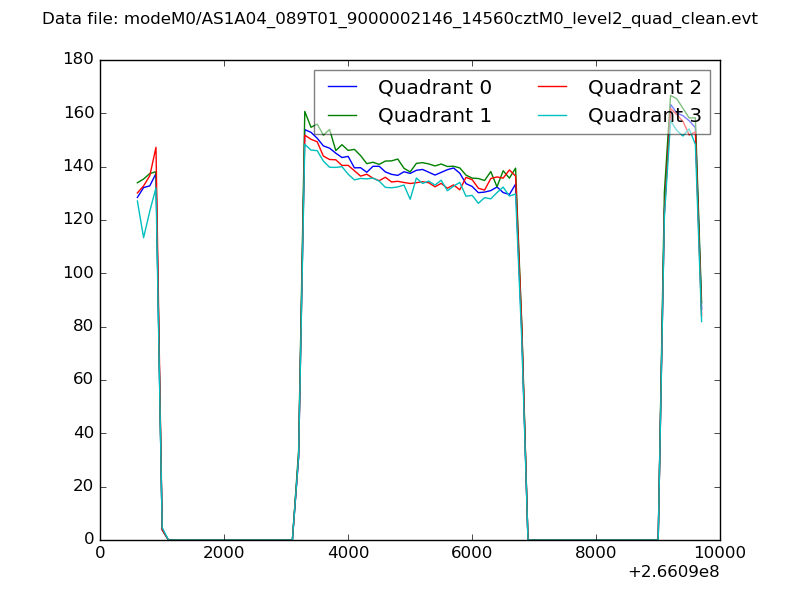 |
|
| Module-wise count rates for Quadrant A Data is divided into 100 sec bins |
 |
 |
| Module-wise count rates for Quadrant B Data is divided into 100 sec bins |
 |
 |
| Module-wise count rates for Quadrant C Data is divided into 100 sec bins |
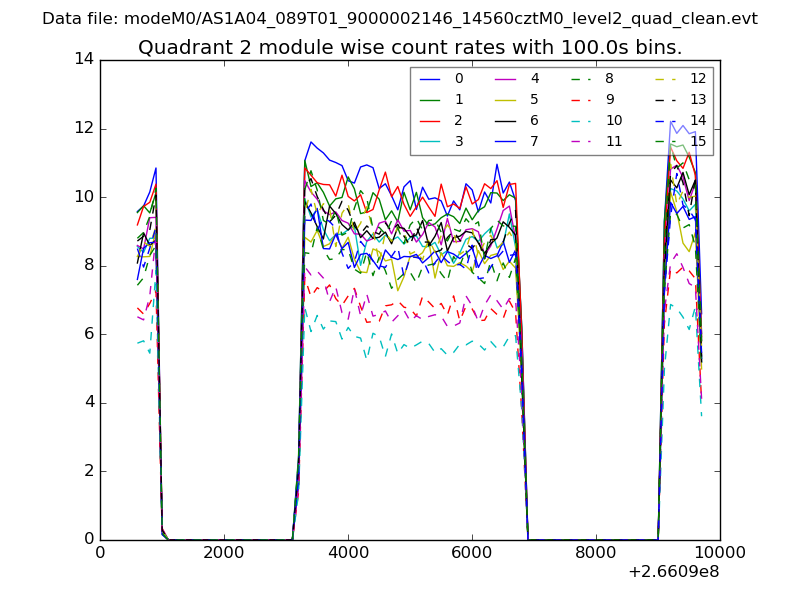 |
 |
| Module-wise count rates for Quadrant D Data is divided into 100 sec bins |
 |
 |
| Parameter | Plot |
|---|---|
| CZT HV Monitor |  |
| D_VDD | 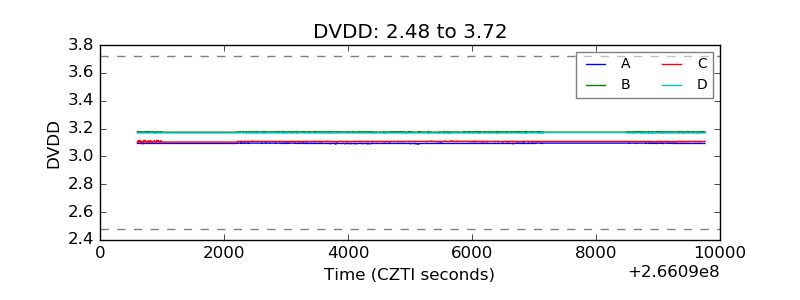 |
| Temperature 1 | 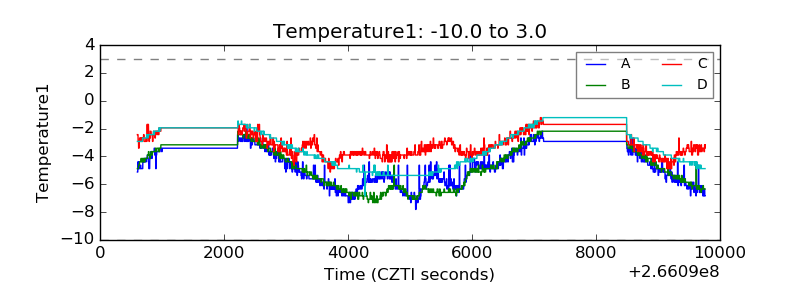 |
| Veto HV Monitor | 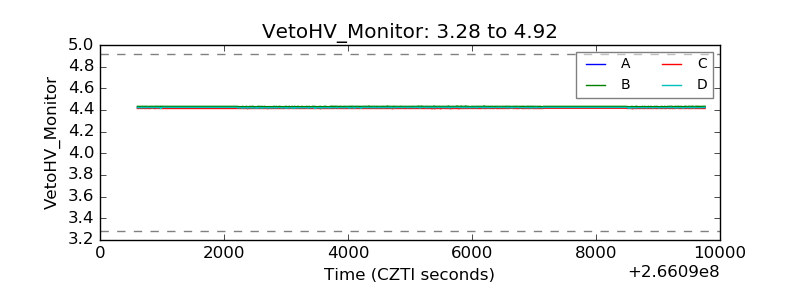 |
| Veto LLD | 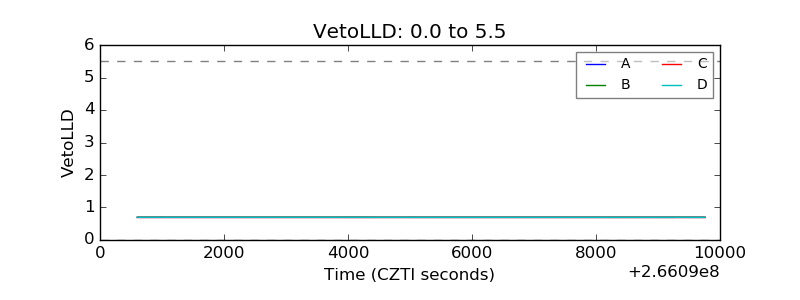 |
| Alpha Counter | 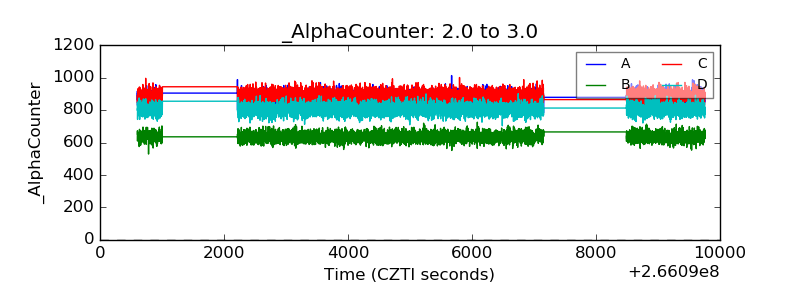 |
| _CPM_Rate | 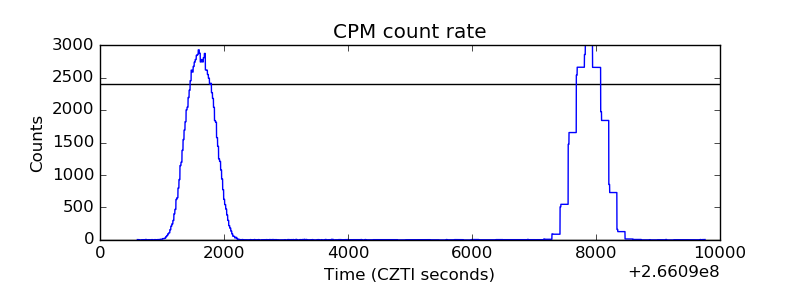 |
| CZT Counter | 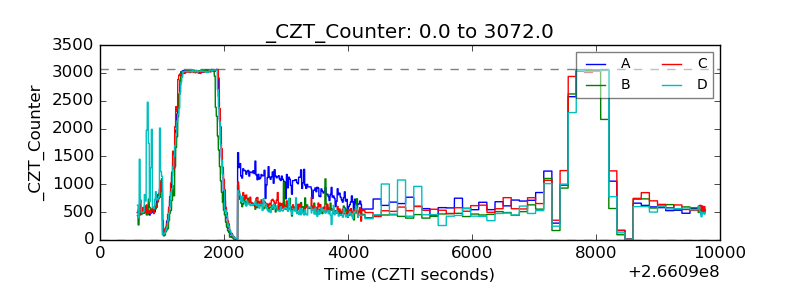 |
| +2.5 Volts monitor | 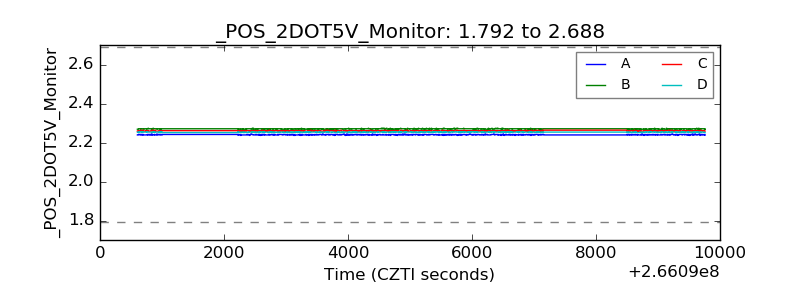 |
| +5 Volts monitor |  |
| _ROLL_ROT |  |
| _Roll_DEC | 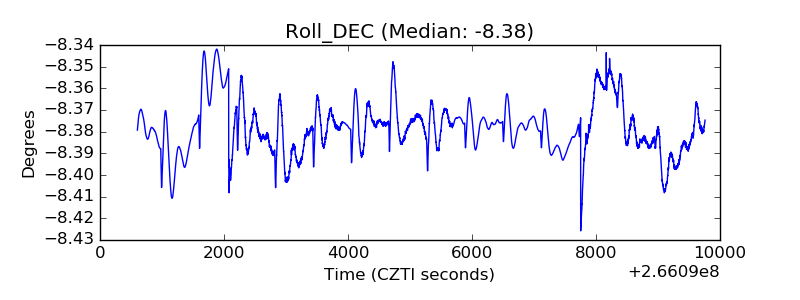 |
| _Roll_RA | 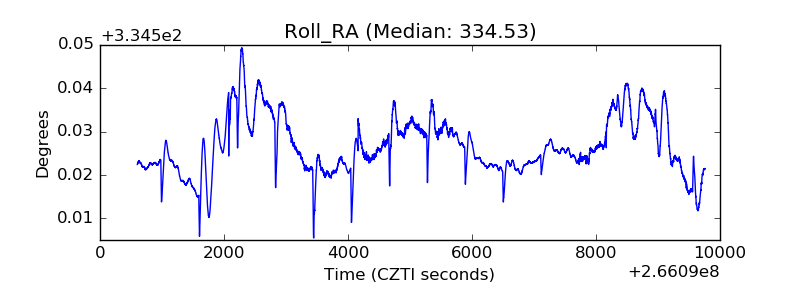 |
| Veto Counter |  |